Quick Start Guide
This guide helps you get from a fresh installation to a first working result in StreamPipes.
The guide begins with installation and then walks through one complete first-run flow in the product.
Before you start
The easiest way to install StreamPipes is the Docker-based installation.
Prerequisites
You need:
DockerDocker Compose- a recent version of
Chrome,Firefox, orEdge
The Docker-based installation is supported on:
LinuxmacOSWindows 10and newer
Go to docs.docker.com and follow the instructions for your operating system.
Make sure Docker can be started as a non-root user where required and verify the installation with a simple test such as docker run hello-world.
Install StreamPipes
Use the installation package below to start a local or test instance.
Download Apache StreamPipes 0.98.0
Download the latest Apache StreamPipes source release and extract the archive to a directory of your choice. The package includes the installer and the reference deployment presets.
| File | Version | Release Date | Verification |
|---|---|---|---|
| apache-streampipes-0.98.0-source-release.zip | 0.98.0 | 2025-12-15 | SHA512 · PGP |
Verify the release using the published signatures and the project release KEYS. See the official ASF verification instructions for the recommended procedure.
Review the current release notes before upgrading existing environments.
Start StreamPipes in a few steps
Start the installer
Open the folder installer/compose/ and run docker compose up -d. If your environment still uses the legacy Compose binary, docker-compose up -d works as well.
For additional deployment models and broker-specific setups, continue with the deployment documentation.
Open the web interface
Open your browser and navigate to http://localhost:80, or use the host name of the server where StreamPipes is running, and complete the setup flow in the UI.
The default credentials are admin@streampipes.apache.org and admin.
For production-oriented setups, also review the Kubernetes-based deployment options that are part of the installation kit or check the Deployment section.
After starting StreamPipes and opening the provided URL in your browser, StreamPipes performs its initial installation flow.
You should see the following login screen:
Login Screen
After login, you are ready to work in the web interface.
If the installation does not complete successfully, the most common reason is an underpowered local environment.
Check that:
- Docker has enough memory assigned
- all required containers are running
- you restarted the stack cleanly if the first startup failed
If necessary, stop the deployment, remove the containers, and start again with a clean state.
First steps
After installation, this quick start takes you through one simple end-to-end workflow:
- create a sample adapter using the machine data simulator
- persist the events so StreamPipes creates a dataset
- create a chart from that dataset
- add the chart to a dashboard
The goal is not to explain every feature. The goal is to get one complete flow running so you understand how StreamPipes works as an industrial data platform.
Connect a data source
Create one adapter in Connect so StreamPipes can start receiving events.
Create a reusable data stream
Publish the source into the platform as a managed stream other features can use.
Persist the data as a dataset
Enable persistence so live events become durable operational data.
Create a chart
Query the dataset and confirm that the data can be visualized correctly.
Place the chart on a dashboard
Turn the first chart into a reusable operational view for monitoring.
If you complete these steps once, the rest of the platform becomes much easier to understand.
Step 1: Connect a first data source
Open Connect and create a new adapter.
For a first test, the Machine Data Simulator is usually the best choice because it lets you validate the platform flow without depending on an external machine or broker.
Recommended first source
Start with the Machine Data Simulator for your first adapter. It removes protocol and network uncertainty from the first run, so you can focus on learning the StreamPipes workflow itself.
To create the adapter:
- Open
Connect. - Click
New Adapter. - Choose
Machine Data Simulator. - Configure the
Machine Data Simulator, e.g., by choosing theFlow Ratesensor and a frequency of1000ms. - Click
Nextto see a preview of the data. We don't apply any transformation script for now, so it's enough to clickNext. - In the
Configure schemasection, choose thetimestamprow and set the scope fromMeasurementtoTimestamp. - Click
Nextto open the adapter settings view.
If your preferred adapter is not visible, first install the required extension in Configuration > Extensions.
Step 2: Start the adapter and persist the events
On the final adapter step, give the adapter a clear name and enable persistence.
To do that:
- Enter a meaningful adapter name.
- Enable
Persist events. - Start the adapter.
If your installation offers additional startup options such as asset linking or event-rate reduction, you can leave them at their defaults for the first run unless you already know you need them.
Why persistence matters in the quick start
Persistence creates a dataset from the incoming events. That dataset becomes the basis for charts and dashboards.
Without persistence, you may still have a live stream, but you will not get the full chart and dashboard workflow that best demonstrates the current StreamPipes product model.
What success looks like
After the adapter starts successfully:
- the stream is available in StreamPipes
- events begin to flow in the live preview dialog
If no data appears later in the quick start, come back to this step first and verify that the adapter is actually running and persistence was enabled.
Step 3: Check the dataset
Next, confirm that the persisted data is available as a dataset.
To do that:
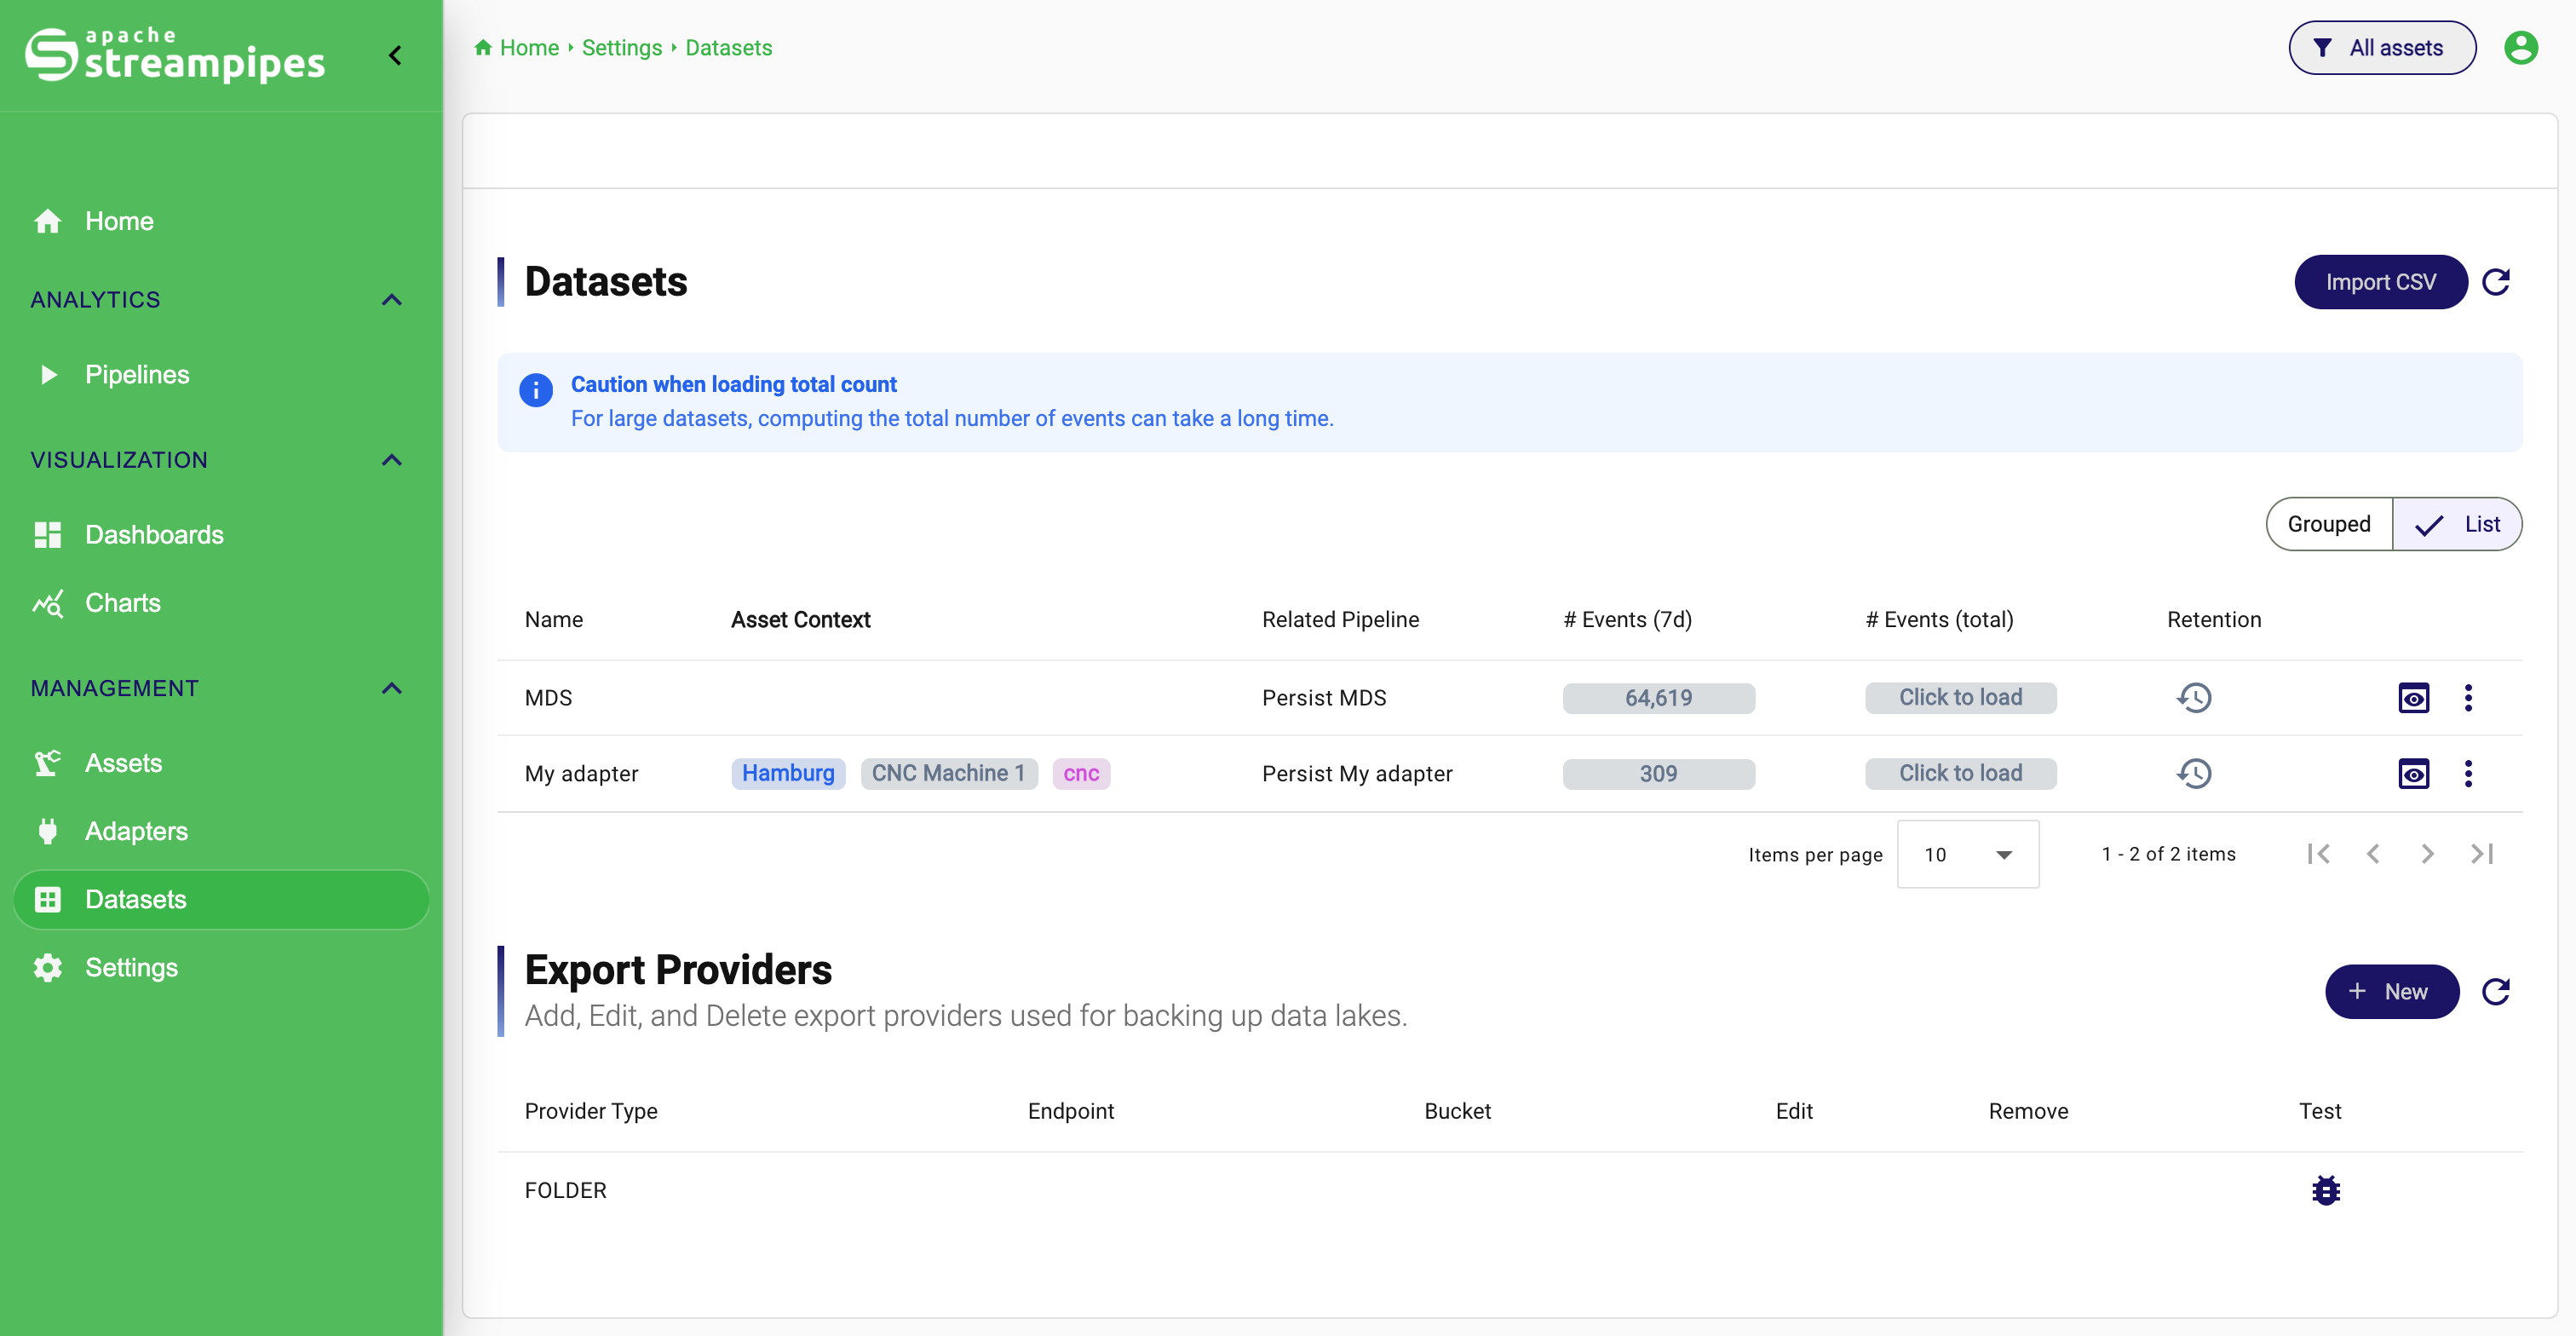
- Open
Datasets. - Find the dataset created from your adapter.
- Check the event counters.
- Open the preview.
You should see incoming records and a schema that matches the data you connected.
This is the first important checkpoint in the quick start. Once data reaches a dataset, the rest of the workflow usually becomes straightforward.
Dataset Overview
Step 4: Create a chart
Now create a visualization from the dataset.
To create your first chart:
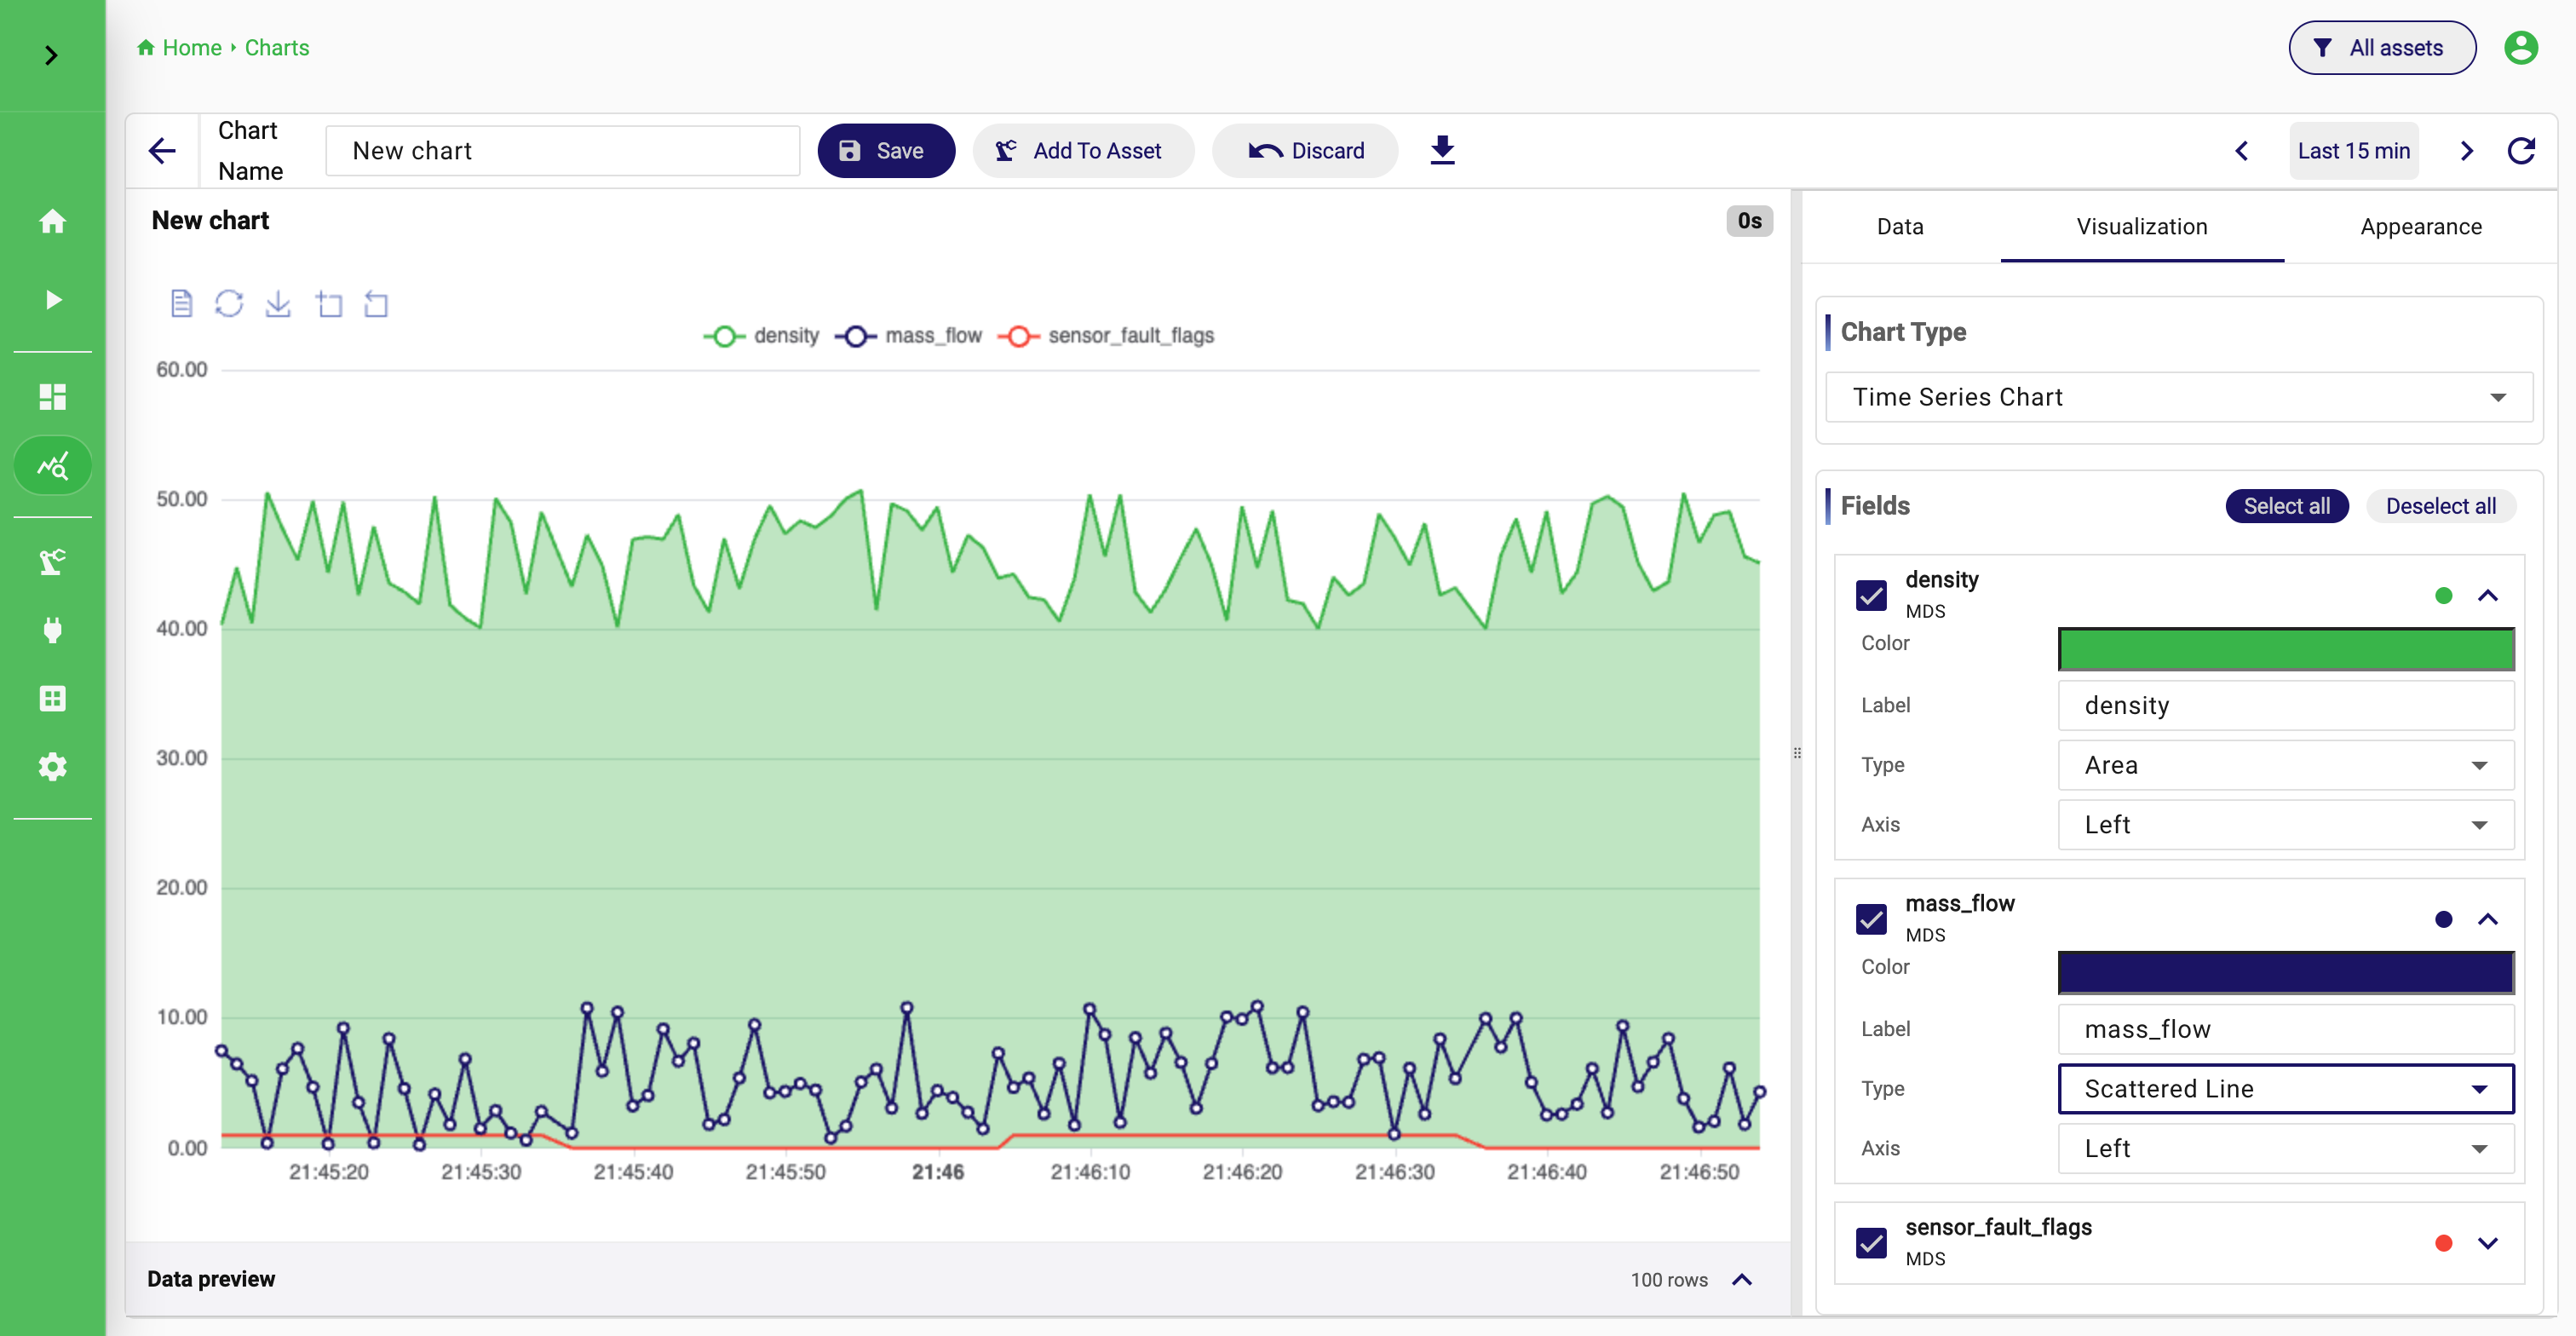
- Open
Charts. - Create a new chart.
- Select the dataset from the dropdown.
- Keep
Rawas a query type. - In the fields selection, choose
Select allto query all fields from the dataset. - Use the preview to confirm the query result.
- Switch to the
Visualizationtab and chooseTime Series Chartas visualization type. - Save the chart.
Step 5: Add the chart to a dashboard
Dashboards in the current StreamPipes version are built from saved charts.
To create a dashboard:
- Open
Dashboards. - Create a new dashboard.
- Open the dashboard if it does not directly open.
- Add the chart you saved in the previous step.
- Arrange the chart on the grid.
- Save the dashboard.
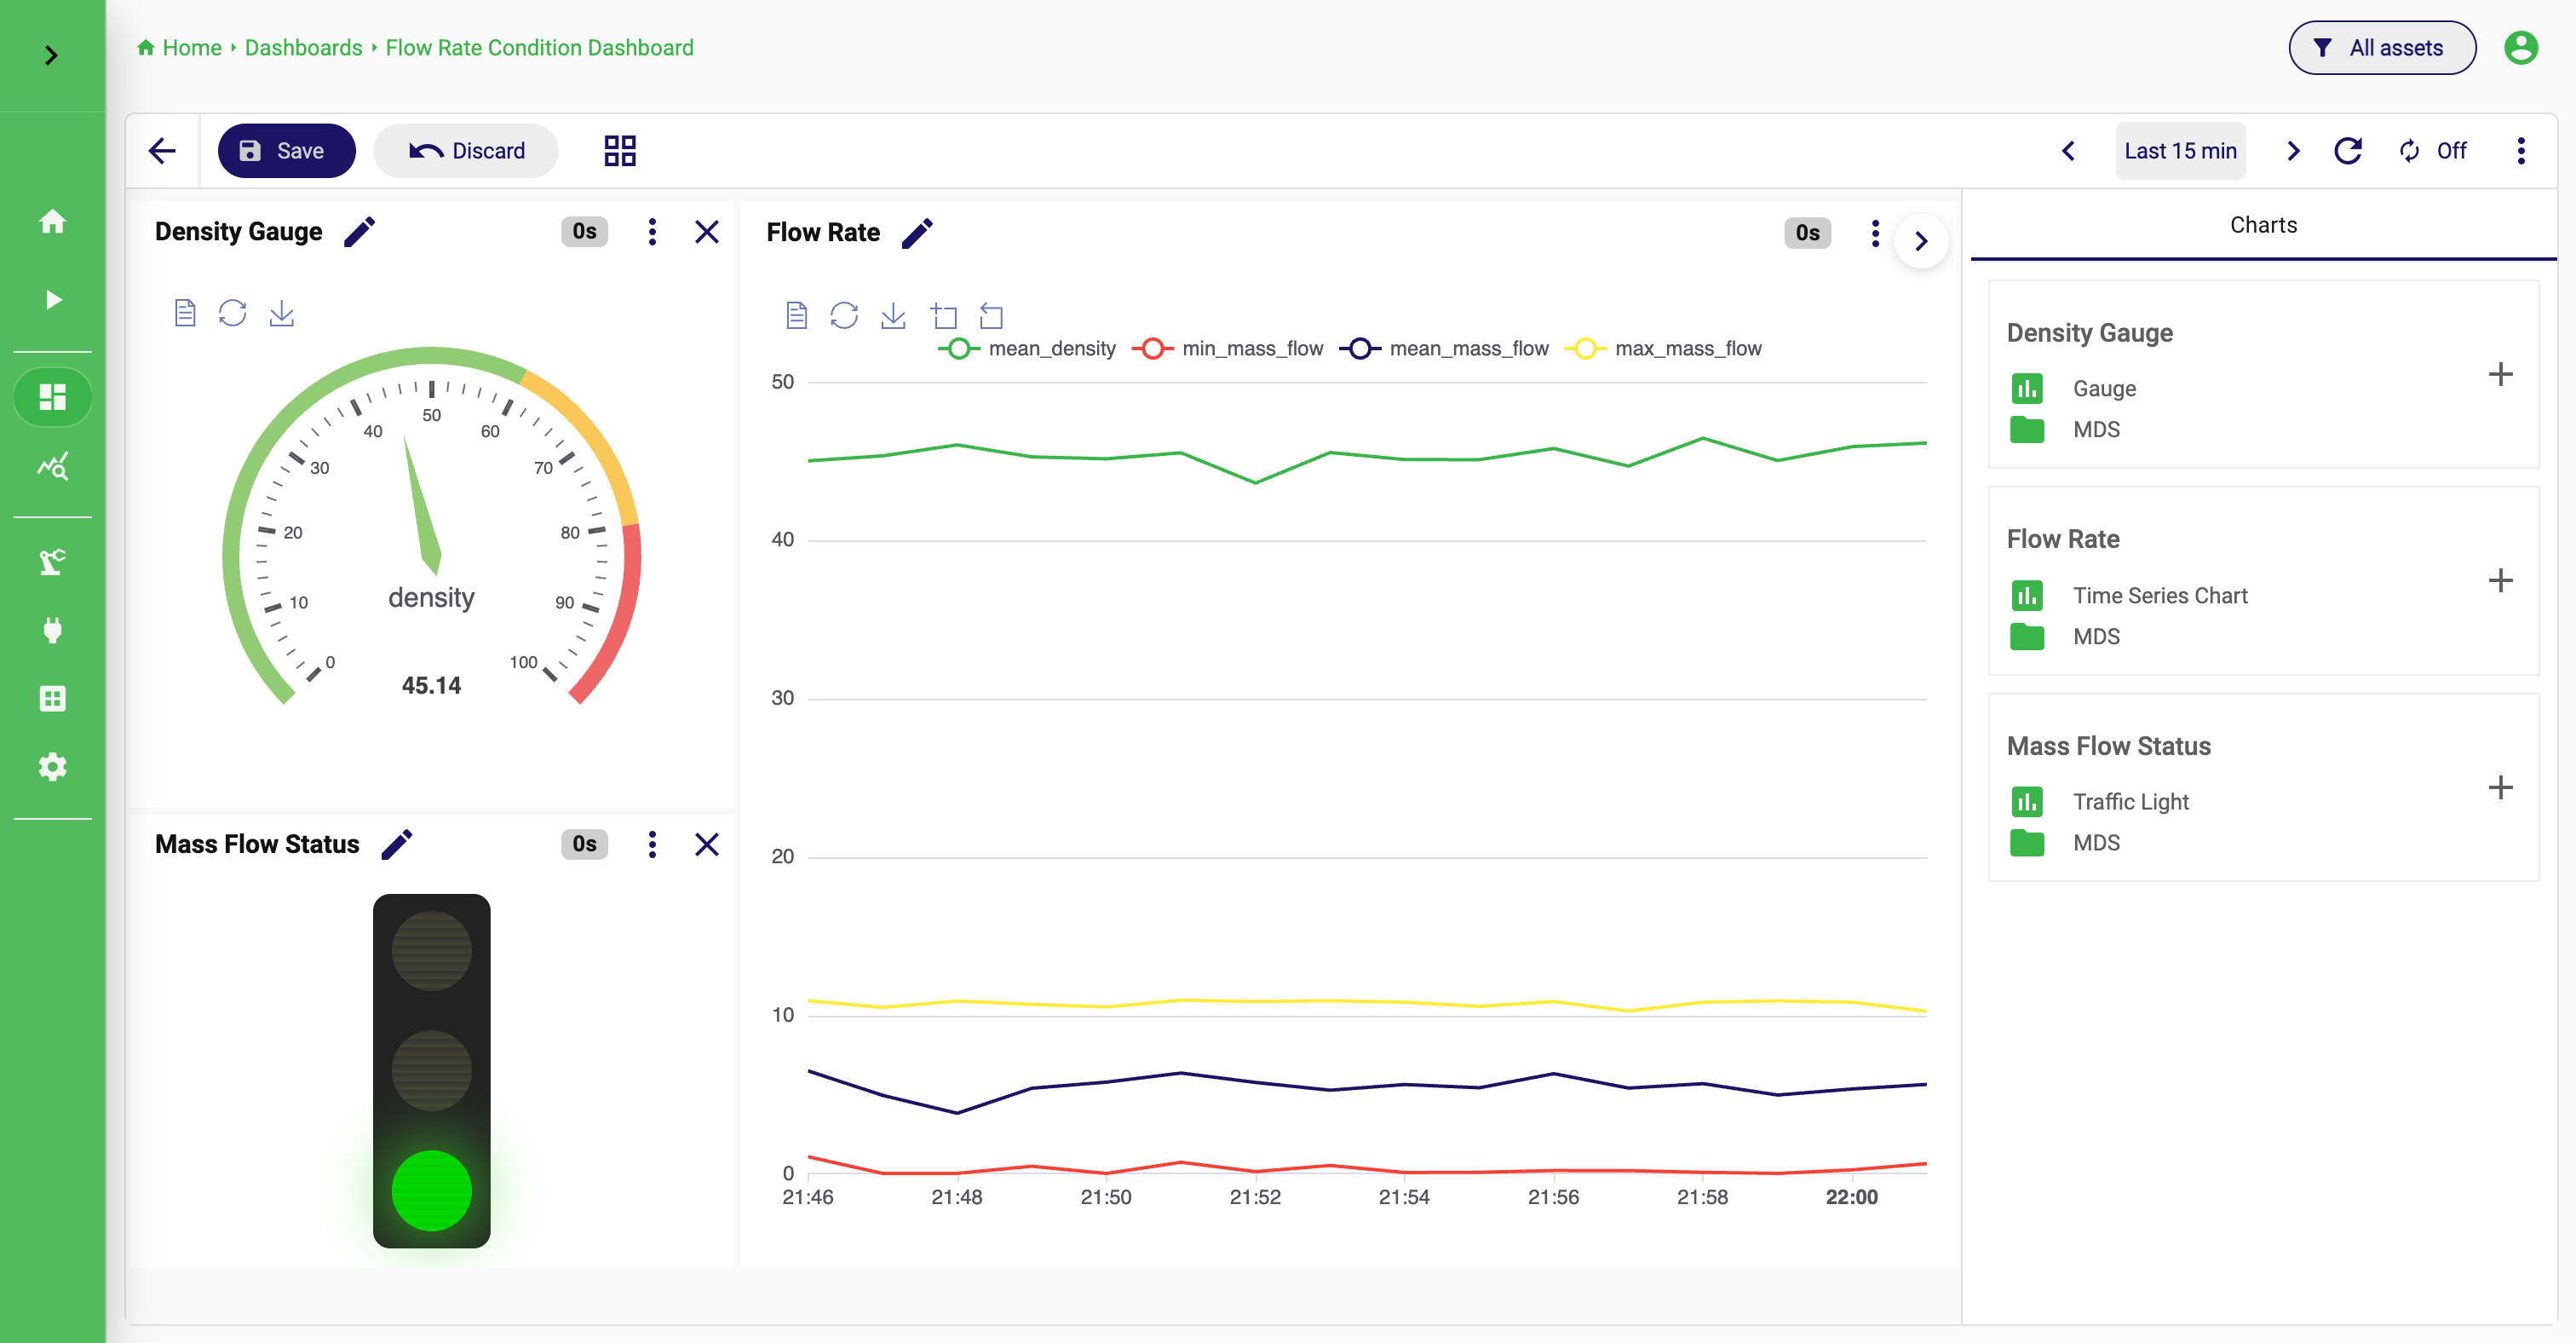
At this point, you have completed a full first-use flow: from data onboarding to a reusable dashboard view.
Optional next step: Build a pipeline
Once the quick start flow above works, the next logical step is to create a pipeline that transforms or enriches your live stream before persisting or visualizing it.
Open Pipelines when you want to:
- filter noisy data
- calculate KPIs
- combine processing steps
- send results to sinks
- create curated downstream datasets
For many users, pipelines make more sense after the basic source-to-visualization flow is already working.
If something is missing
If you cannot complete one of the steps, the most common reasons are:
- the required adapter or sink is not installed
- the adapter is not running
Persist eventswas not enabled- the dataset is empty, so the chart query has nothing to show
Check these in order. Most first-run issues are resolved by going one step upstream.
Where to go next
After this quick start, continue with the feature guides for the areas you used:
If you want a better mental model before going deeper, read the concepts pages next: