Made for the Industrial IoT
A single user interface for everything.
01.
IIoT Connectivity
Integrate data streams using the built-in StreamPipes Connect library with support many industrial protoocls such as S7, MQTT, Modbus, OPC UA, OPC UA Events, WinCC Alarm Archive and many other IT protocols such as Apache Kafka and Apache Pulsar.
Some included adapters and integrations:
OPC UA,Apache Kafka,MQTT,Apache PLC4X (e.g., S7, Modbus),Robot Operating System (ROS), and many more.
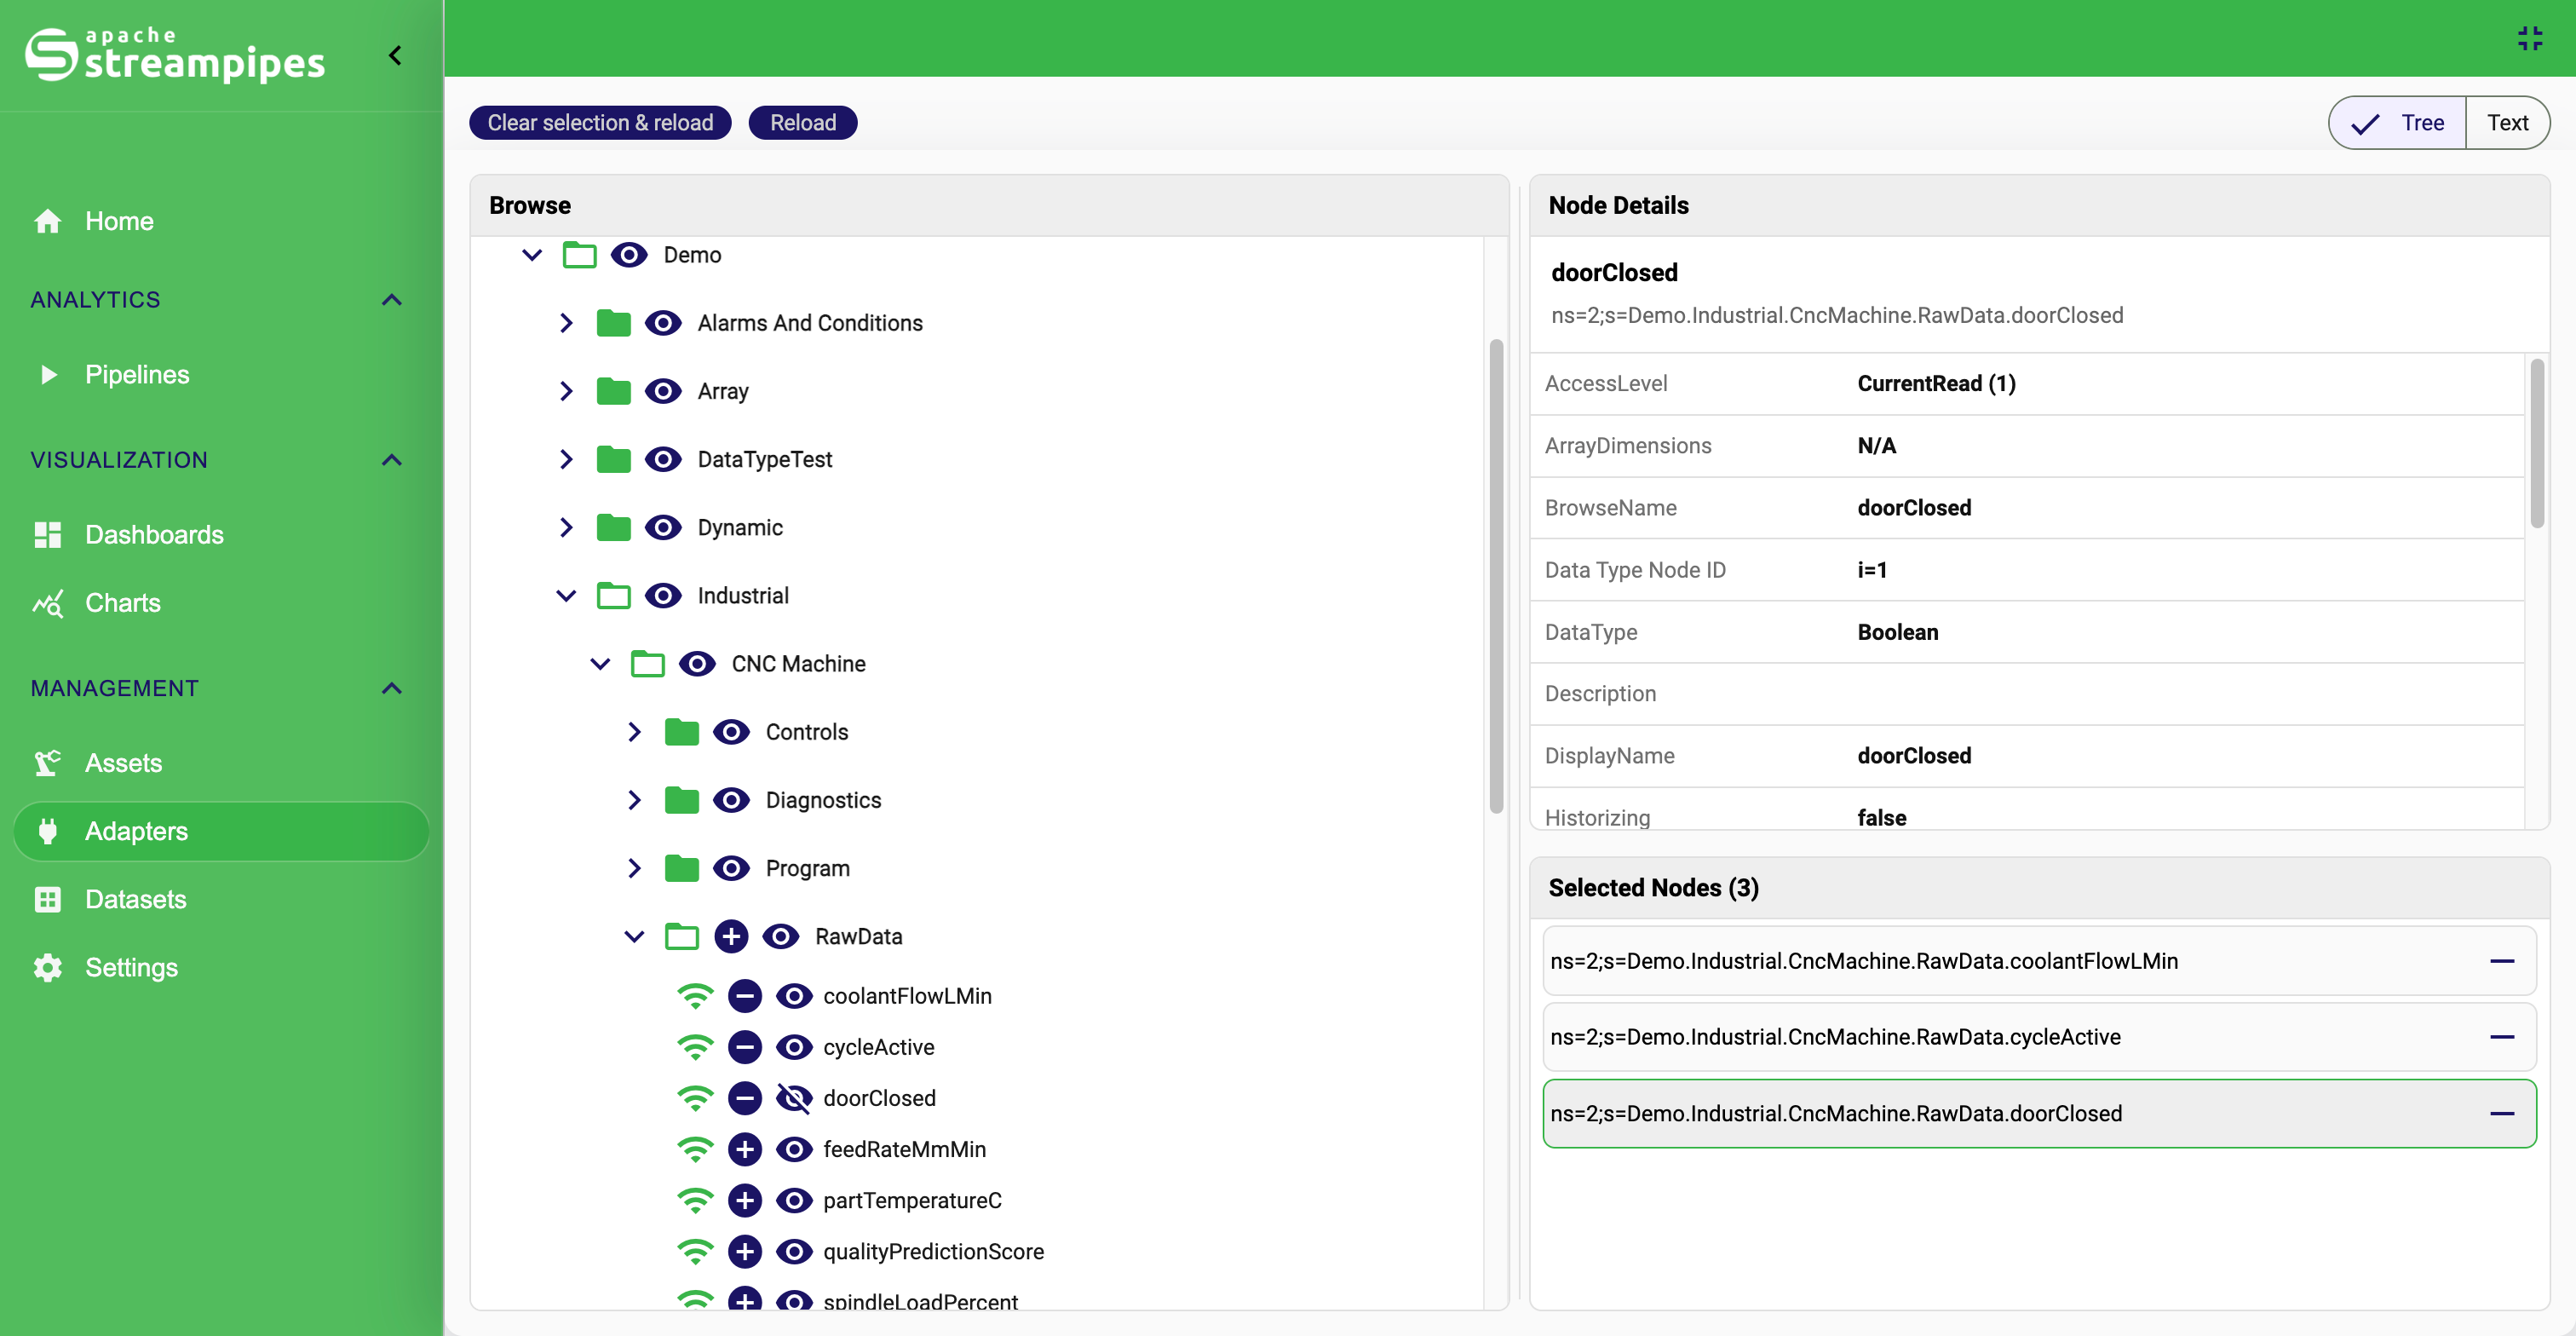
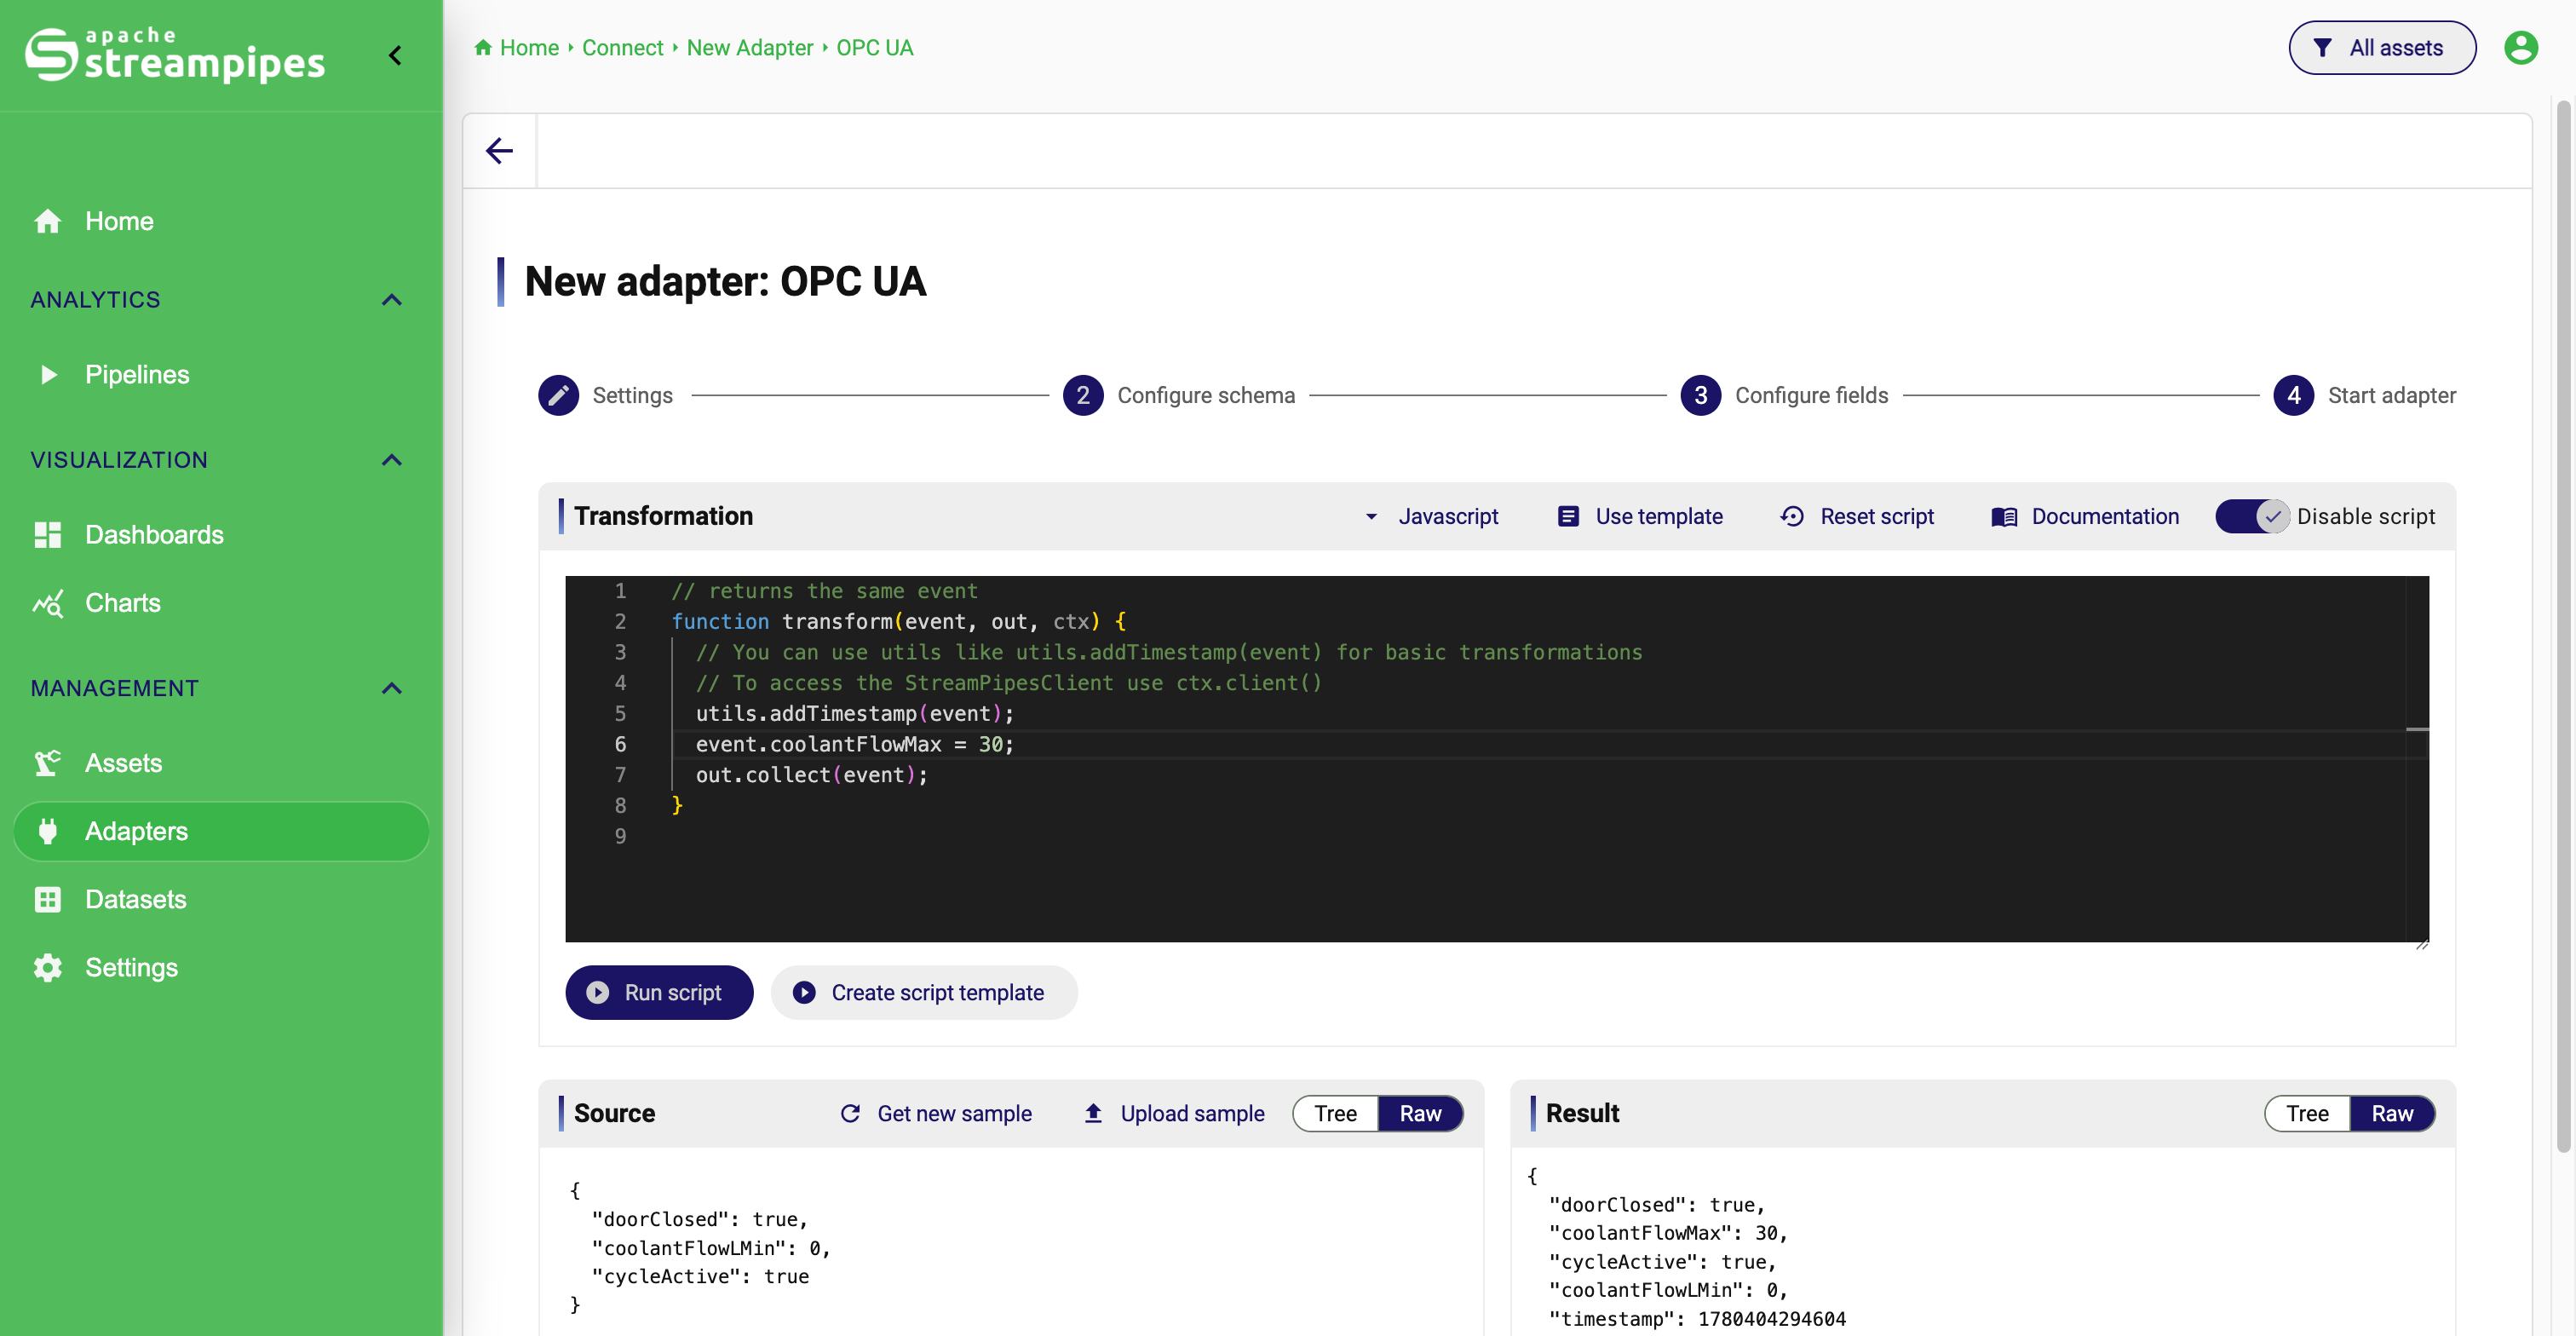
Adapters can be easily configured right from the user interface - with an intuitive configuration menu.
Pre-processing rules can be added to harmonize data before ingestion, e.g., transformation of measurement units.
Learn more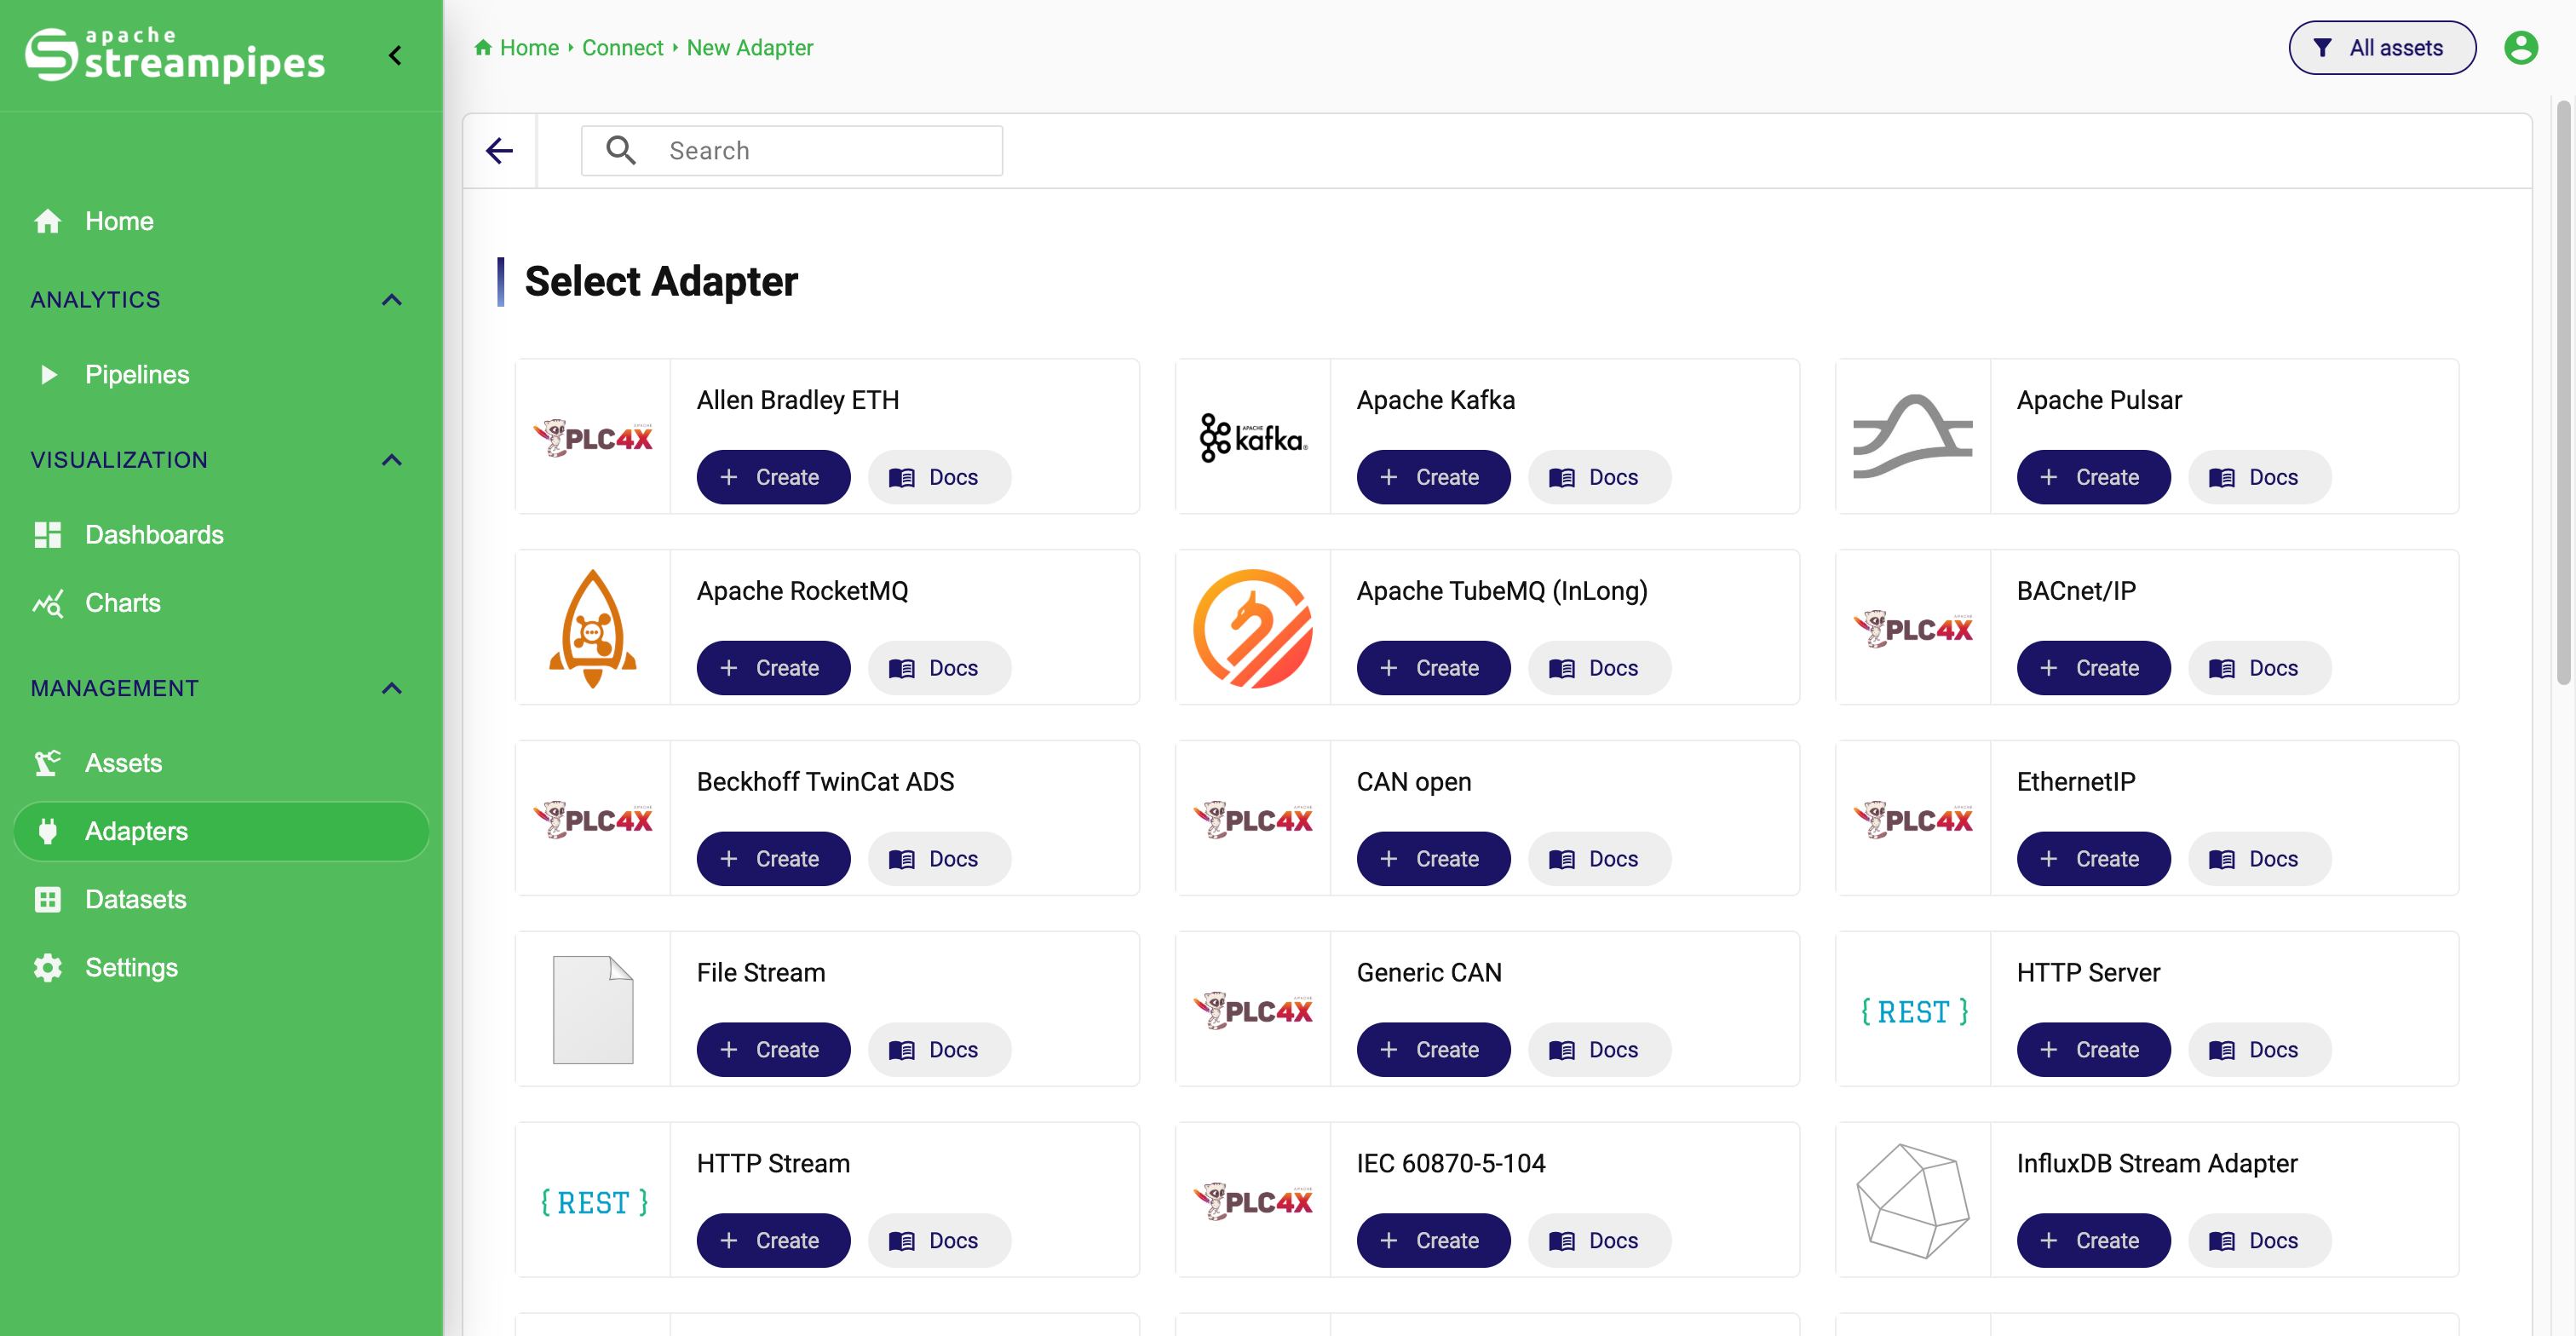
02.
Analyze
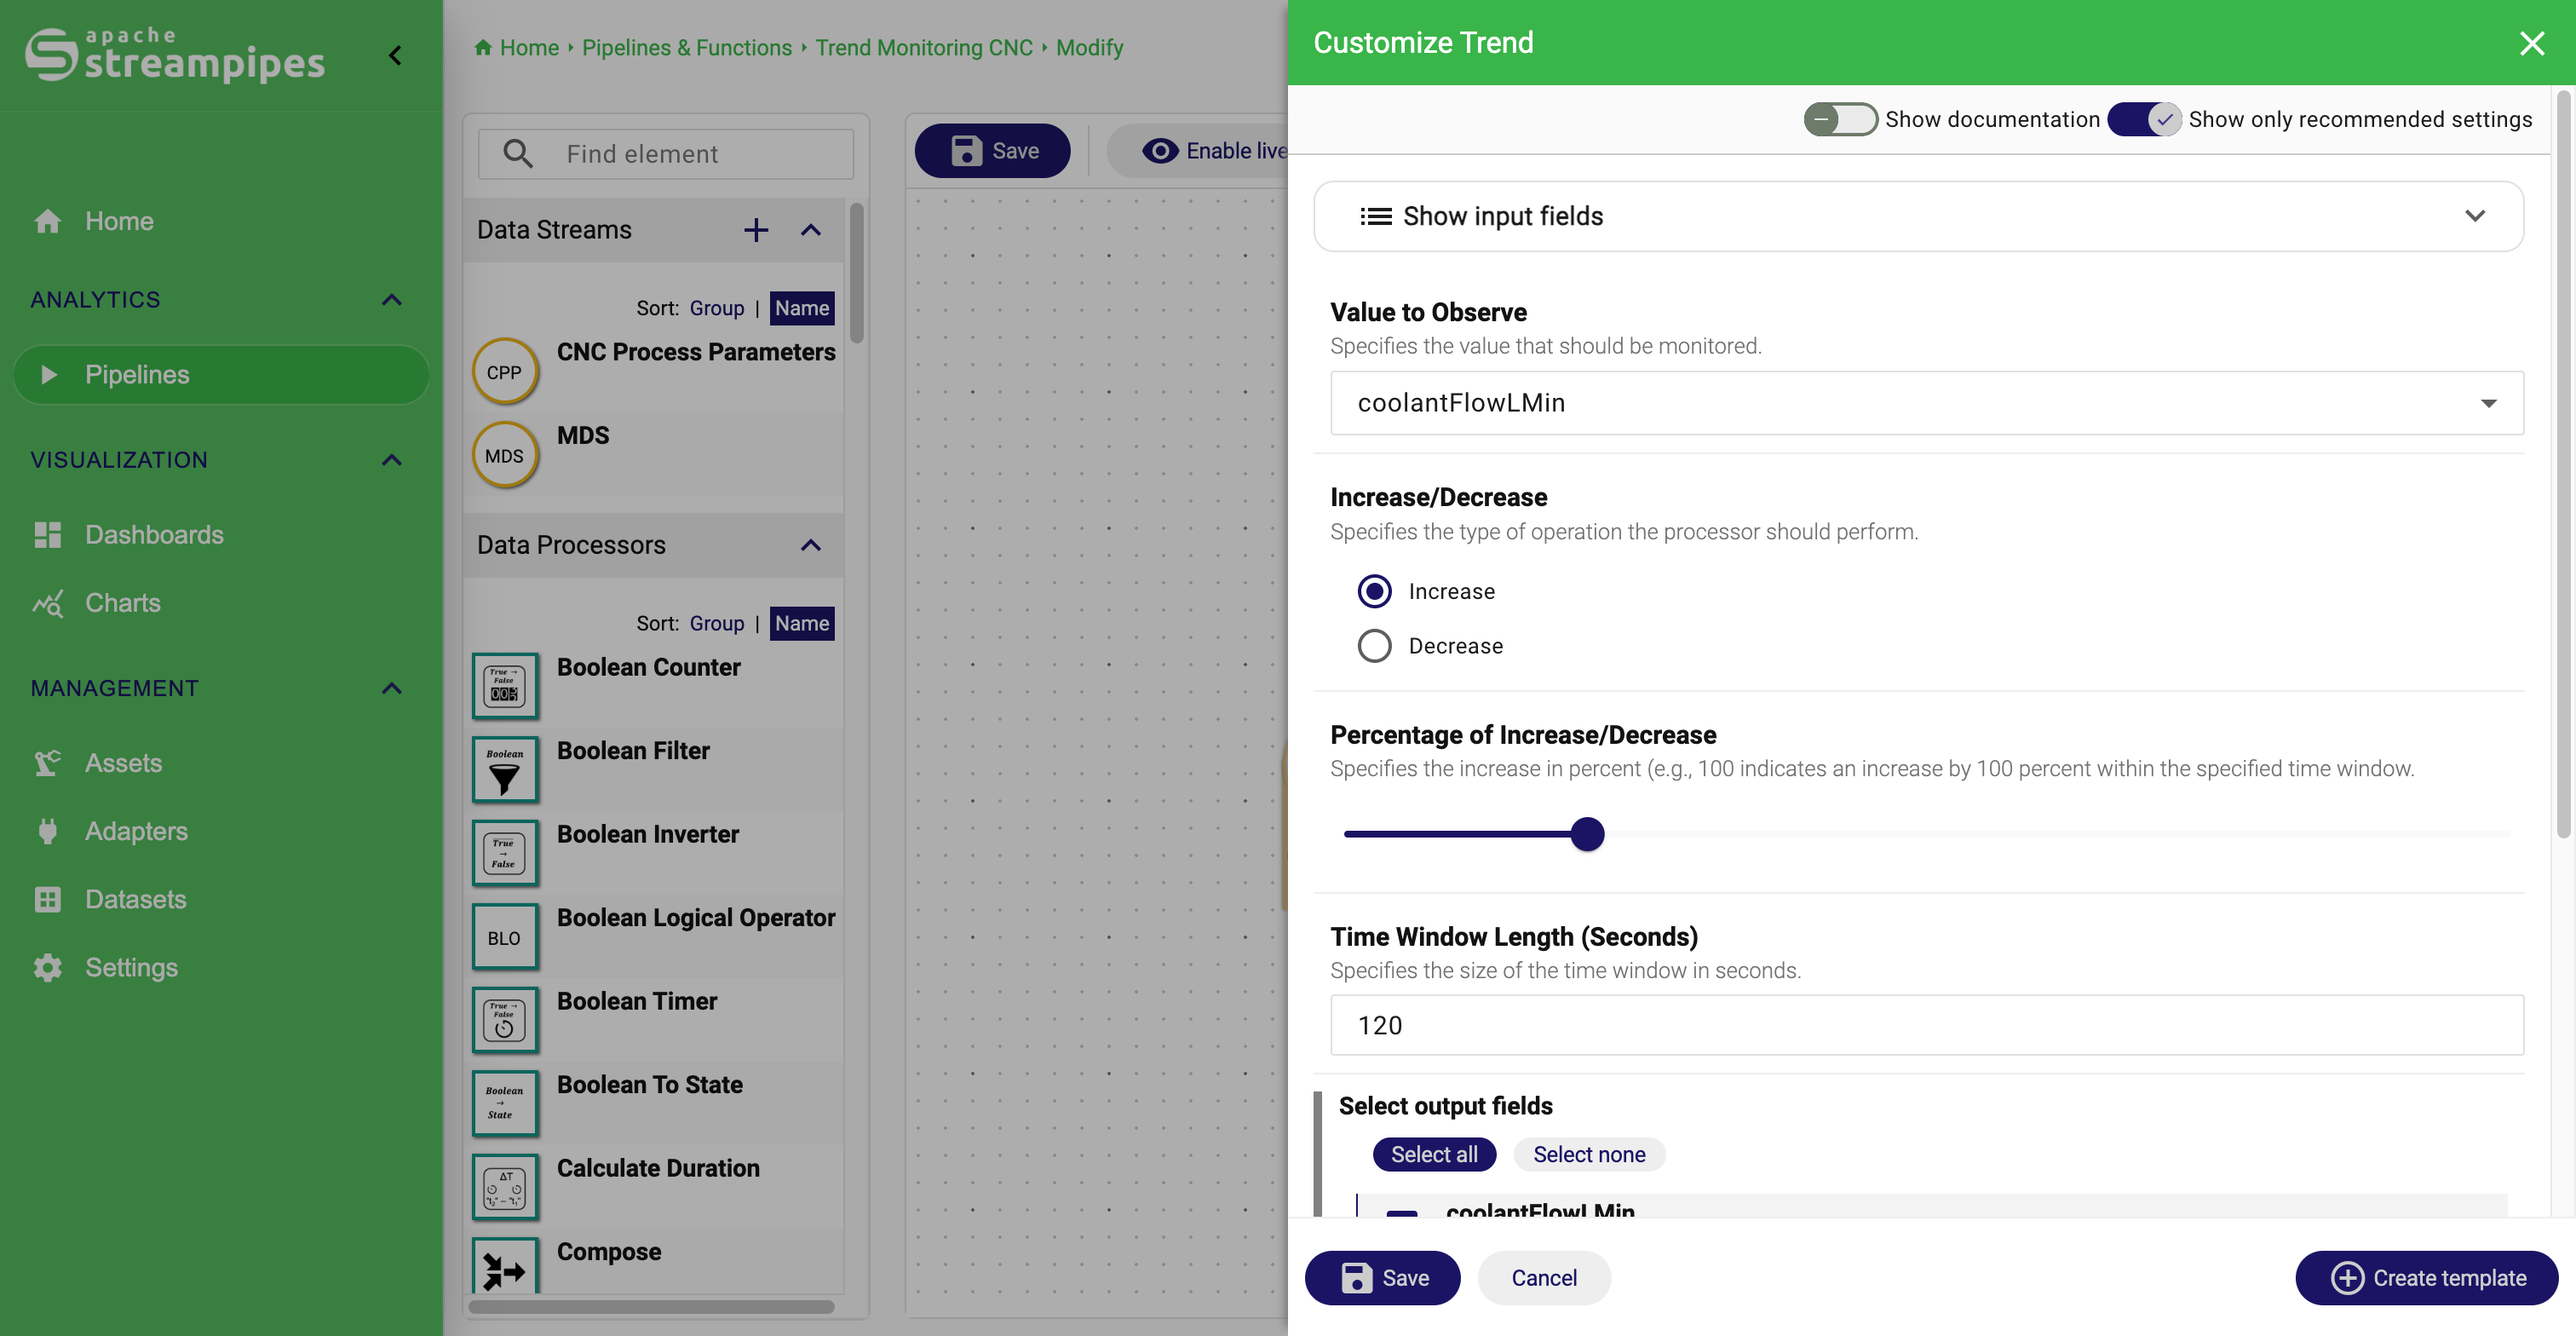
Harmonize and analyze data by using the real-time algorithm toolbox ranging from simple filters up to pre-trained neural networks - or build your own algorithm with the provided SDK.
Some included data processors:
Trend Detection, Peak Detection, Numerical Filter, Sequence, Boilerplate Removal, Event Rate, Field Converter, Frequency Calculation, Generic image Classification, Measurement Unit Converter, Projection, Timestamp Enricher, Trigonometry Functions and many more.
Our pipeline elements focus on analyzing industrial IoT data - for instance, we provide many operators to transform process data from PLC systems.
Learn more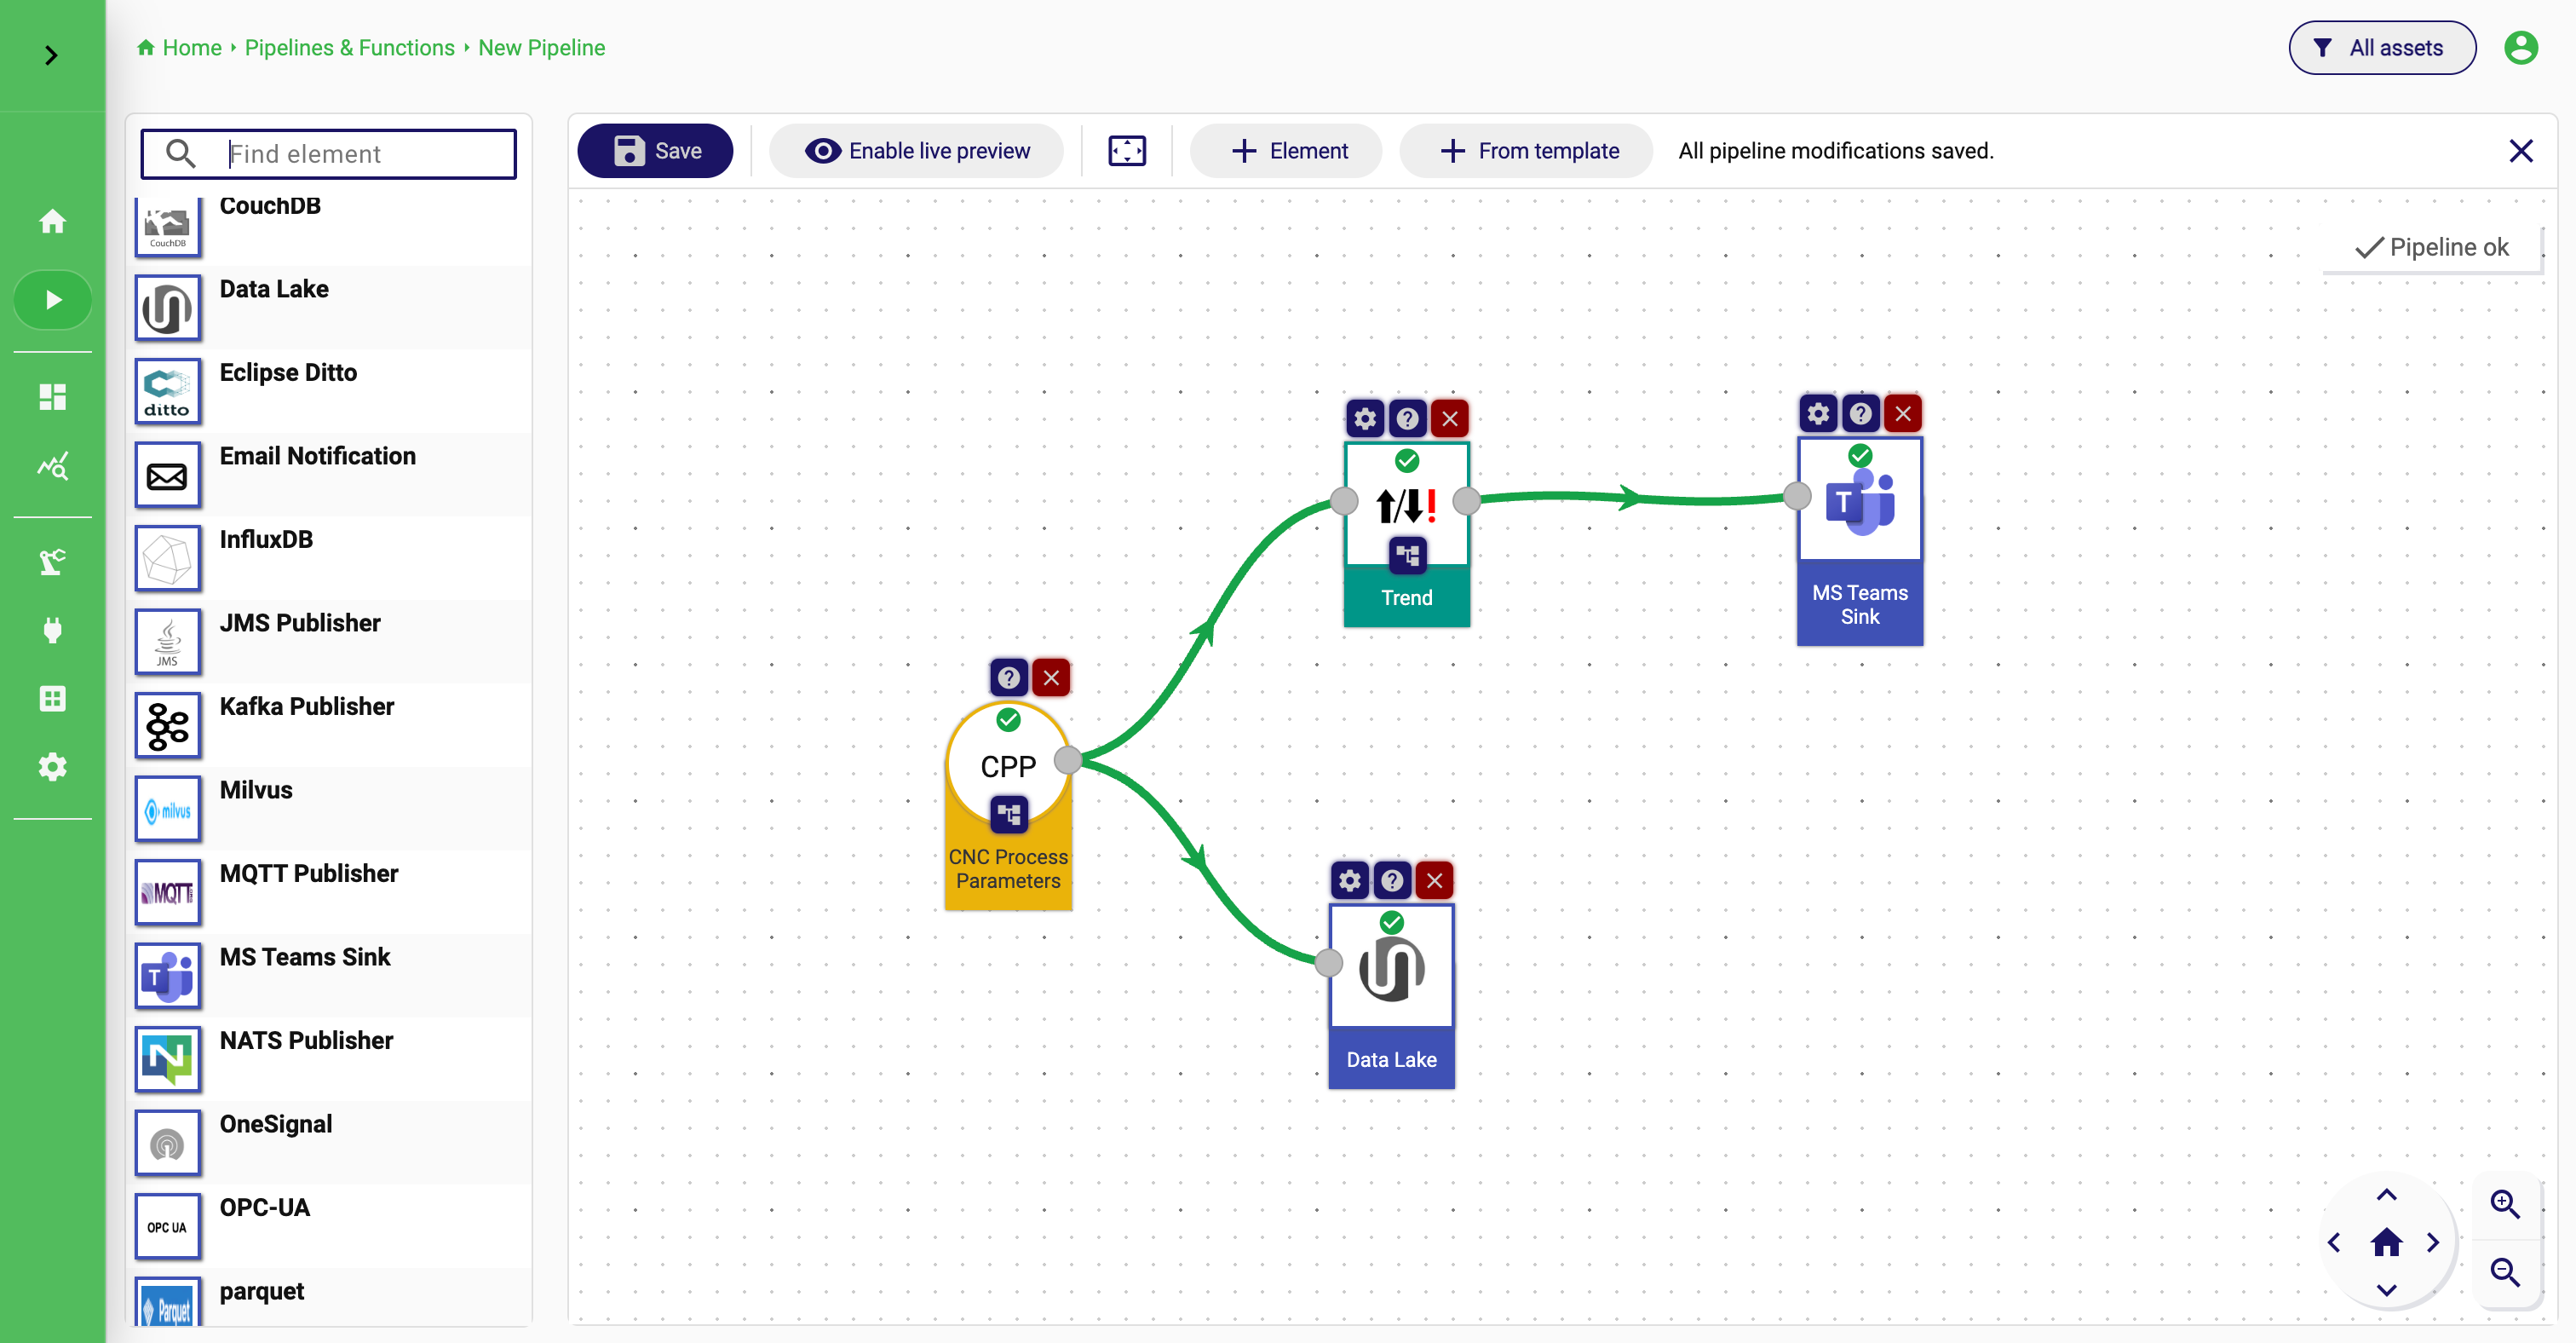
03.
Exploit
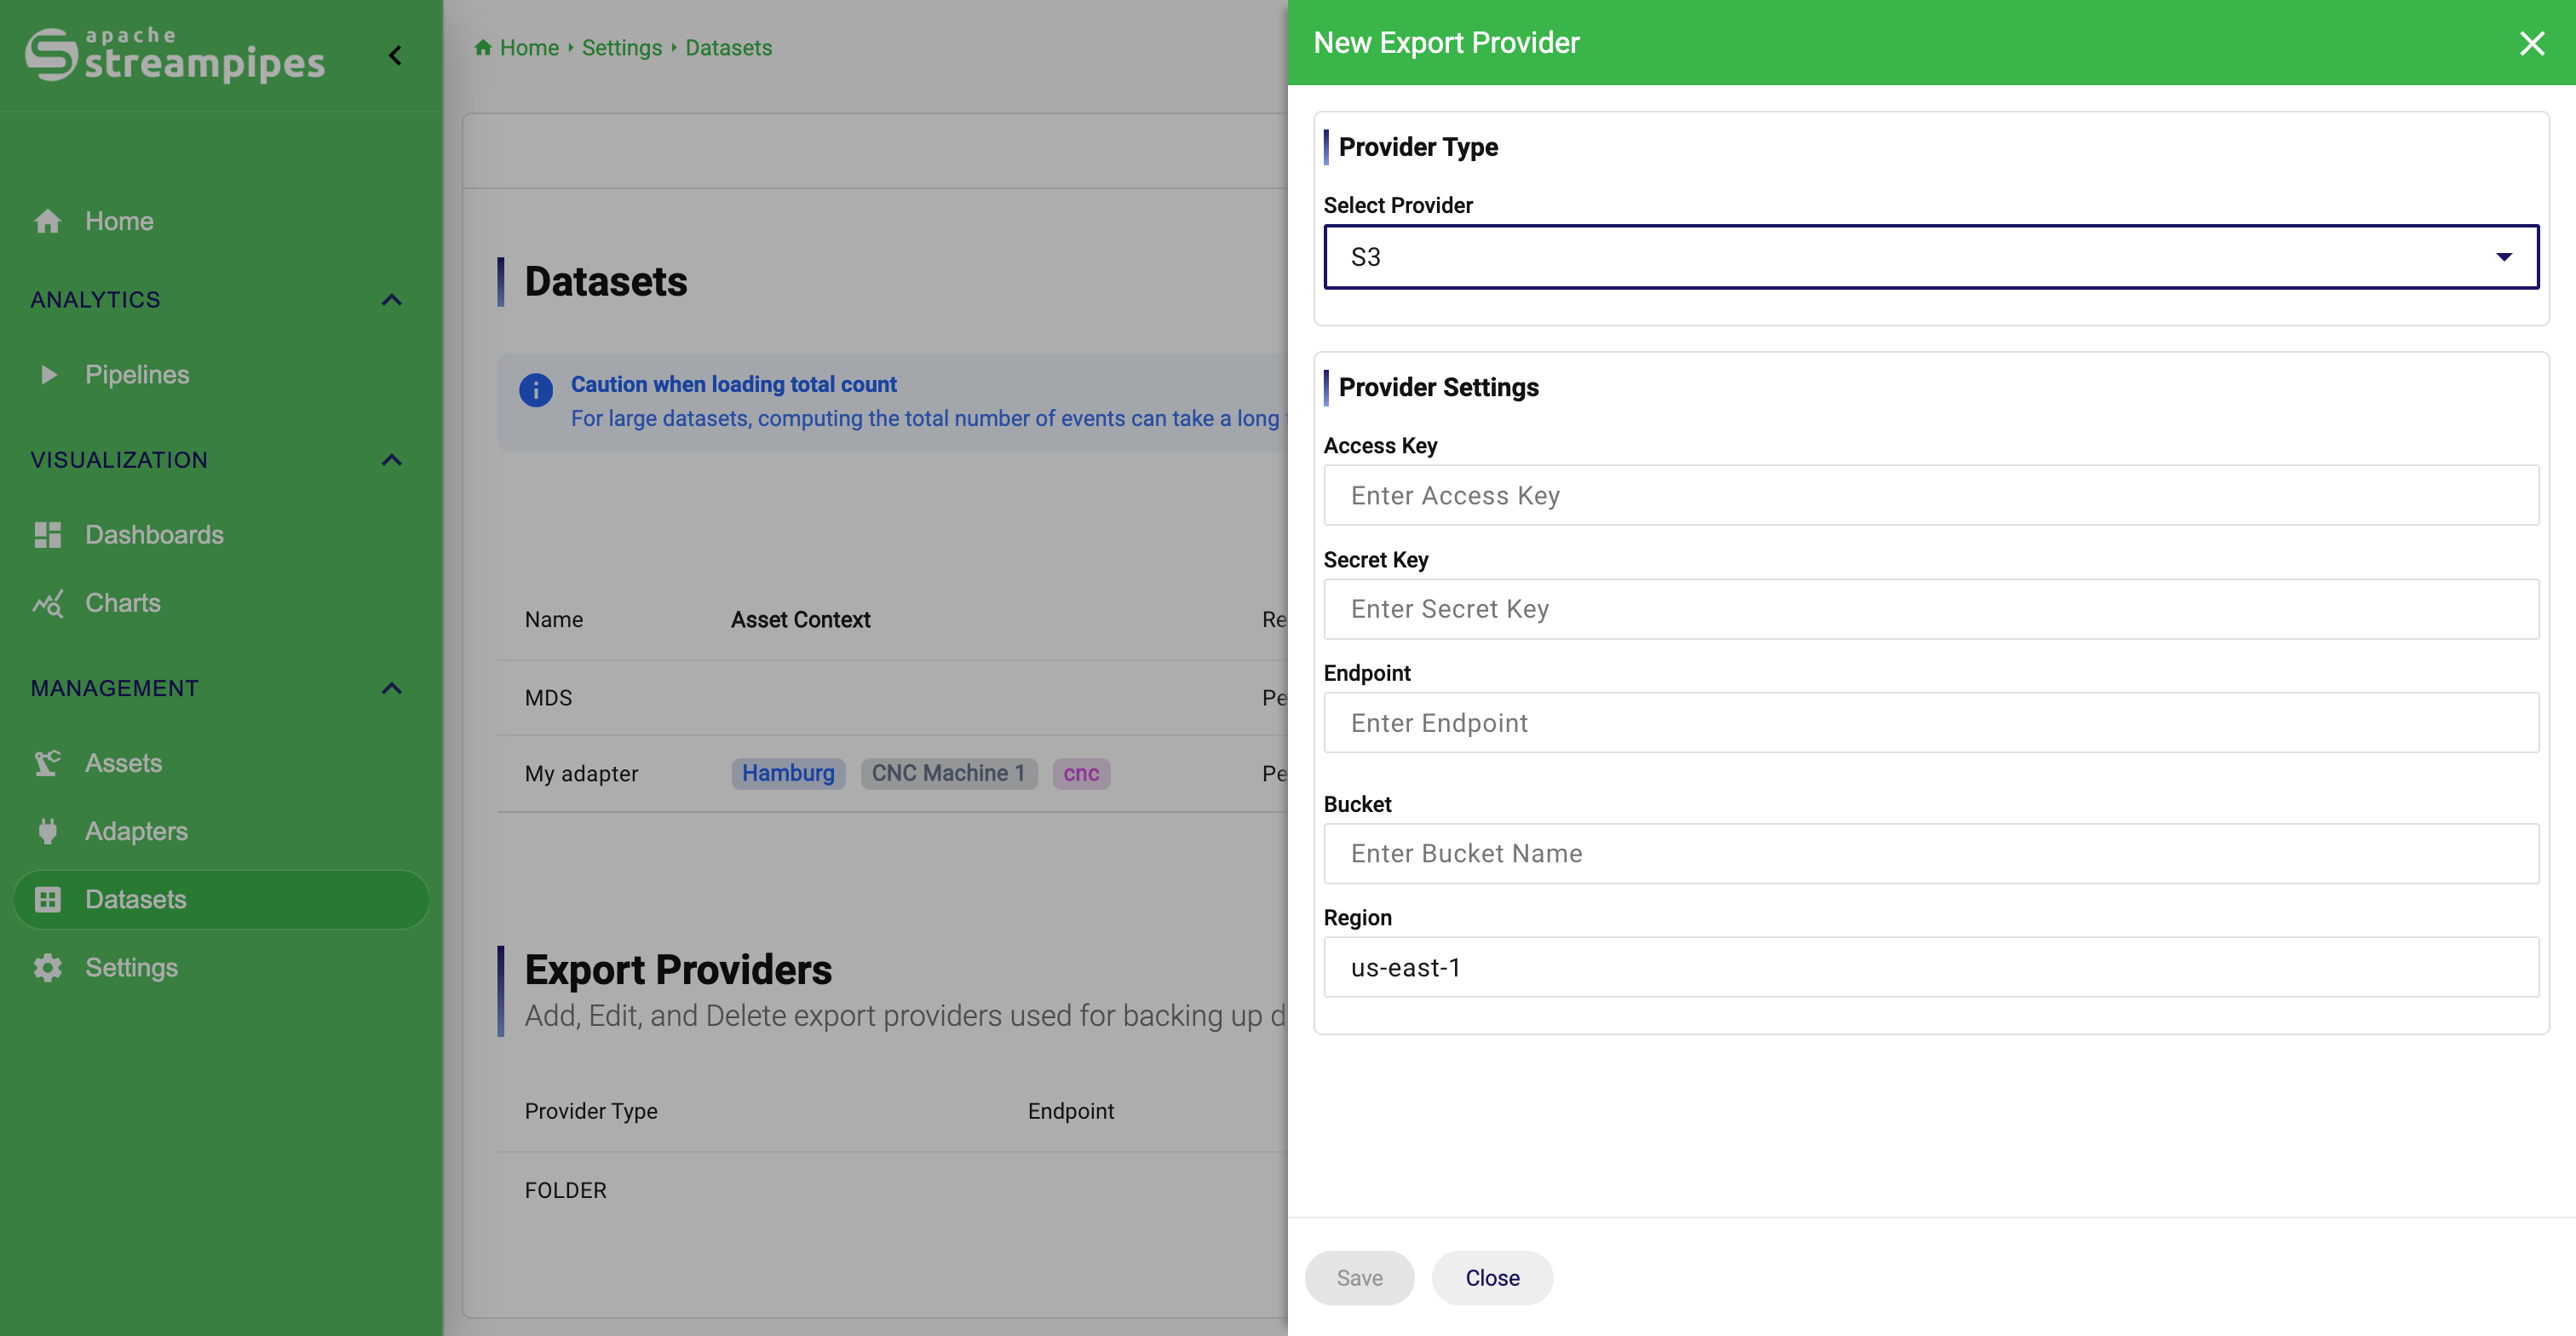
Trigger notifications, configure your real-time dashboard or send data to third-party systems such as databases (e.g., Kafka or Elasticsearch), external services (e.g., Slack) or IoT actuators.
Some included data sinks:
Apache Kafka,Apache Pulsar,Apache CouchDB,Apache IoTDB, OPC-UA, RabbitMQ, Email, Slack, Internal Notification, PostgreSQL and more.
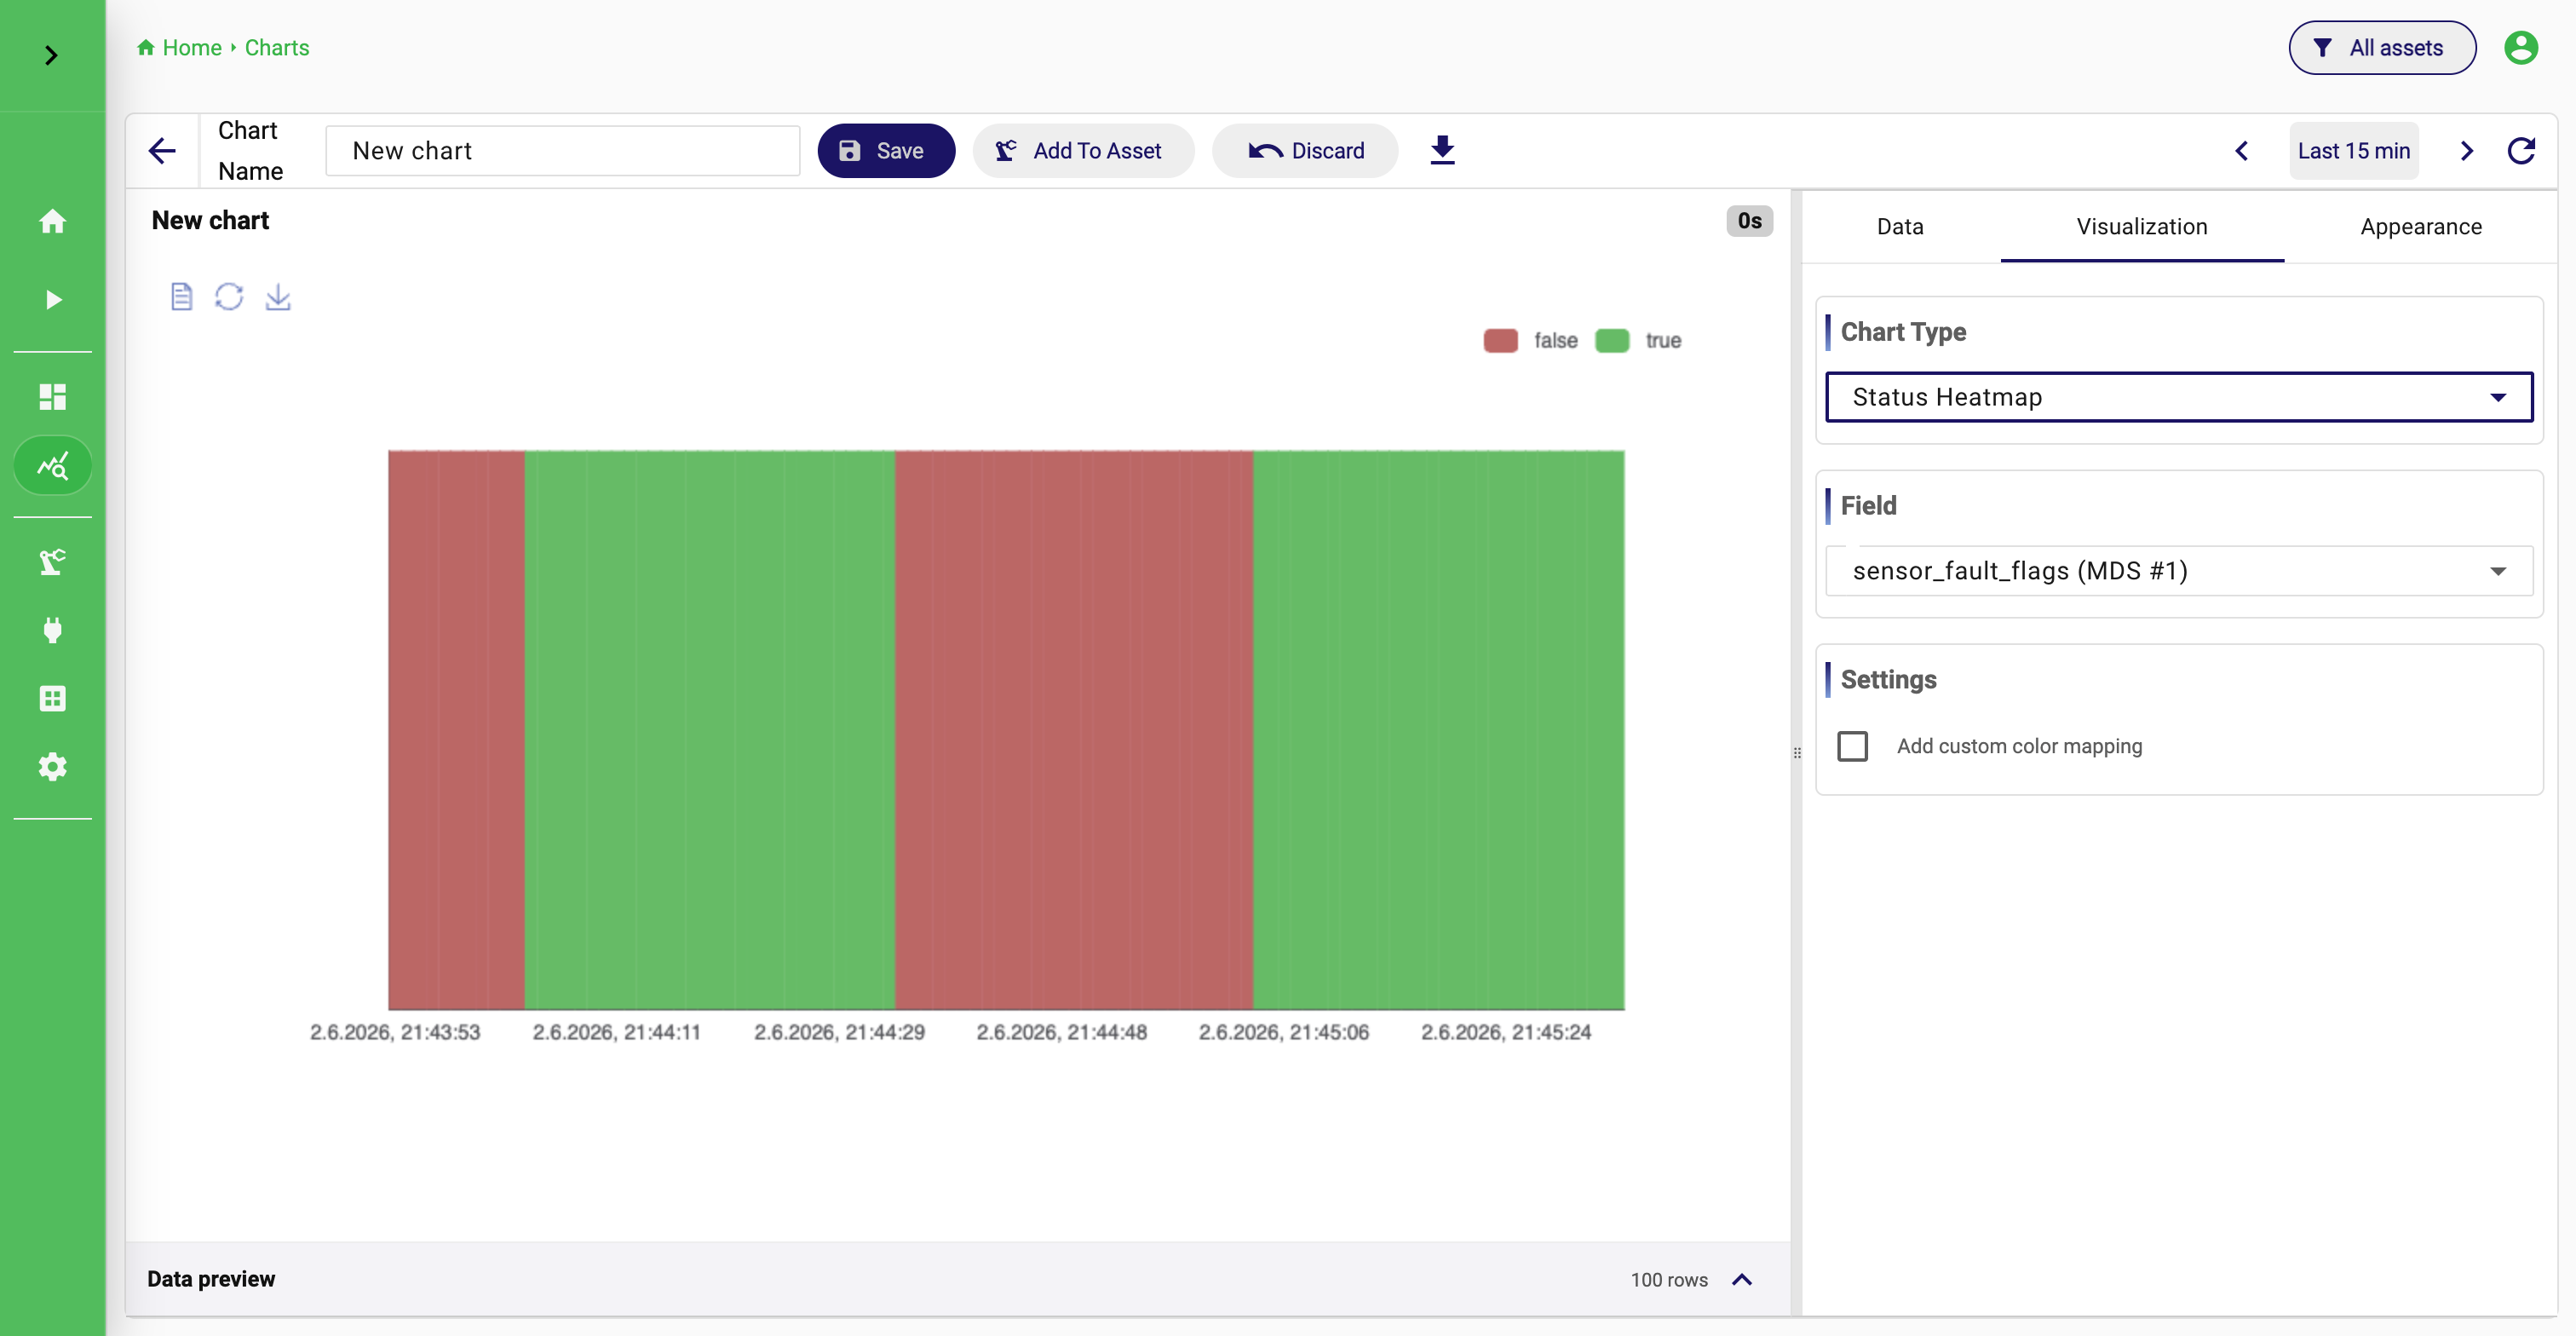
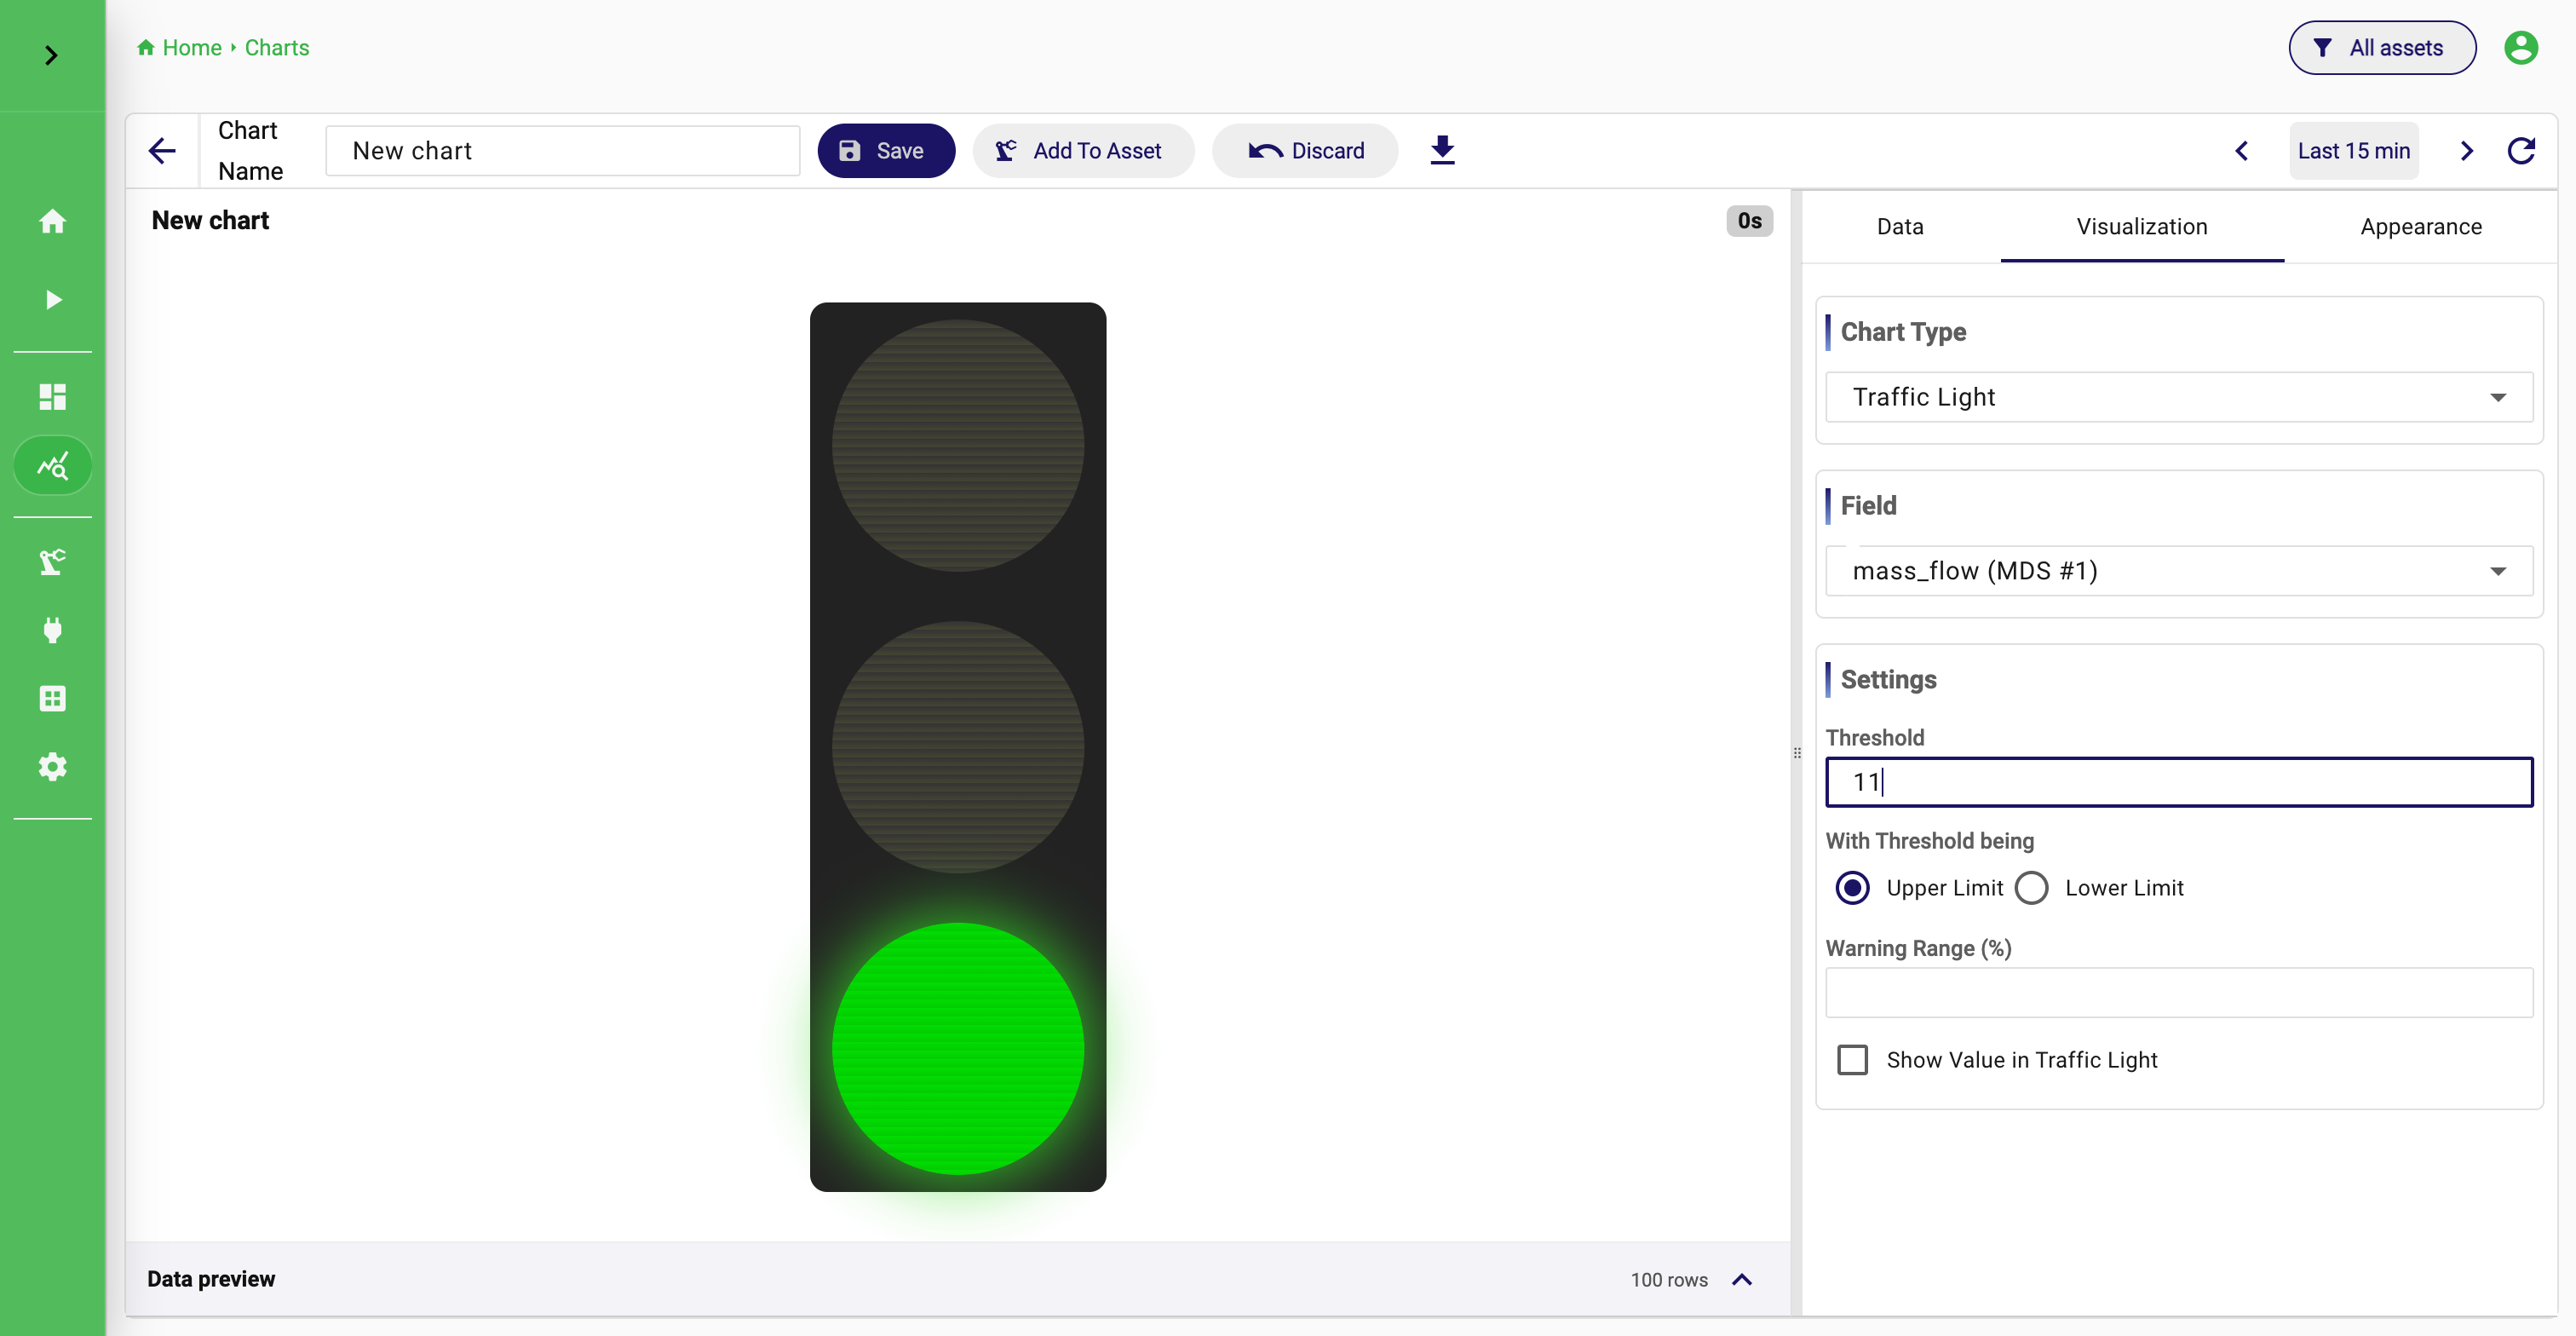
The chart library gives you an intuitive and feature-rich component to visually analyze persisted time-series data and comes with ready-to-use visualizations such as heatmaps, value distribution charts or time-series charts.
Use the live dashboard to visualize data in real-time, e.g., show critical values directly on the shopfloor.
Charts Dashboards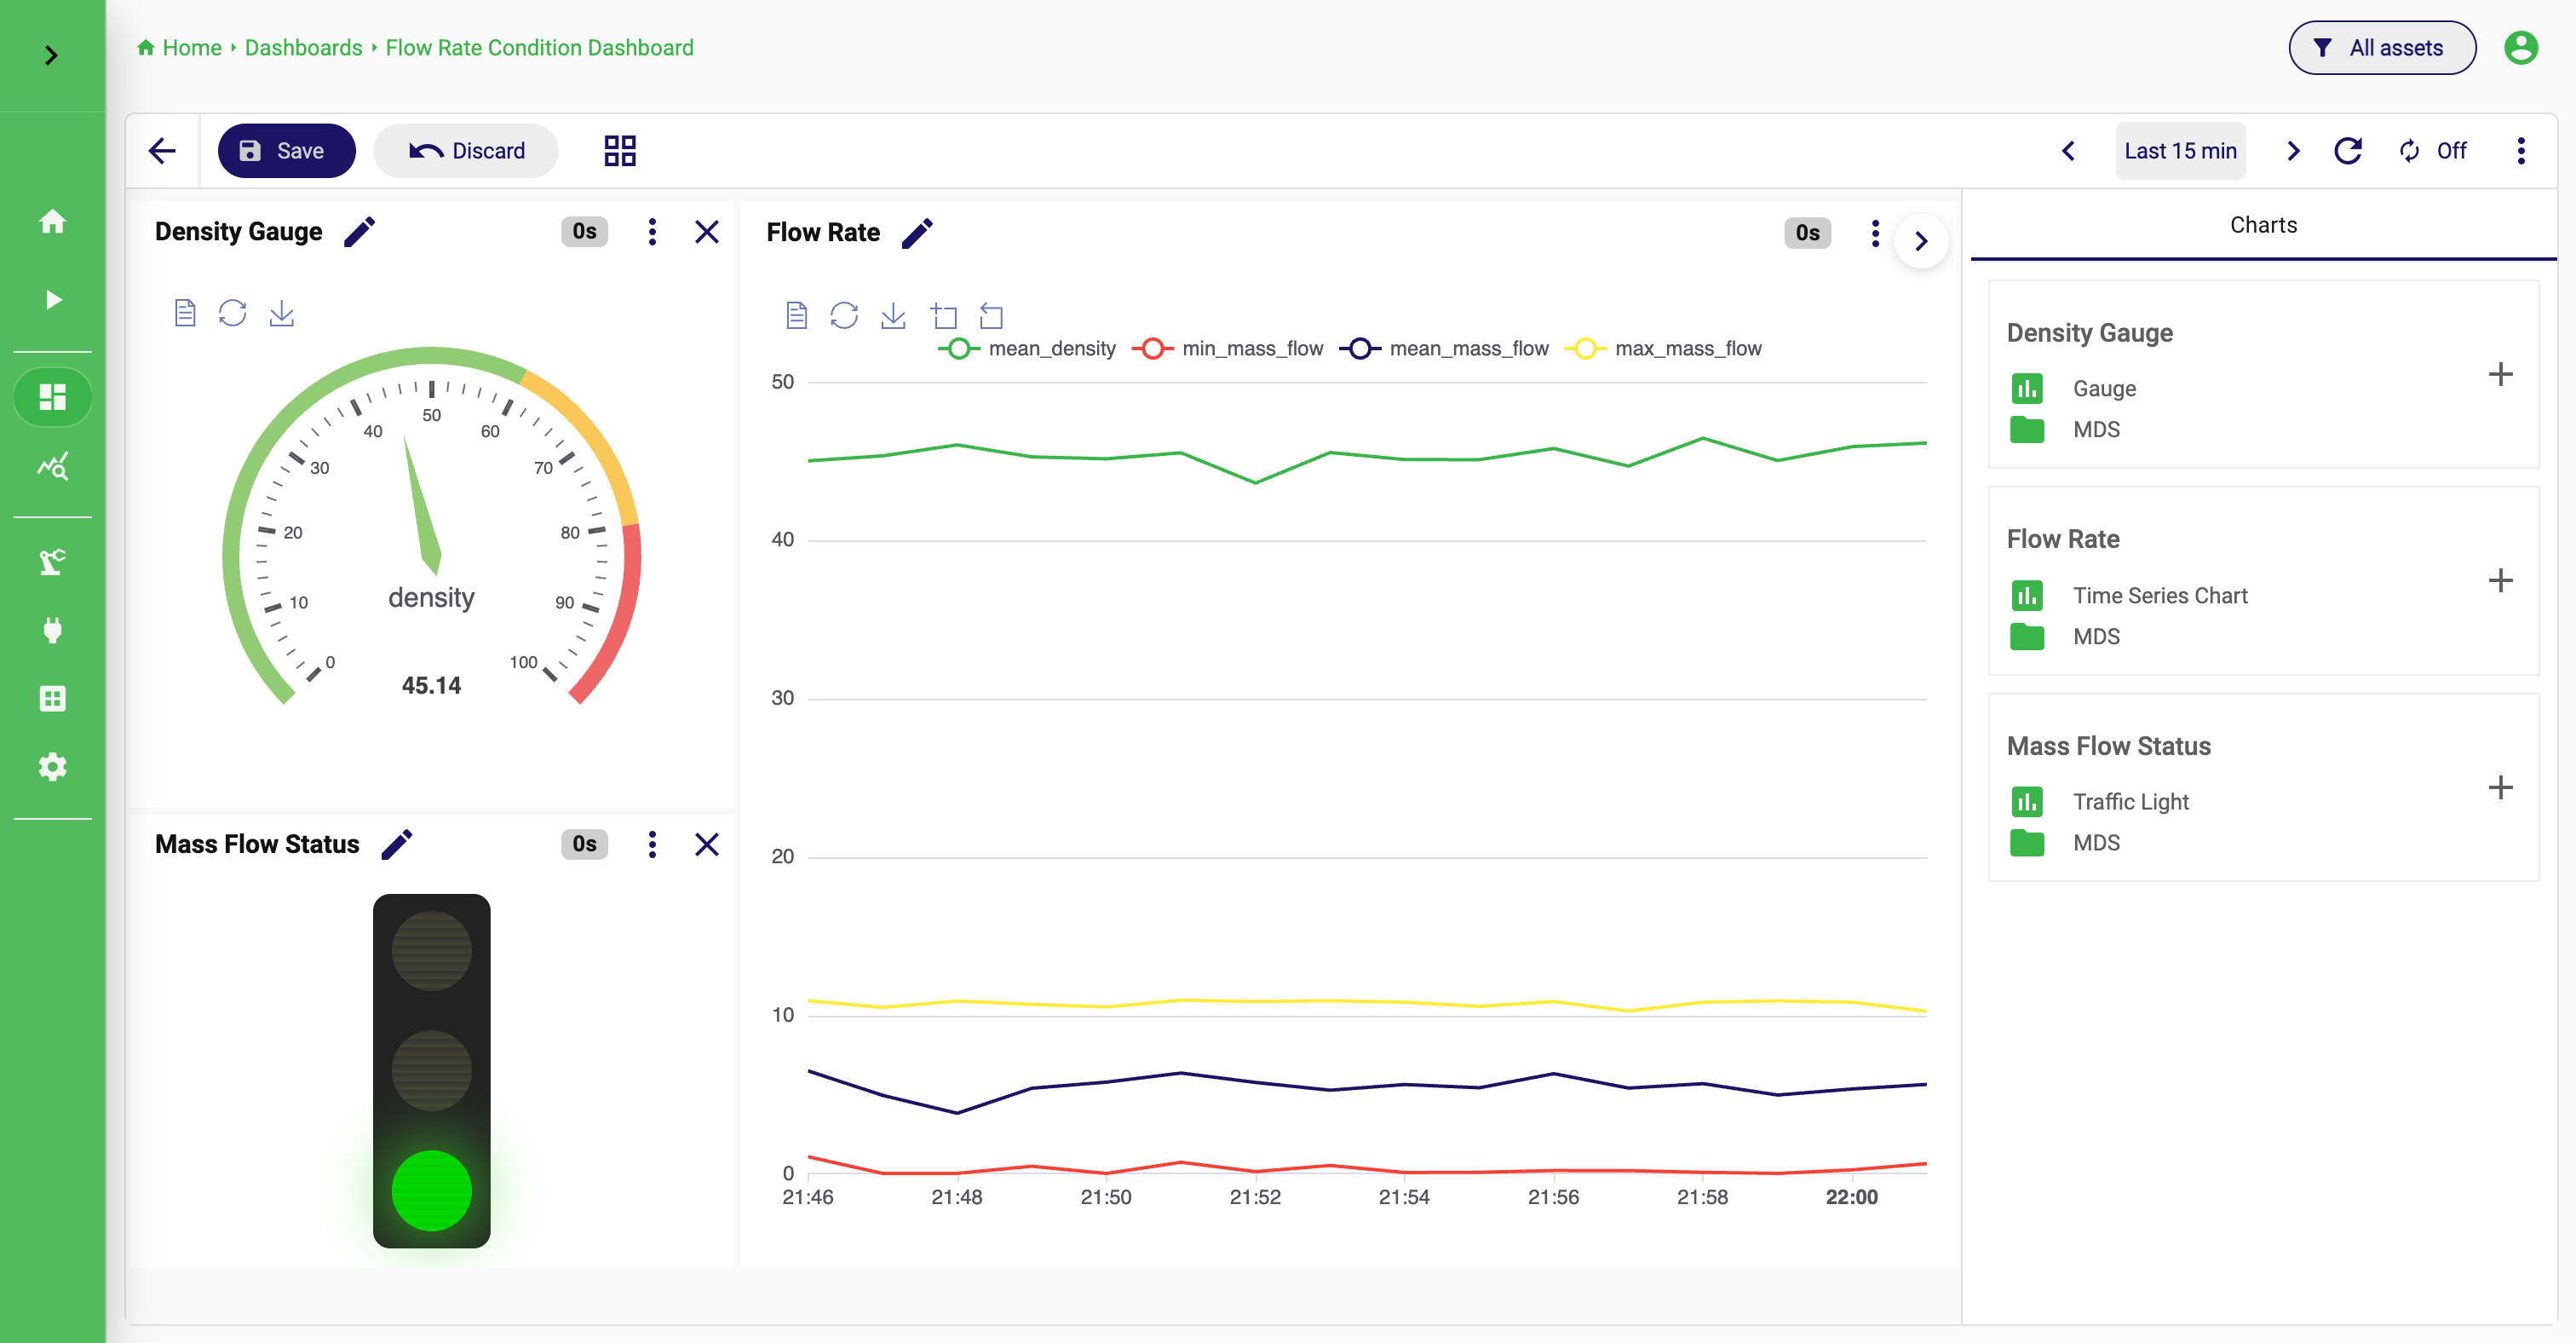
04.
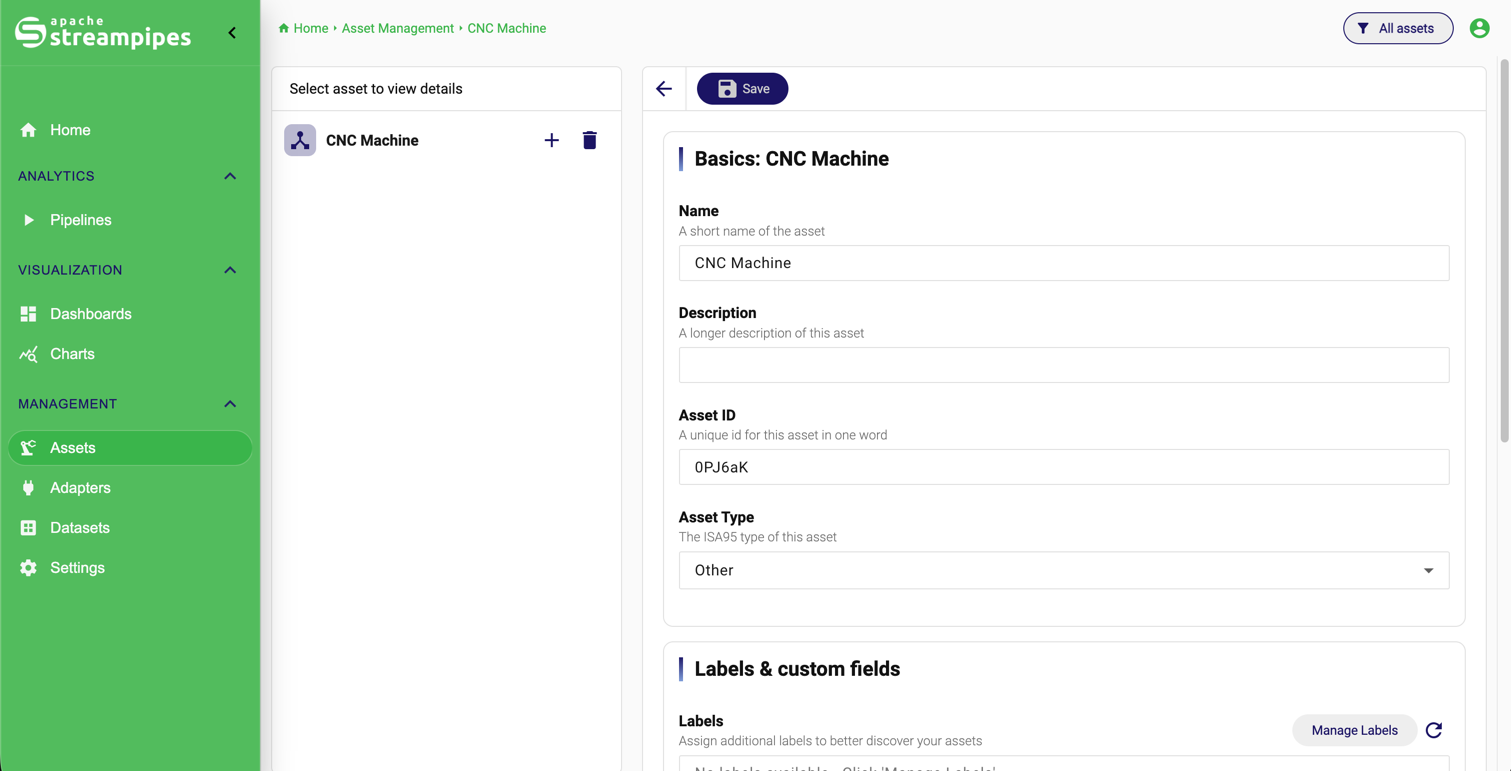
Manage
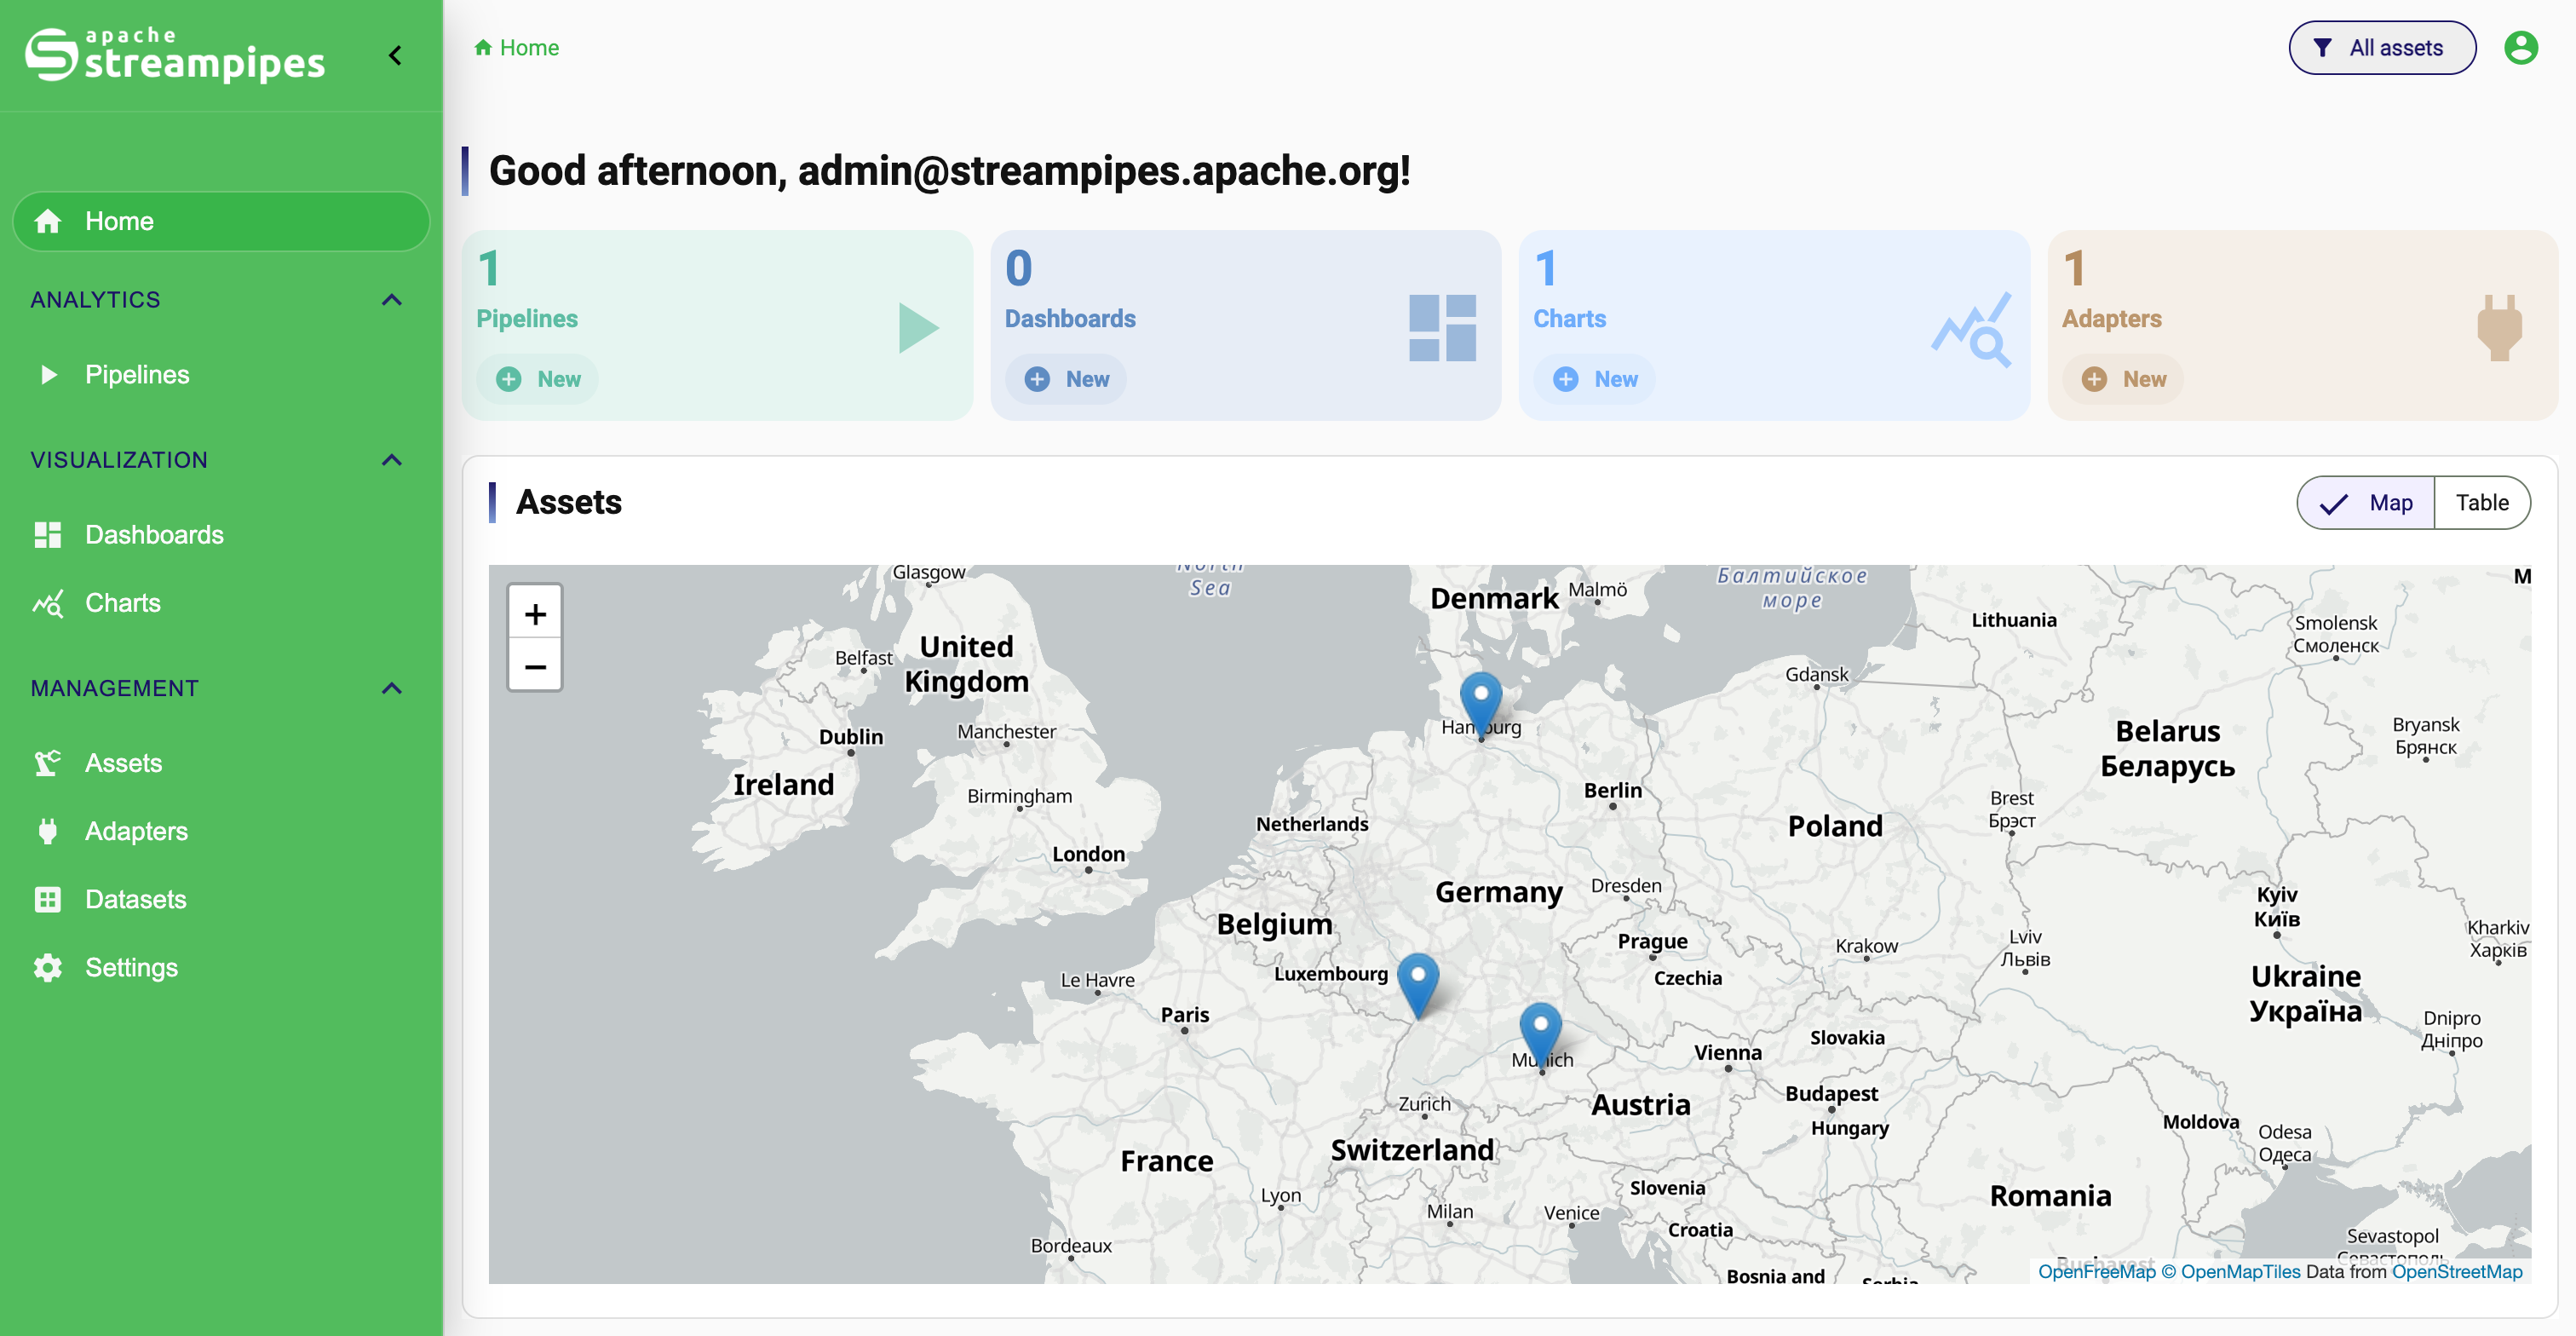
Manage assets, sites, locations and assign resources to physical assets. Organize your unified namespace.
As an integrated data platform you can manage assets, sites, users, permissions and much more. Developer interfaces ensure that StreamPipes integrates with your existing infrastructure.
Assets
Deploy StreamPipes where it fits your architecture
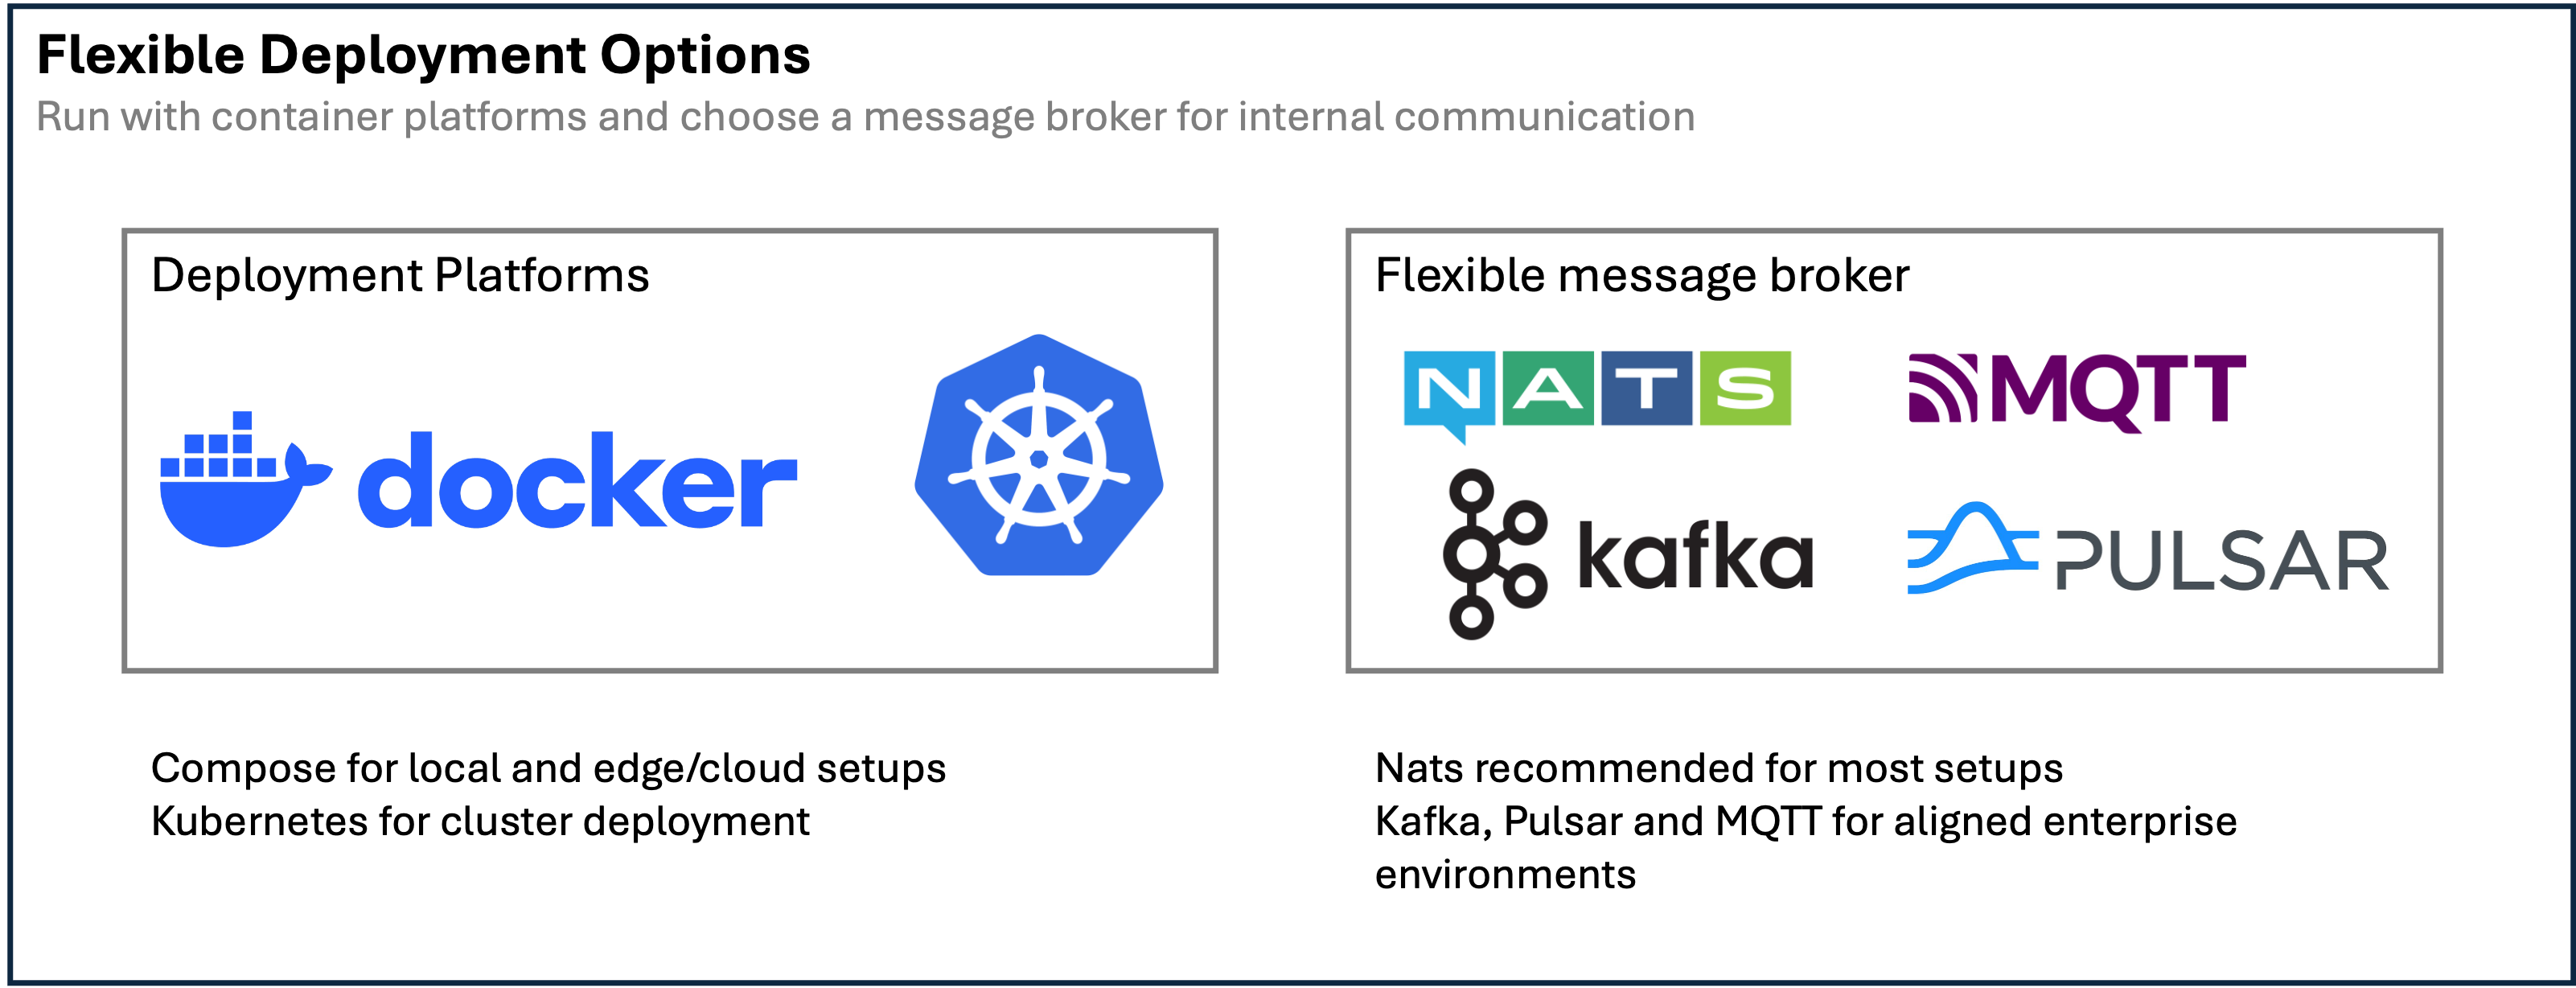
Flexible deployment concepts
Apache StreamPipes is not tied to one installation model. Start with a simple Docker Compose setup for evaluation, local environments, and smaller installations, or move to Kubernetes when you need cluster-level operations, storage classes, ingress control, and explicit infrastructure management.
The official deployment packages cover different broker and footprint choices, including the default NATS-based setup, Kafka-based deployments, and minimal variants for leaner environments.
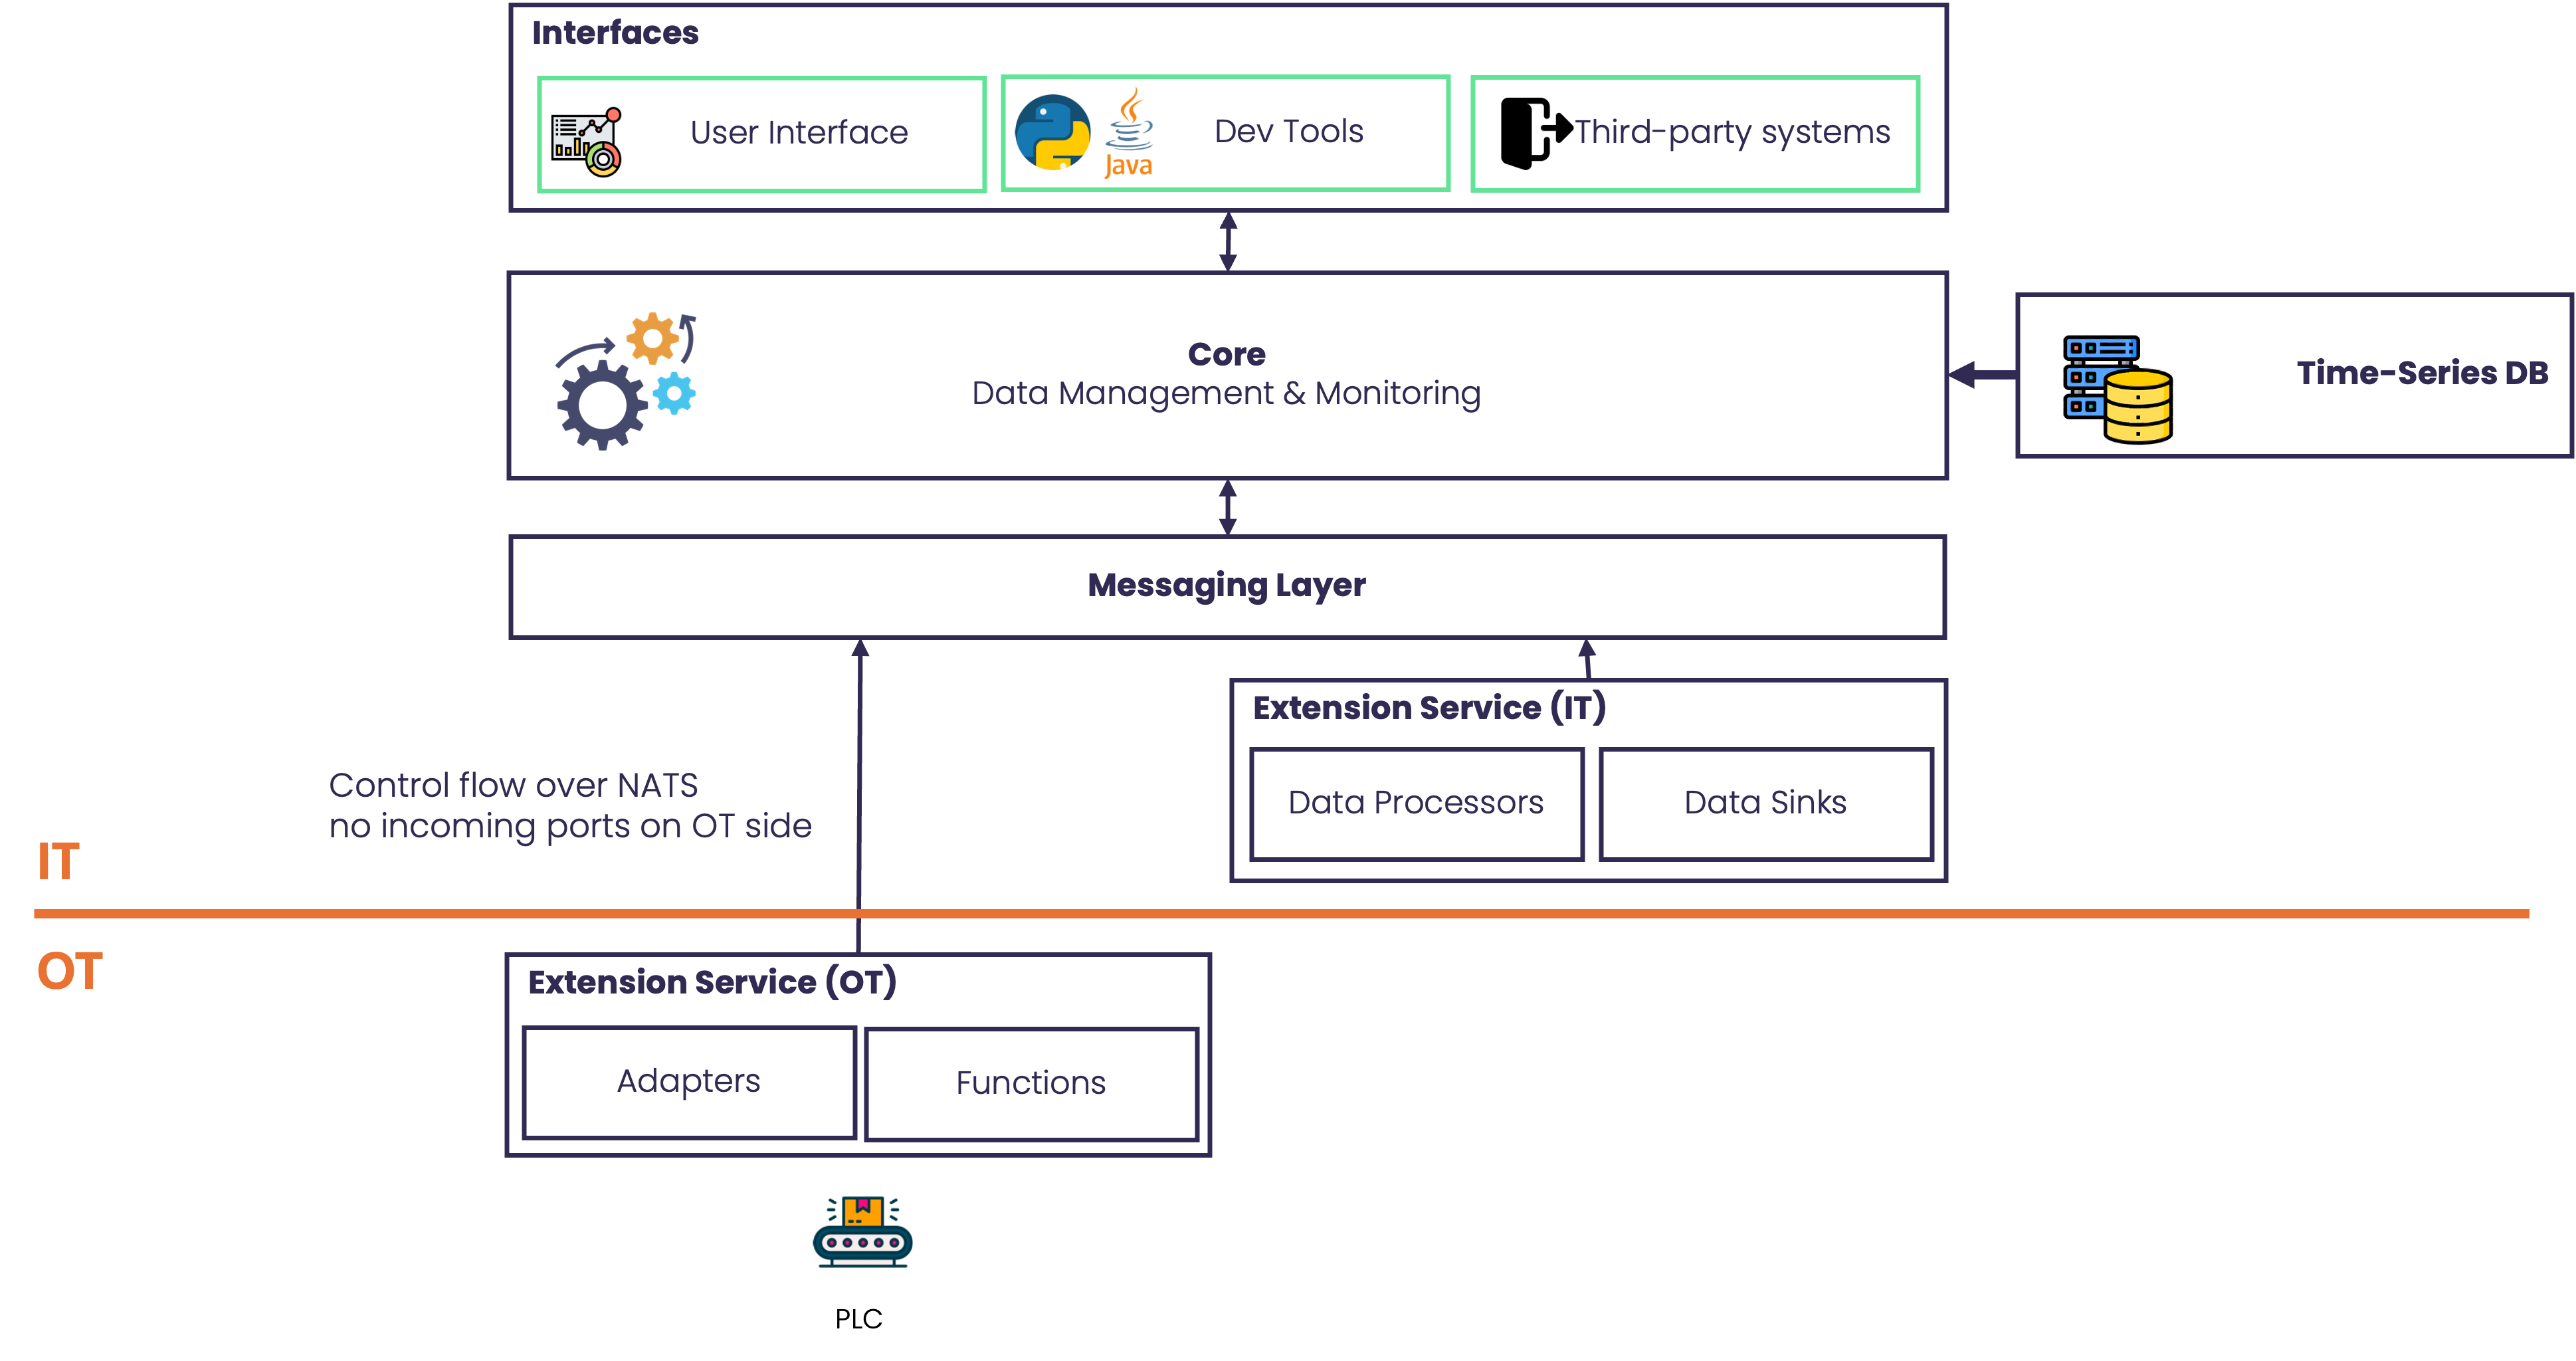
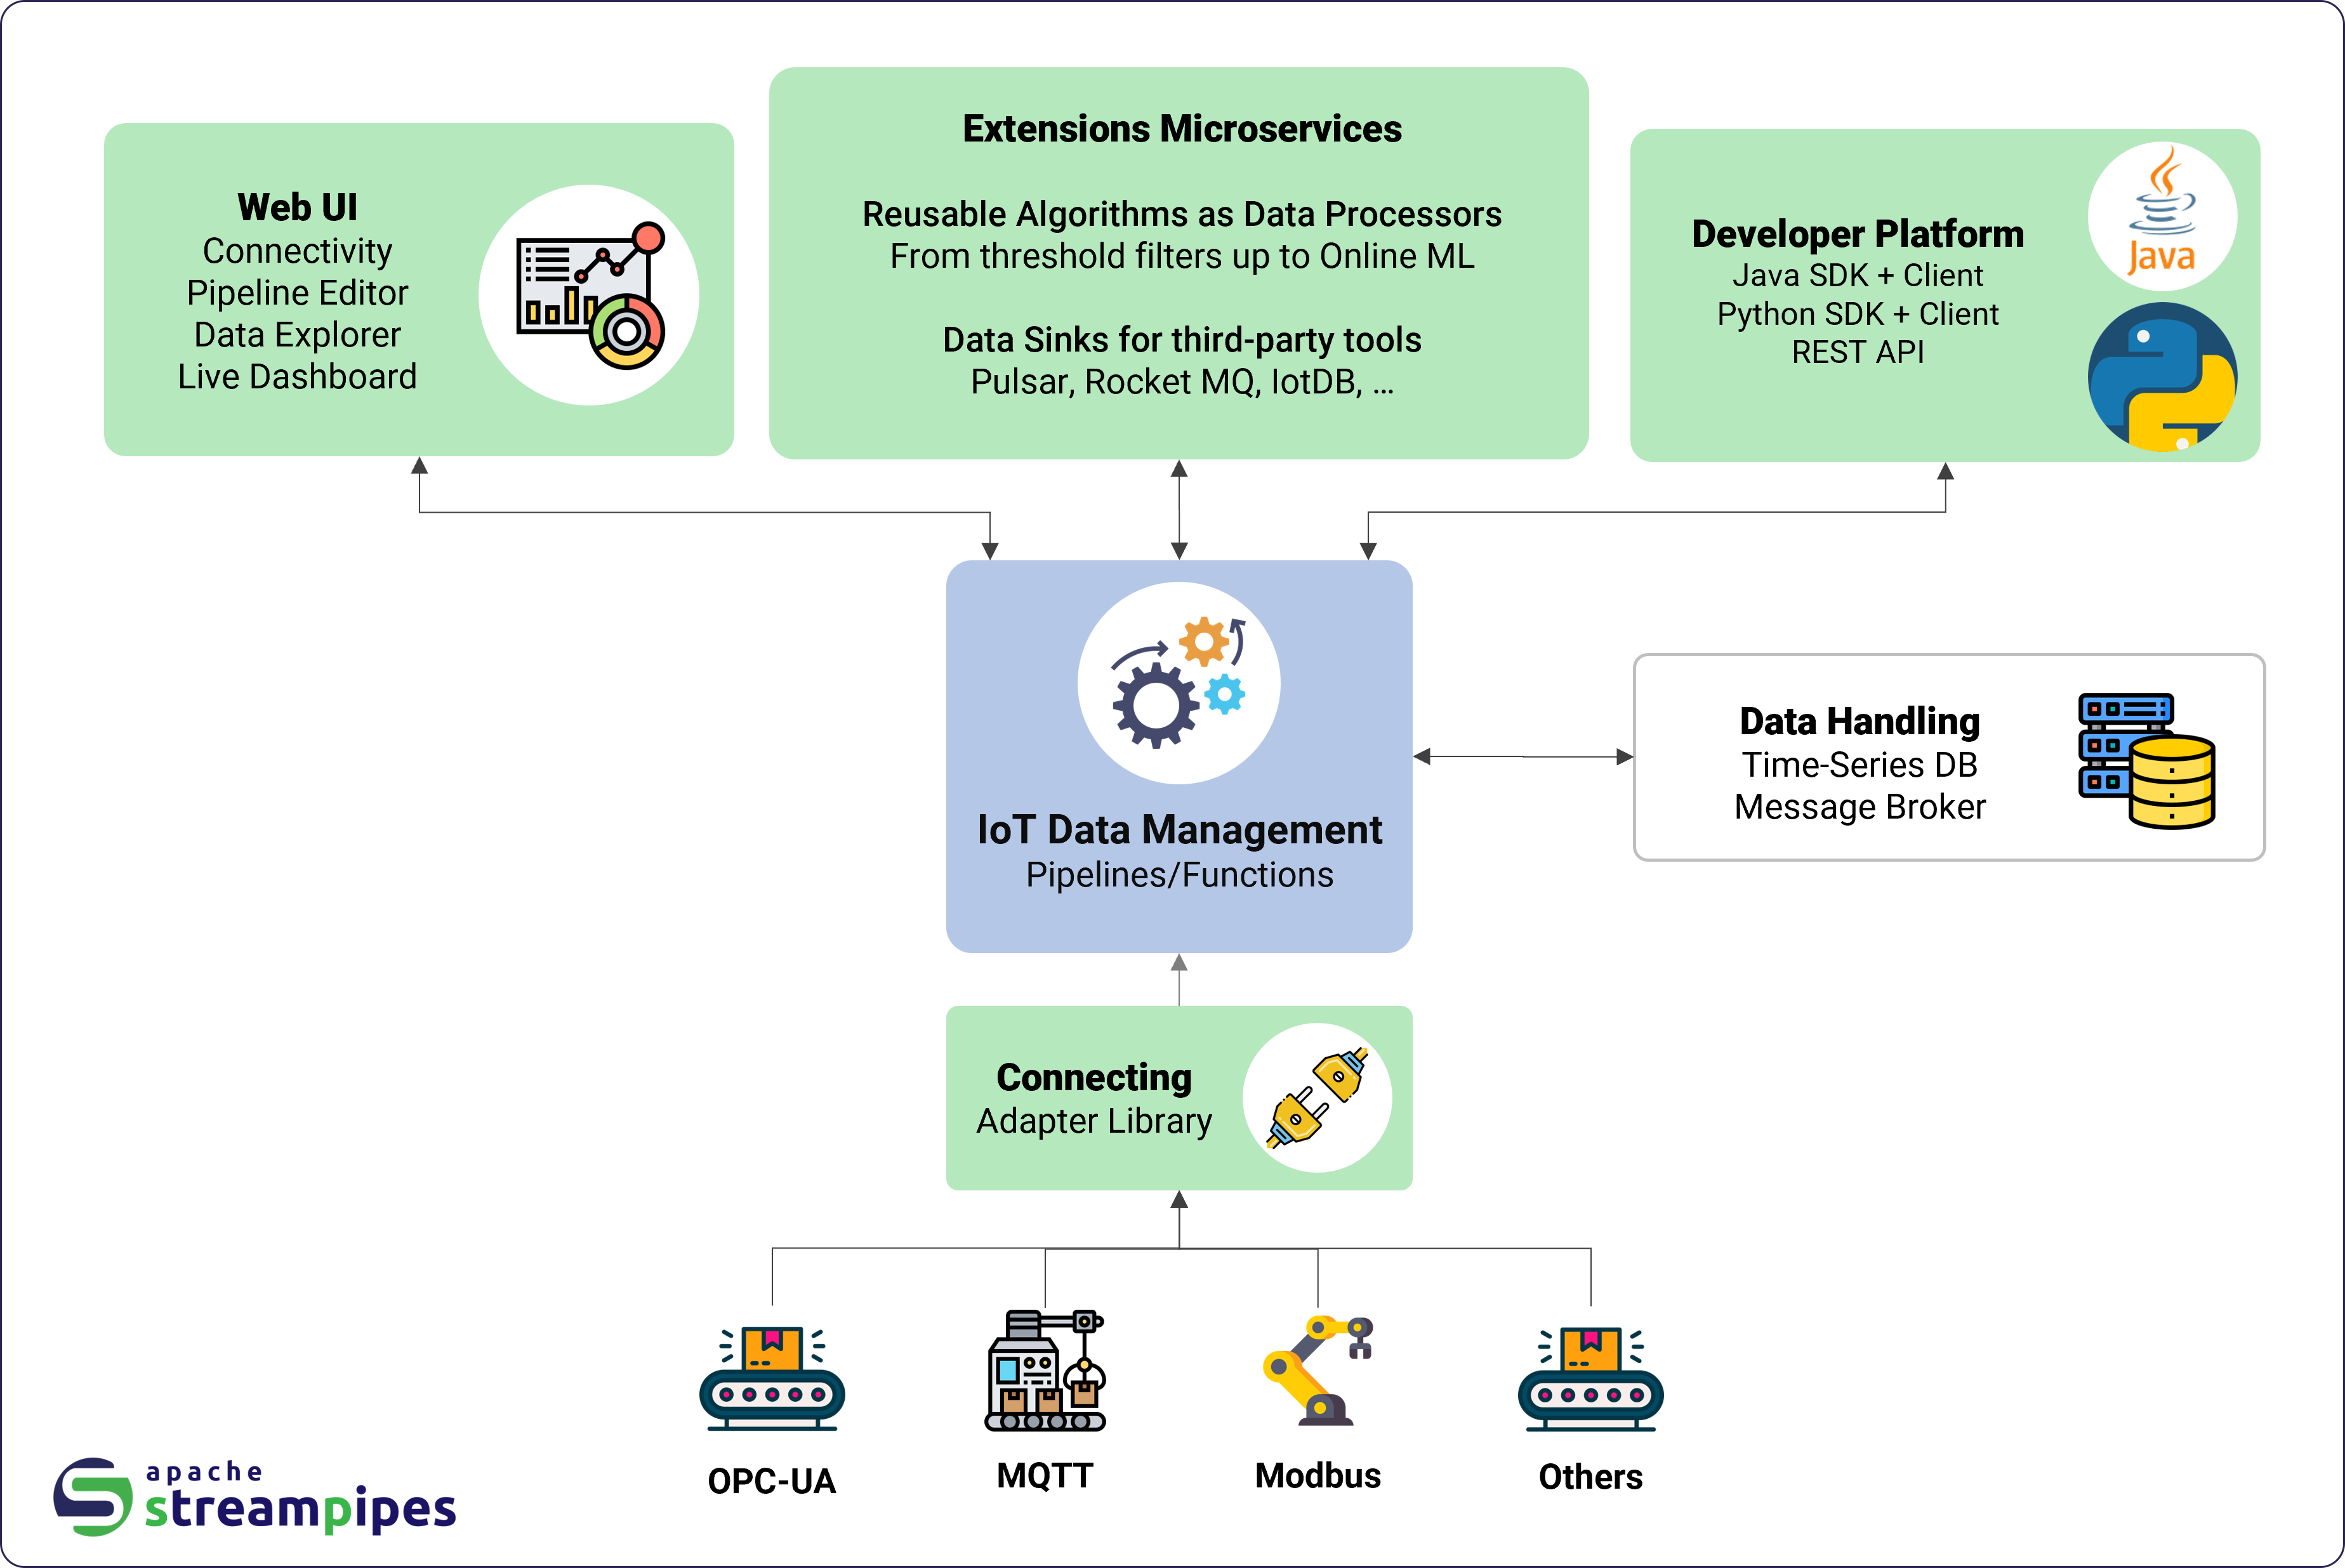
Distributed OT/IT deployment
A central advantage of StreamPipes is that extension services can run close to machines and industrial networks while the UI, core services, metadata, and historical storage stay in a central IT environment.
This makes it possible to place connectivity in the OT network, keep machine access local, and still manage adapters and processing centrally. In NATS-based setups, OT-side extension services can be integrated without requiring incoming traffic to be opened from central IT into the plant network.
The result is one platform that supports centralized governance without forcing all data collection components into the same network zone.
Ready for production. Out of the box.
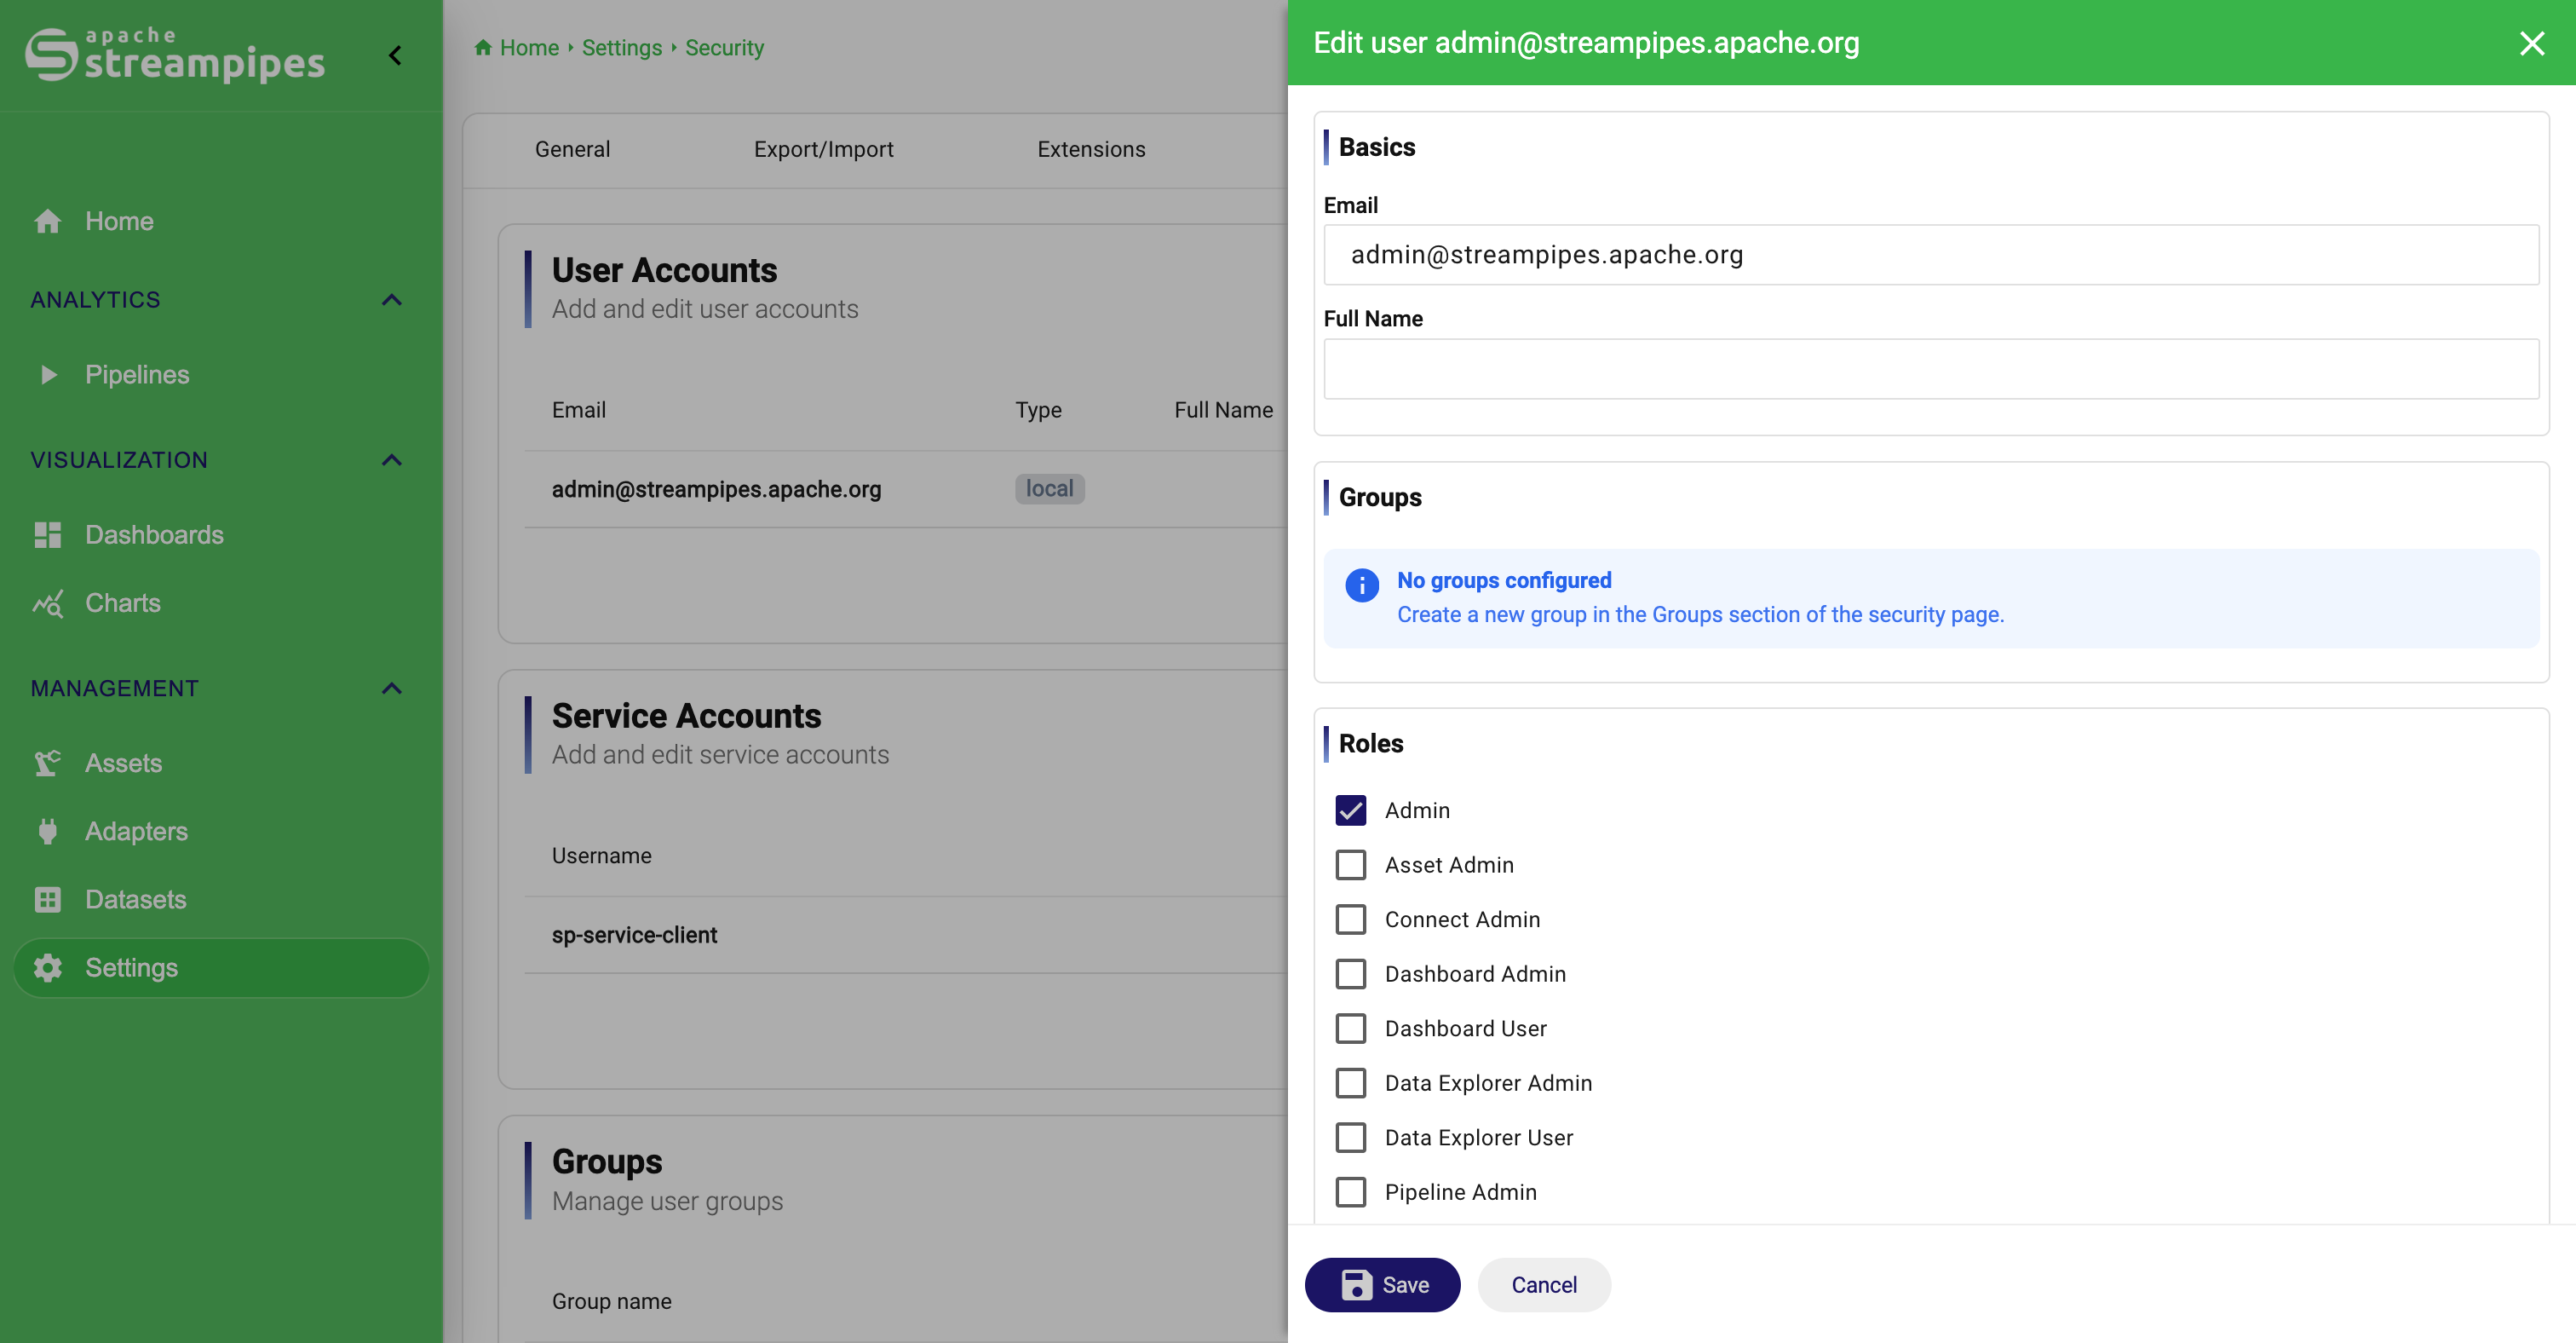
User Management
User management is included and can be configured directly from the user interface.
StreamPipes supports the management of users, groups and permissions, so that access to views can be individually restricted. OAuth 2.0 can enabled.
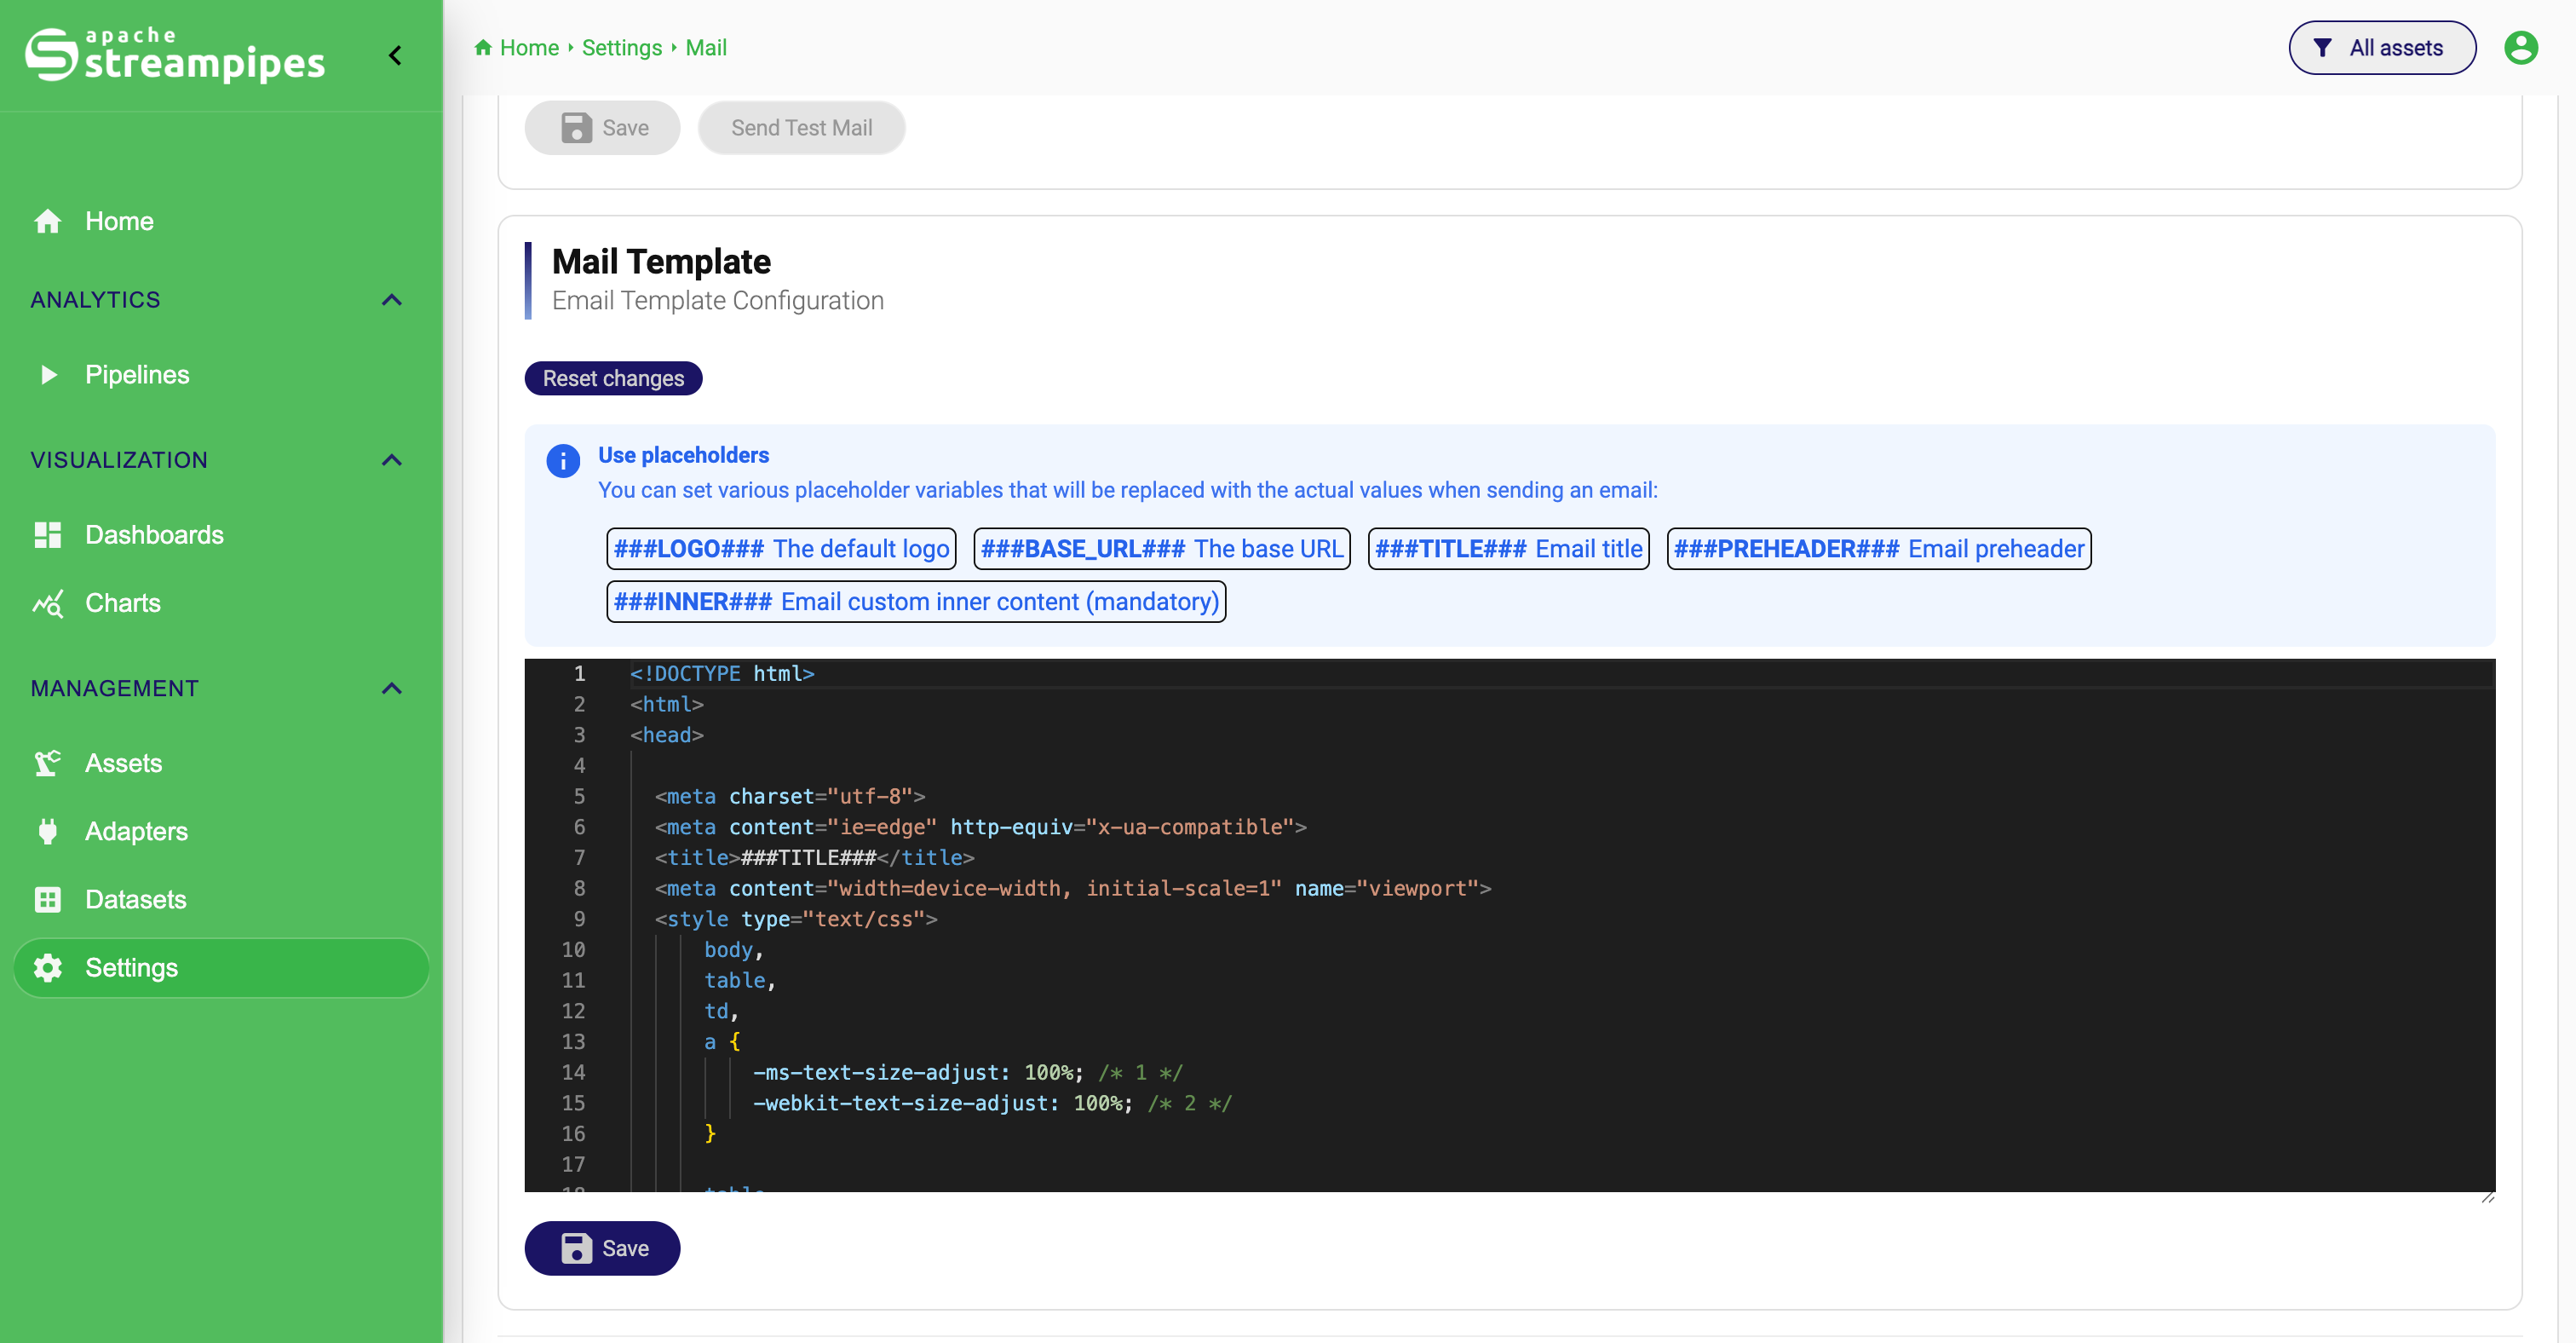
Email & notifications
StreamPipes can be configured to send emails, e.g., as notifications directly from the pipeline editor.
With configured email settings, user self-registration and password recovery can be activated.
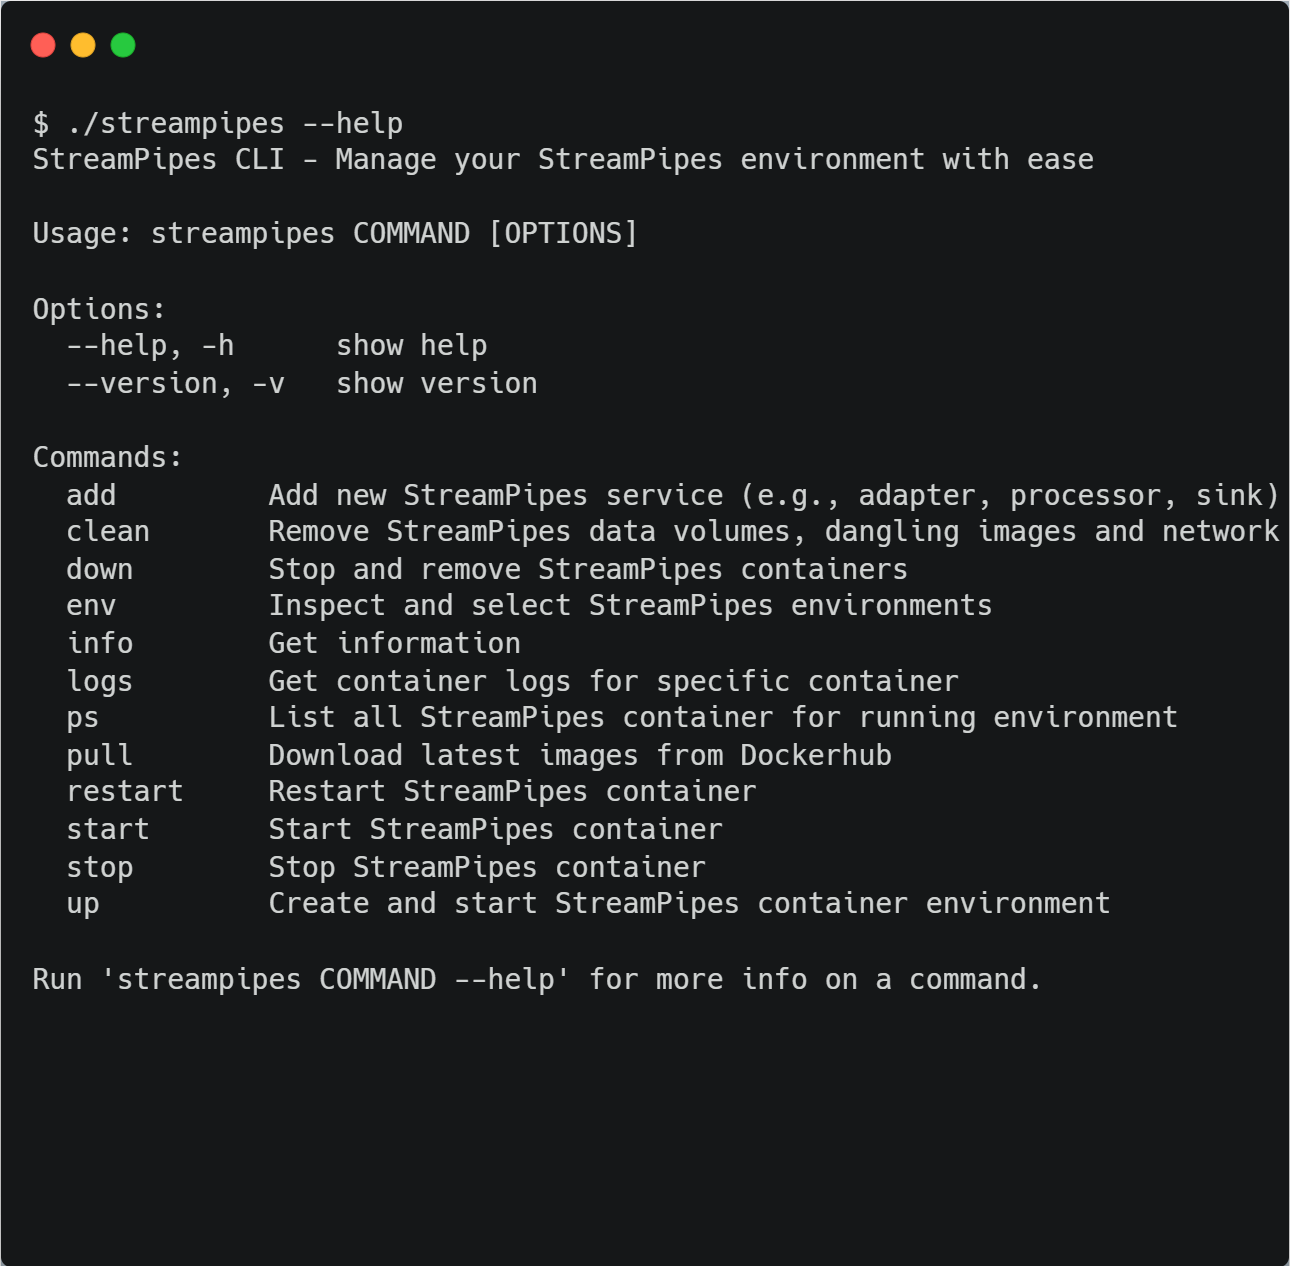
Container-based deployment
Besides the official source code releases, Apache StreamPipes offers ready-to-use deployment packages.
Several Docker Compose files are available to start StreamPipes with one of the supported message brokers for local setups.
In addition, helm charts are provided to deploy StreamPipes to Kubernetes clusters.
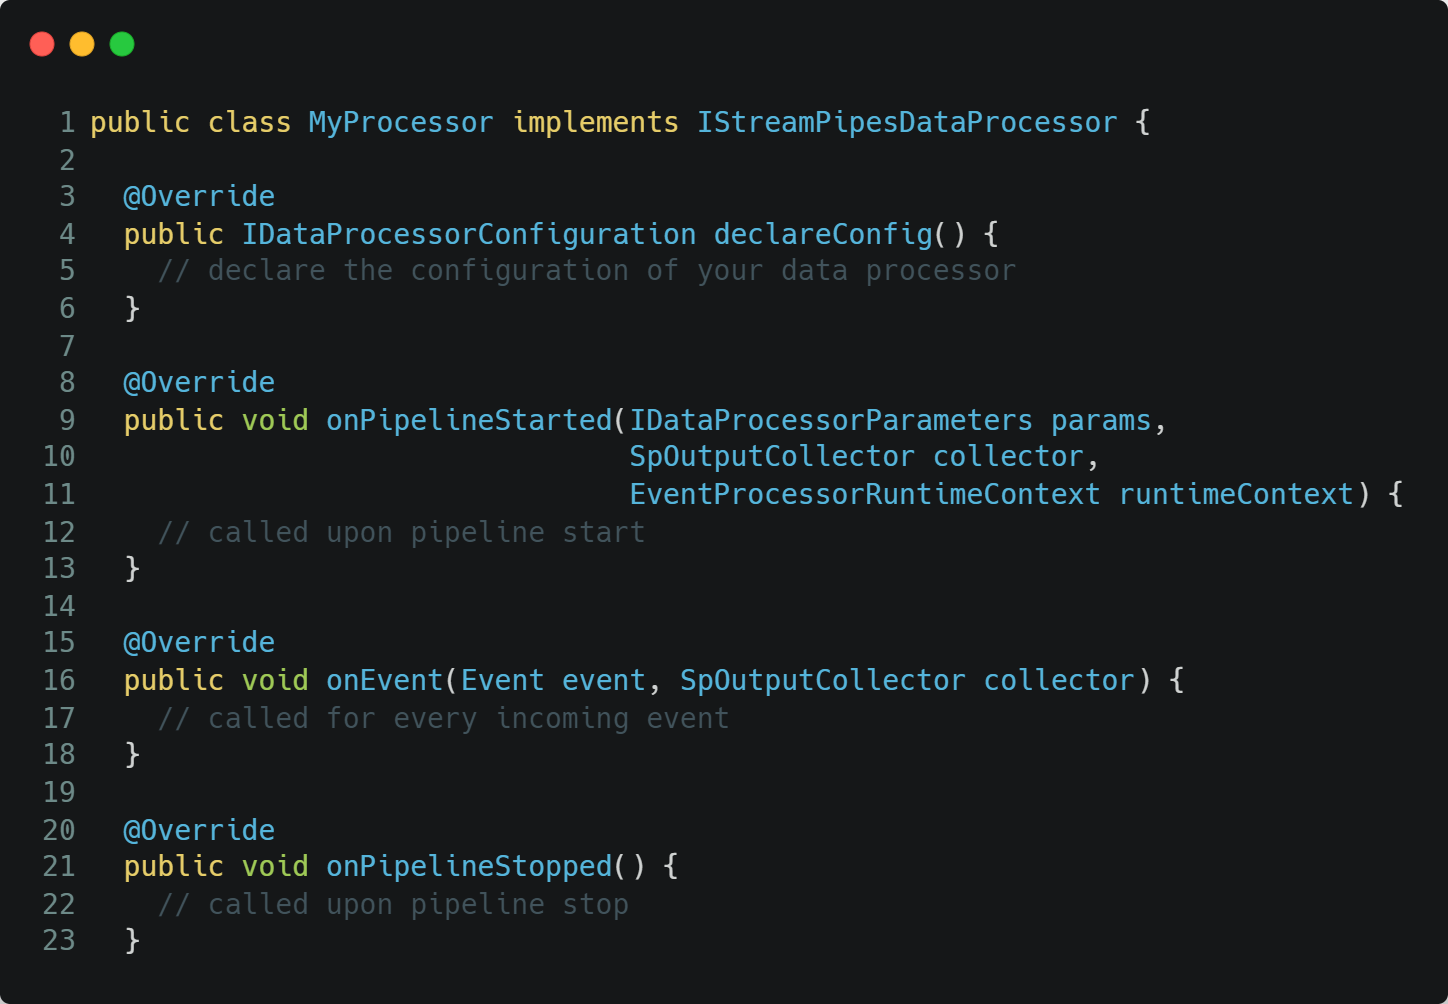
First-class developer support
Apache StreamPipes is a great platform for developers: Implement custom adapters, data processors or sinks and install them at runtime.
Use StreamPipes Functions to define processing logic based on real-time IIoT data.
Or use the client libraries, available in Java and Python, to interact with live and historical data in an easy way.
Add your own extensions with the Software Development Kit
It is easy to extend StreamPipes. Whether you need connectivity to a proprietary data source, want to implement your custom-tailored algorithm as a pipeline element or need a new interface to your third party system: Simply use the SDK to extend the functionality of StreamPipes.
With its microservice architecture at its core, you can install your extensions at any time without the need to restart the whole system.
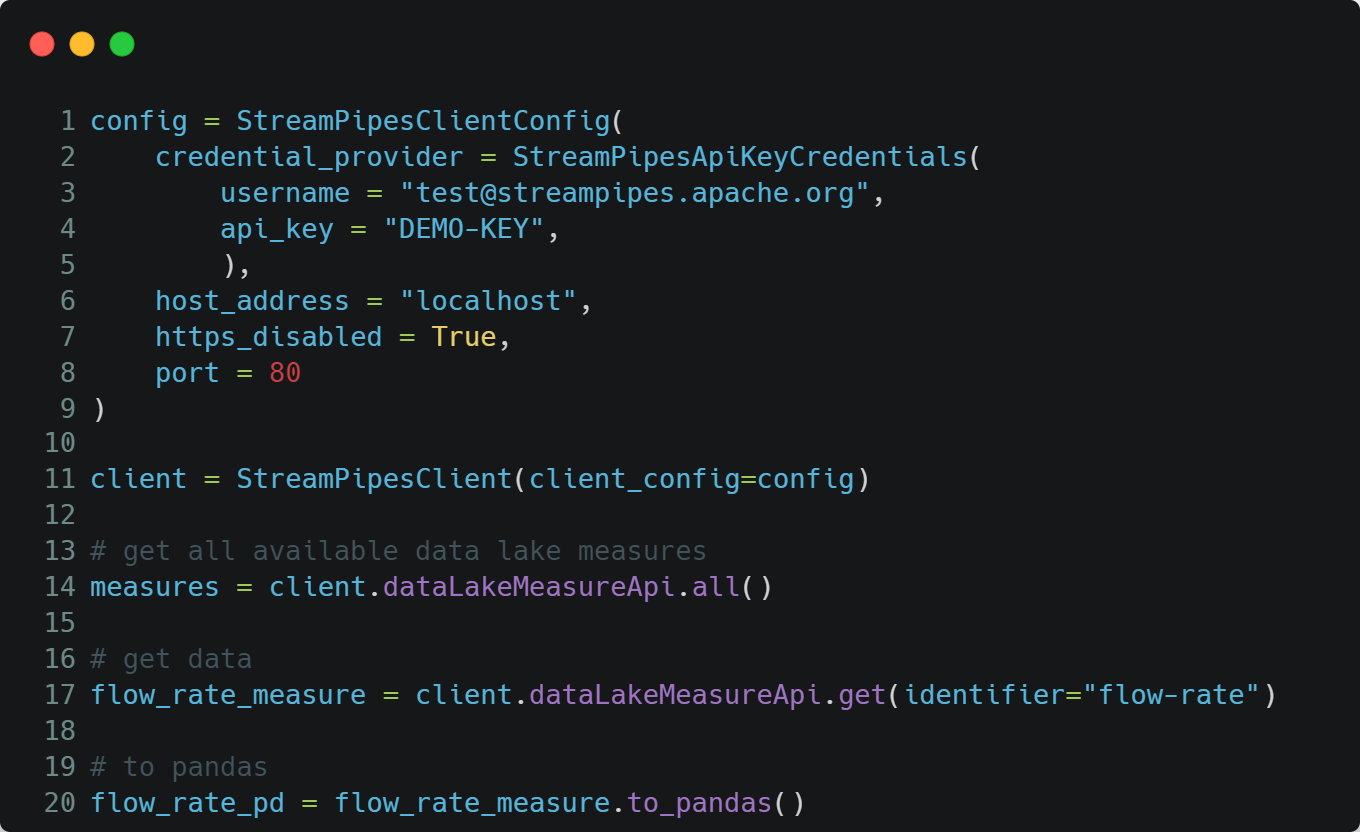
Interact with StreamPipes through our client libraries
StreamPipes includes Java and Python libraries which allow you to interact with StreamPipes programmatically.
You can modify the pipeline lifecycle, receive live data from all connected sources in a unified API, and Data Scientists love the possibility to extract historical data directly into Pandas data frames for in-depth analysis.
And of course, you can also just use the provided REST interface!
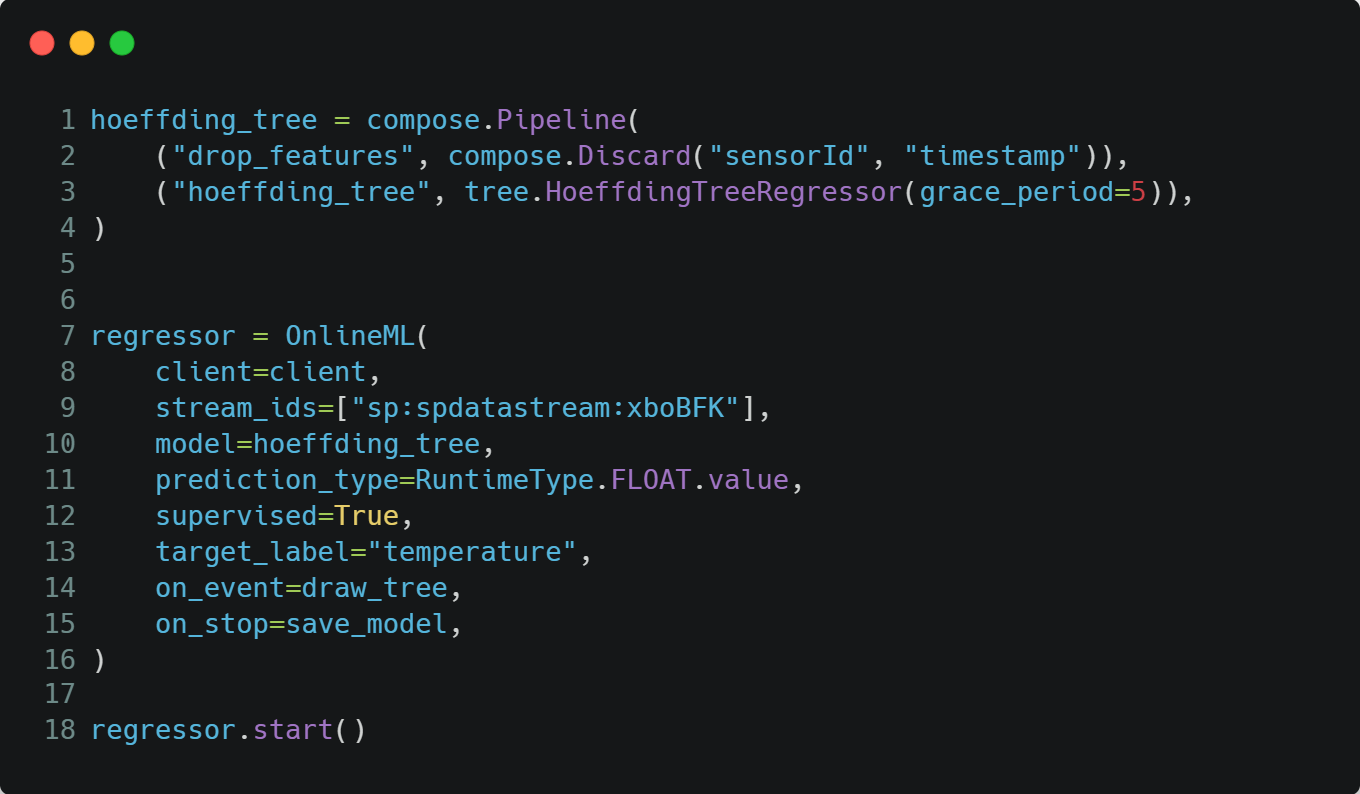
Seamlessly integrate AI & Machine Learning
Our Python client includes an integration with the OnlineML library River, so that you can get started with your custom anomaly detection and other ML features with just a few lines of code.
But you can also integrate other ML models, and play back the results in form of a new data stream to StreamPipes.