Tour
StreamPipes is a framework that enables domain experts to model and execute stream processing pipelines in a big data infrastructure. The graphical user interface of StreamPipes is a web application that provides an easy to use solution for domain experts. In this page, an overview of the many features of StreamPipes is given. We will tour through all features and explain what they do and how users can interact with them.
First of all, a user needs to log in to the system. The credentials for the user are specified during the installation process.
Home
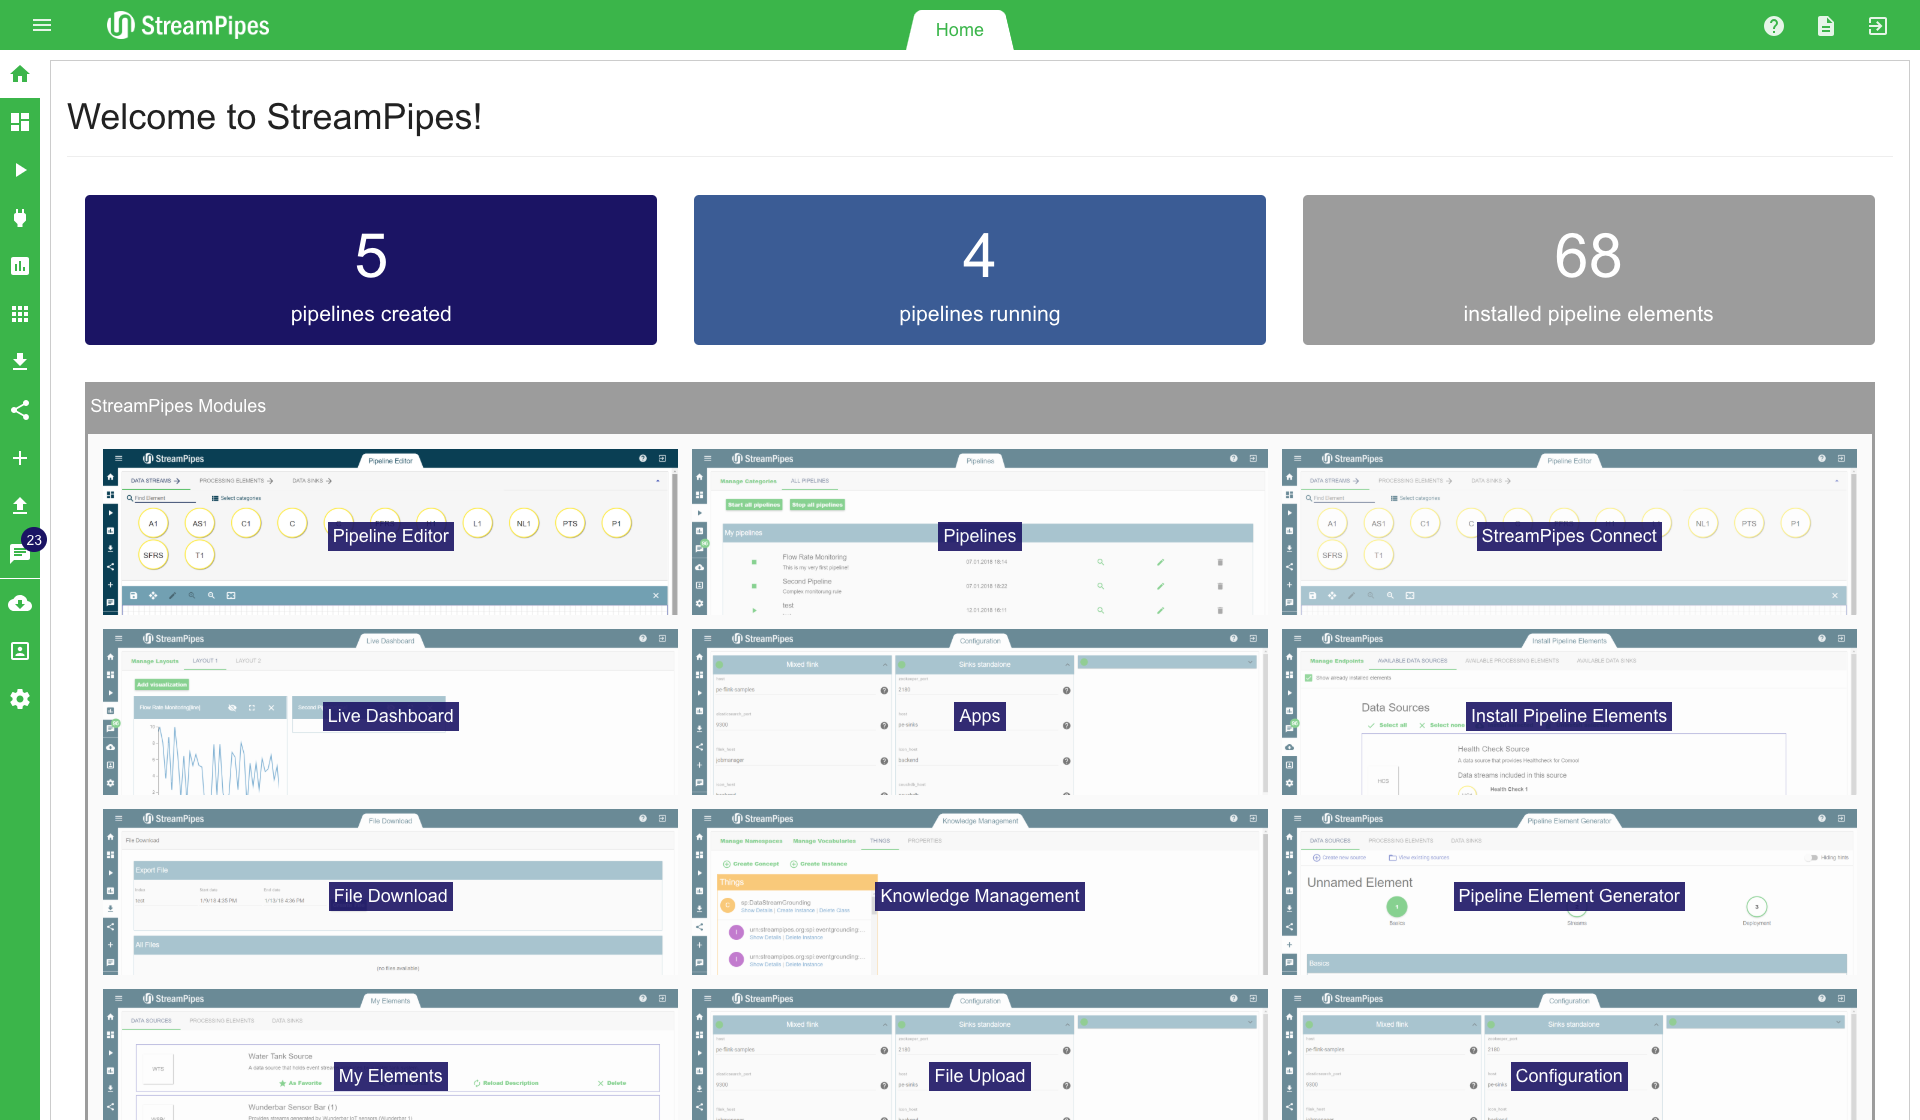
After logging in, the user is redirected on to the home page. The home page gives an overview over the different features available in the StreamPipes UI.
On the left, the navigation menu can be seen. You can either use the icons on the left side or click on the menu icon on the top left to open the details view of the navigation menu.
On the top right, a link refers to the documentation and the logout button is present.
Pipeline Editor
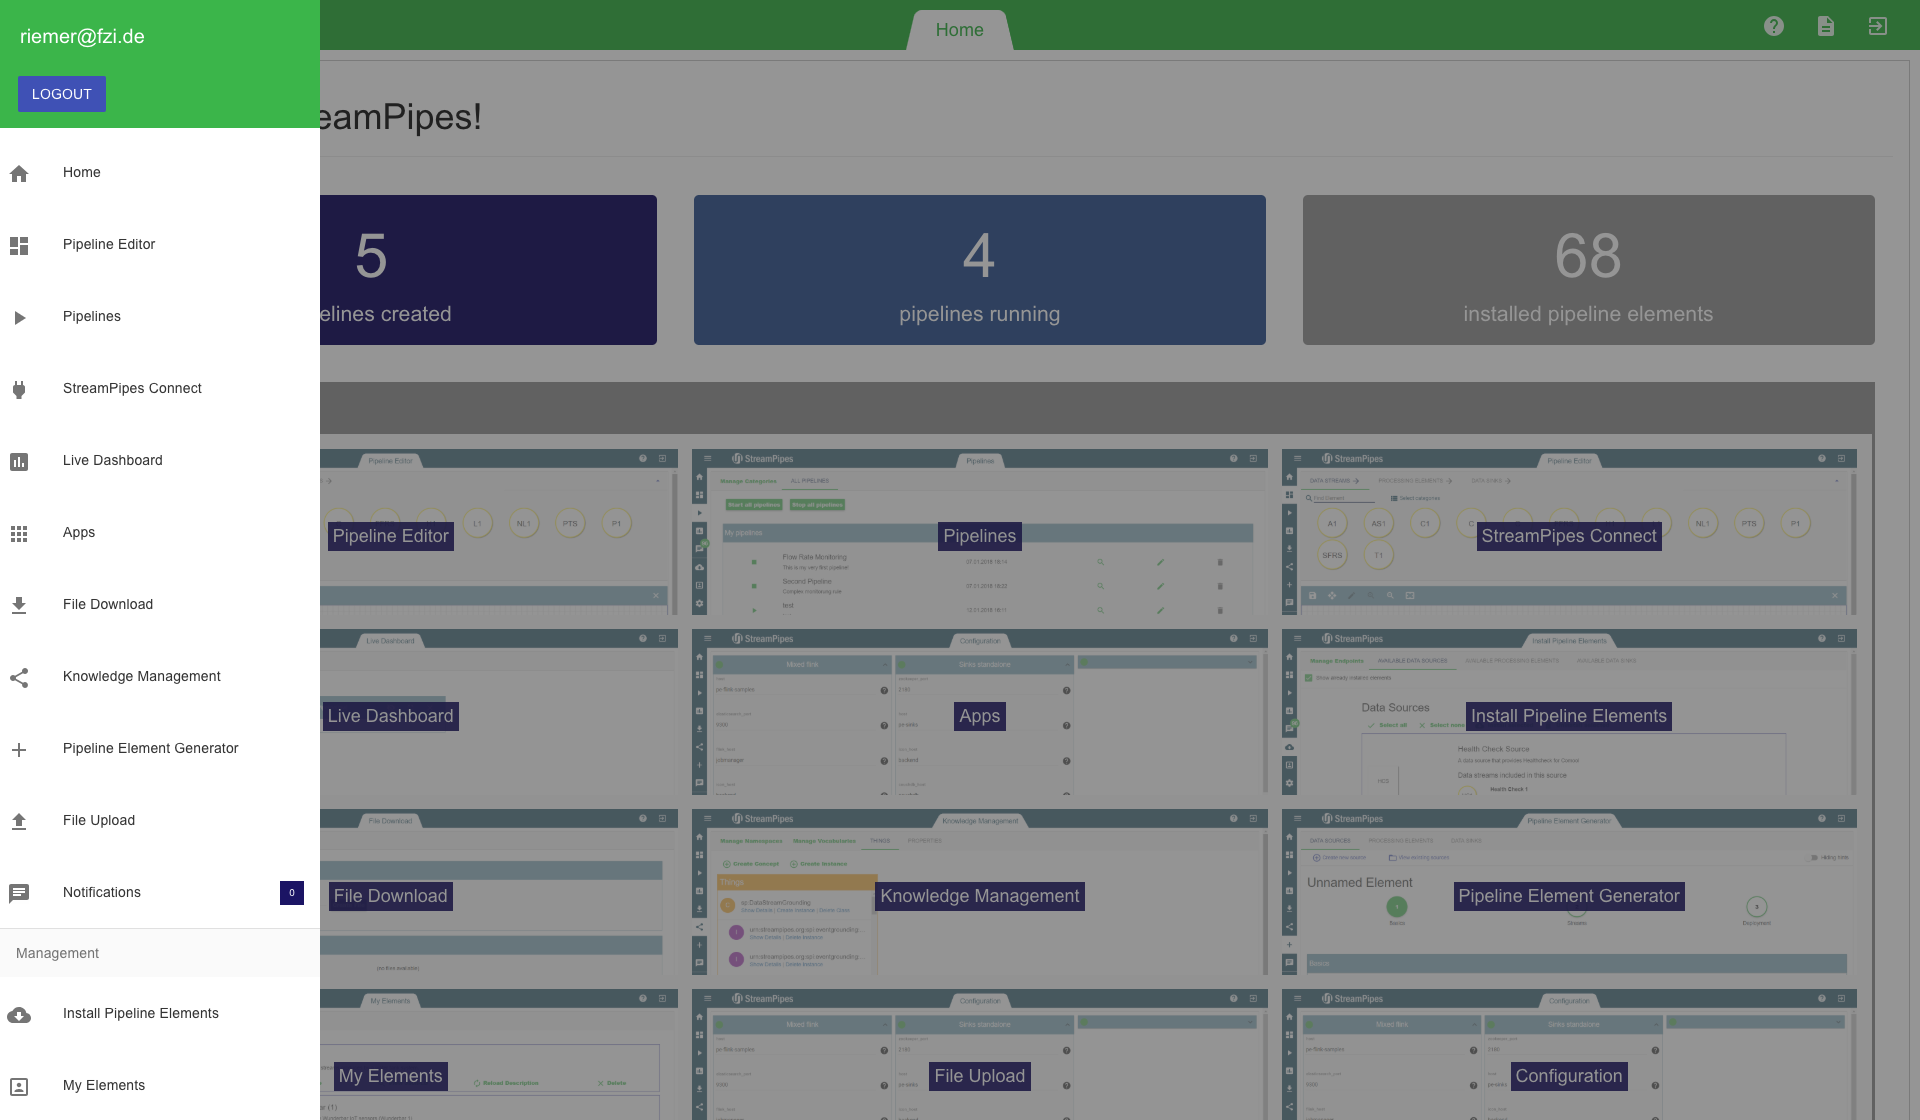
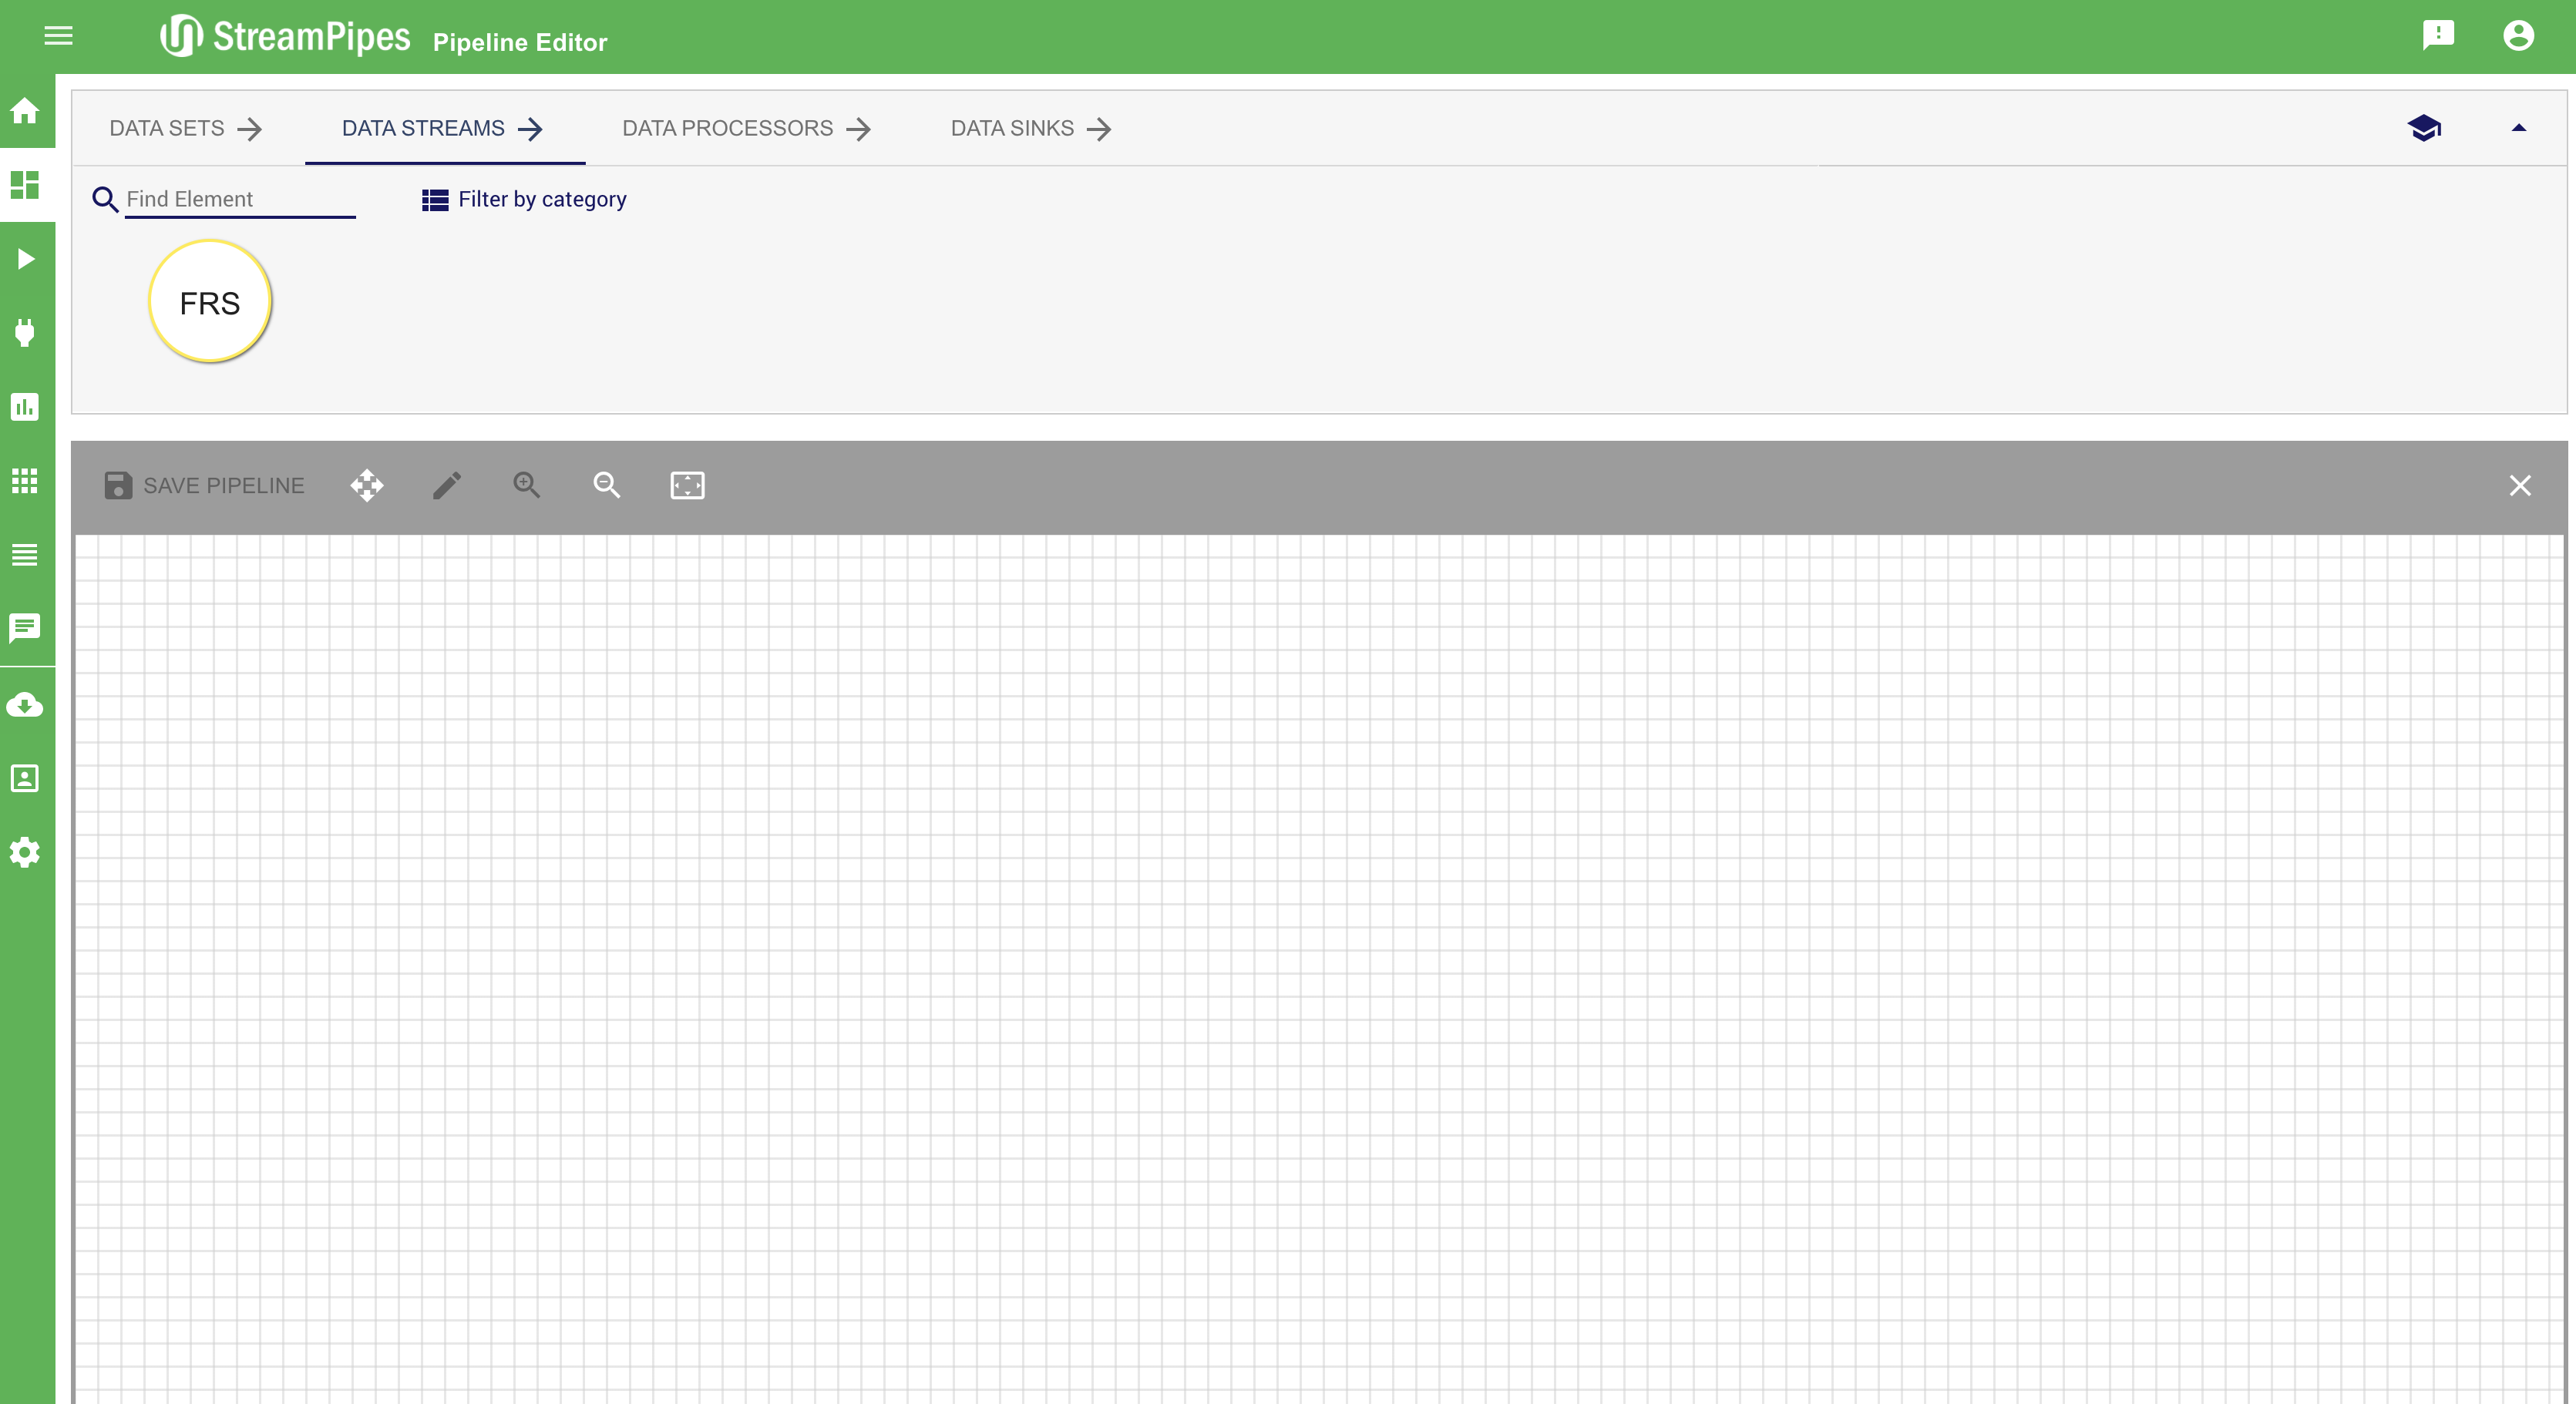
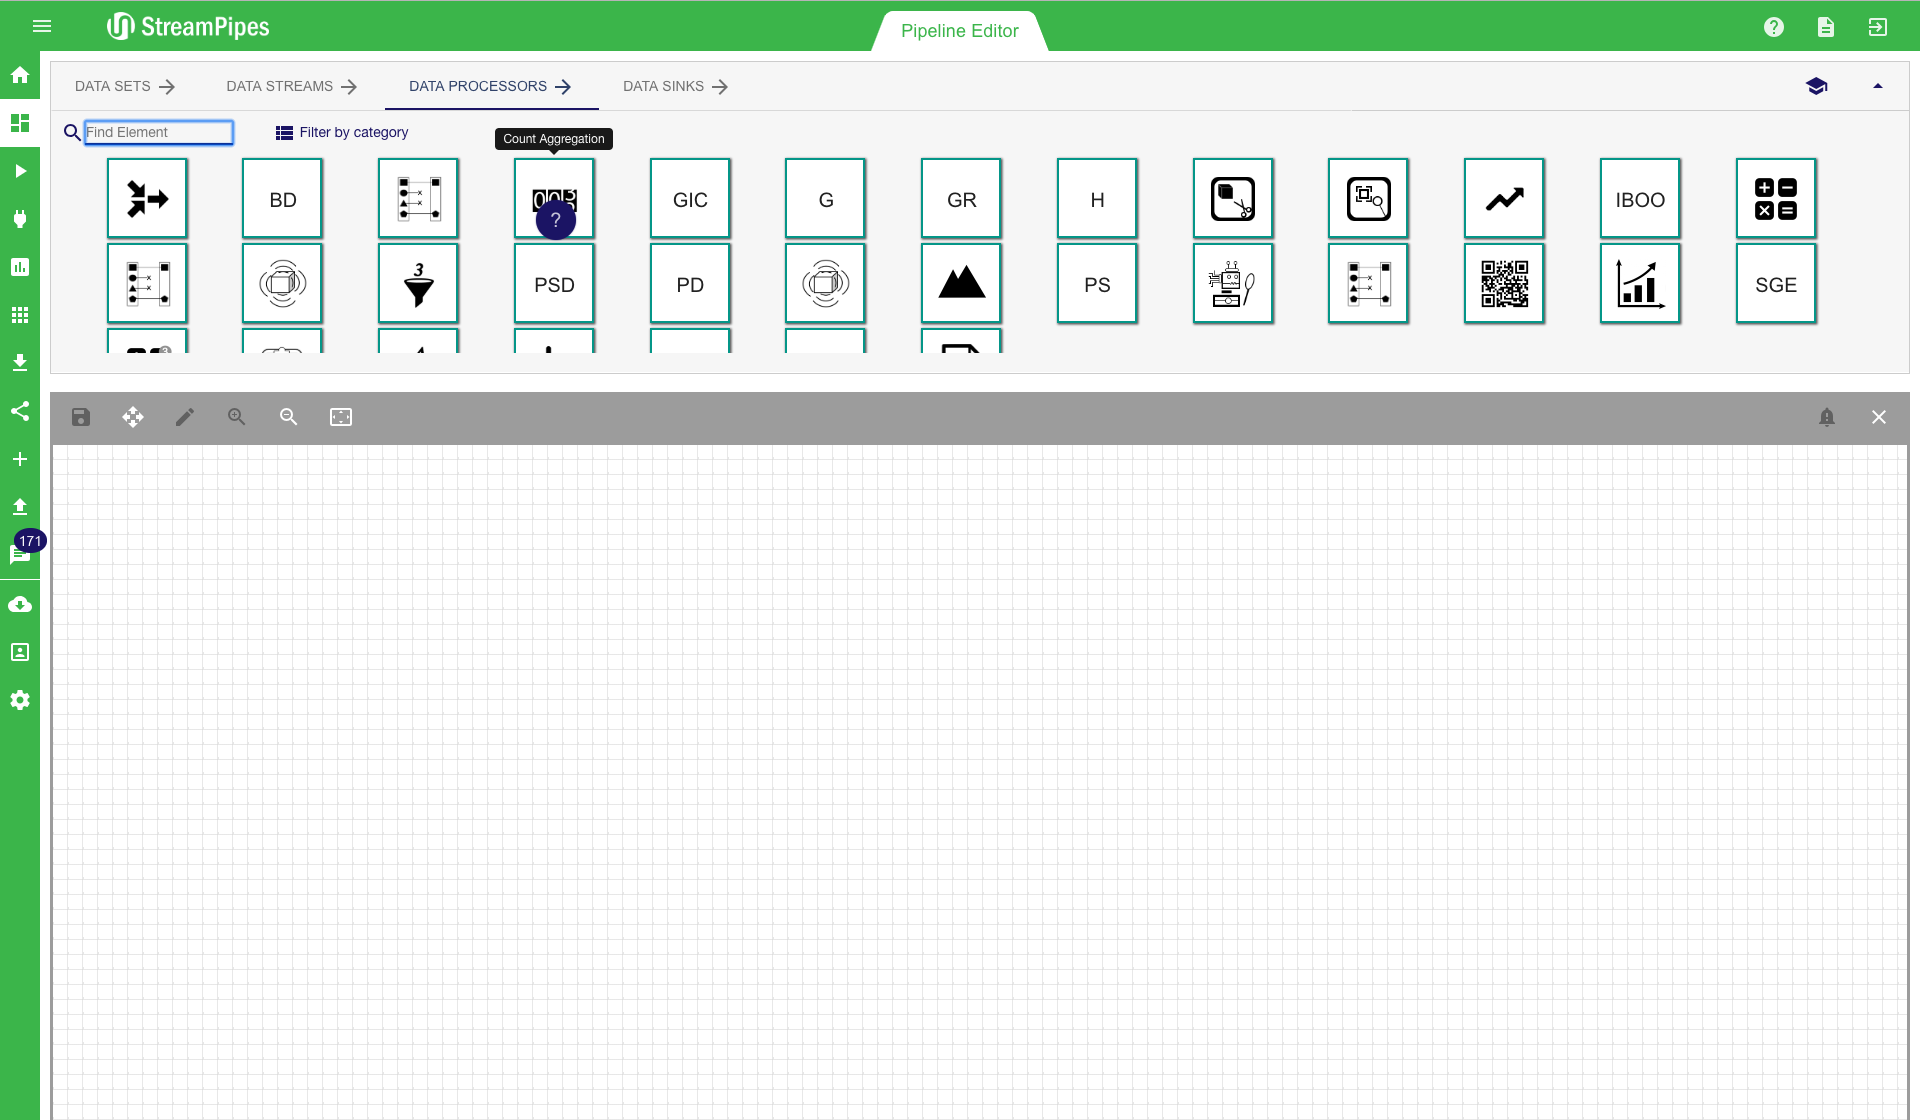
The first feature we are going to explain is the Pipeline Editor. This is one of the central features of StreamPipes, since graphical modeling of pipelines takes place in this view.
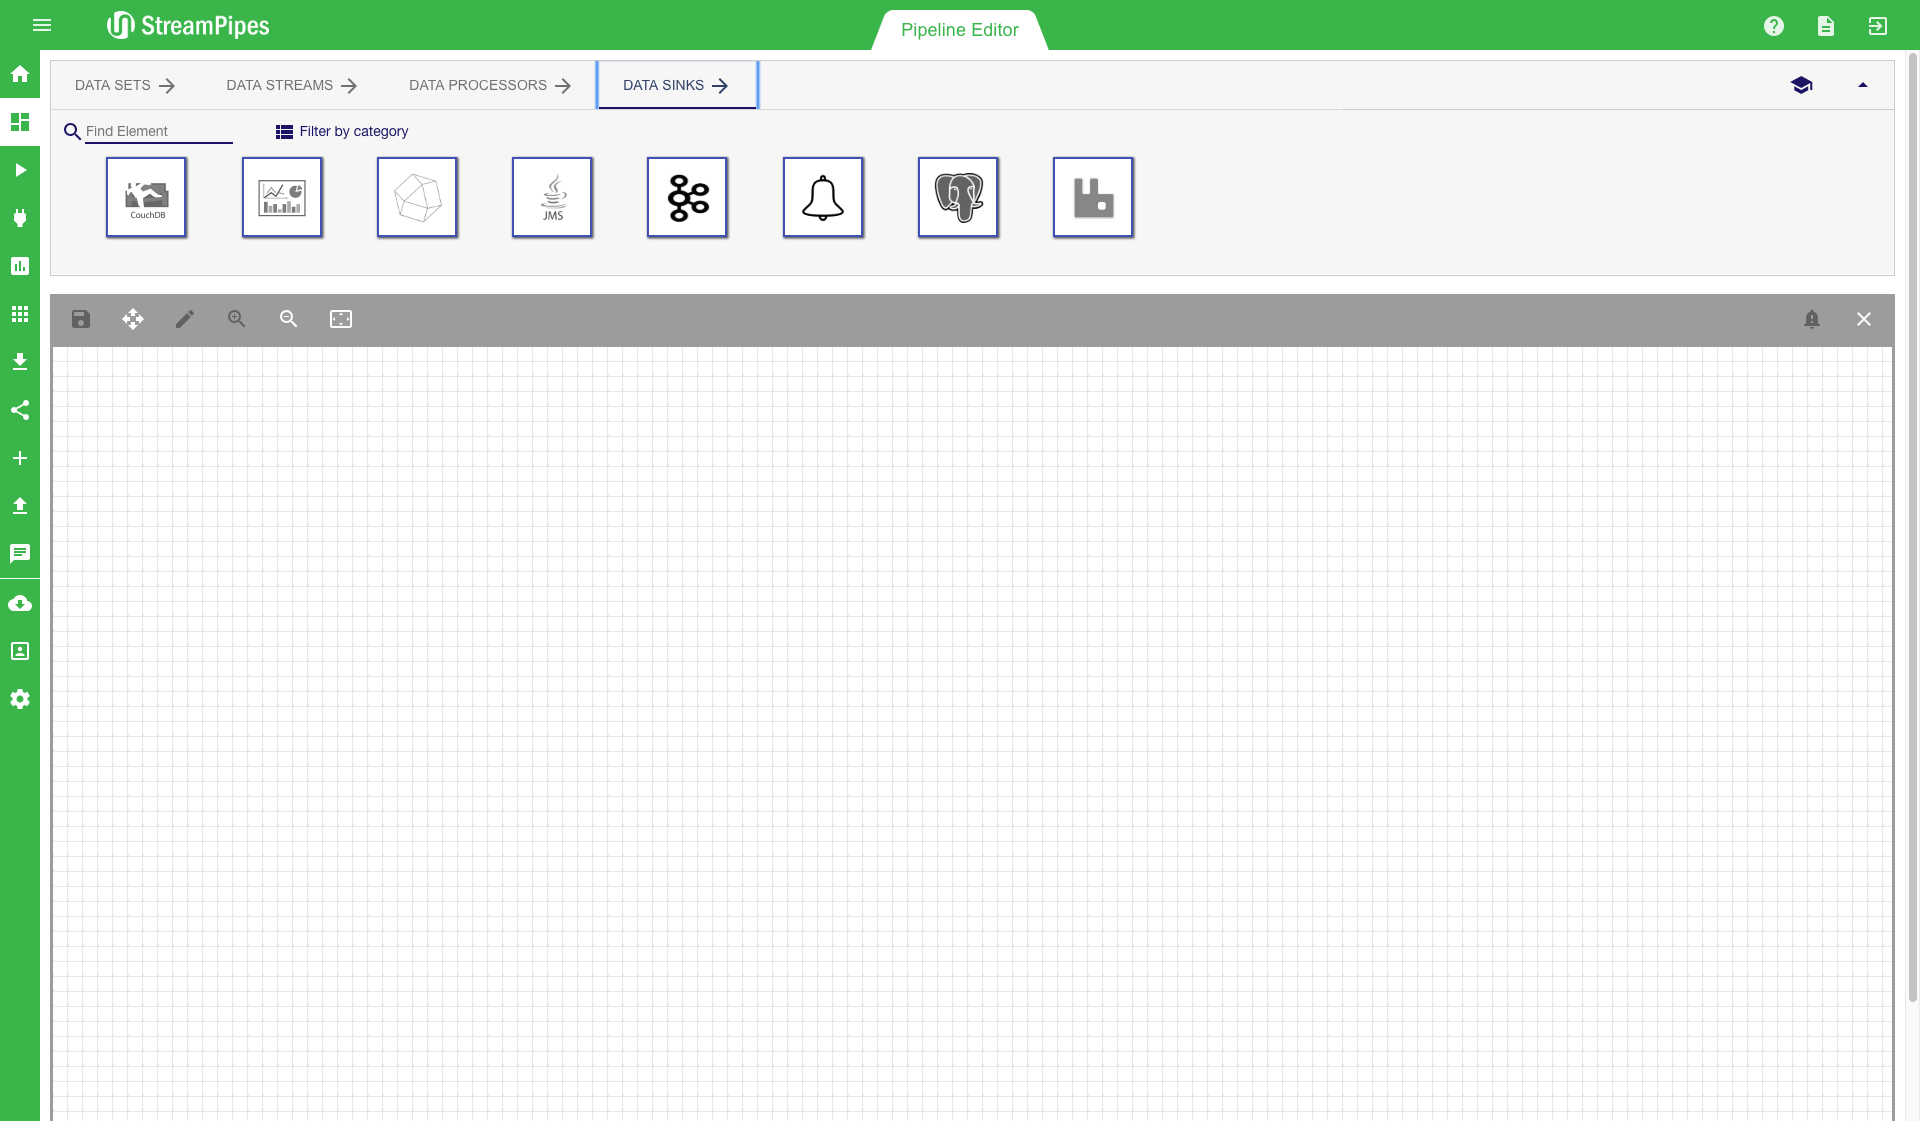
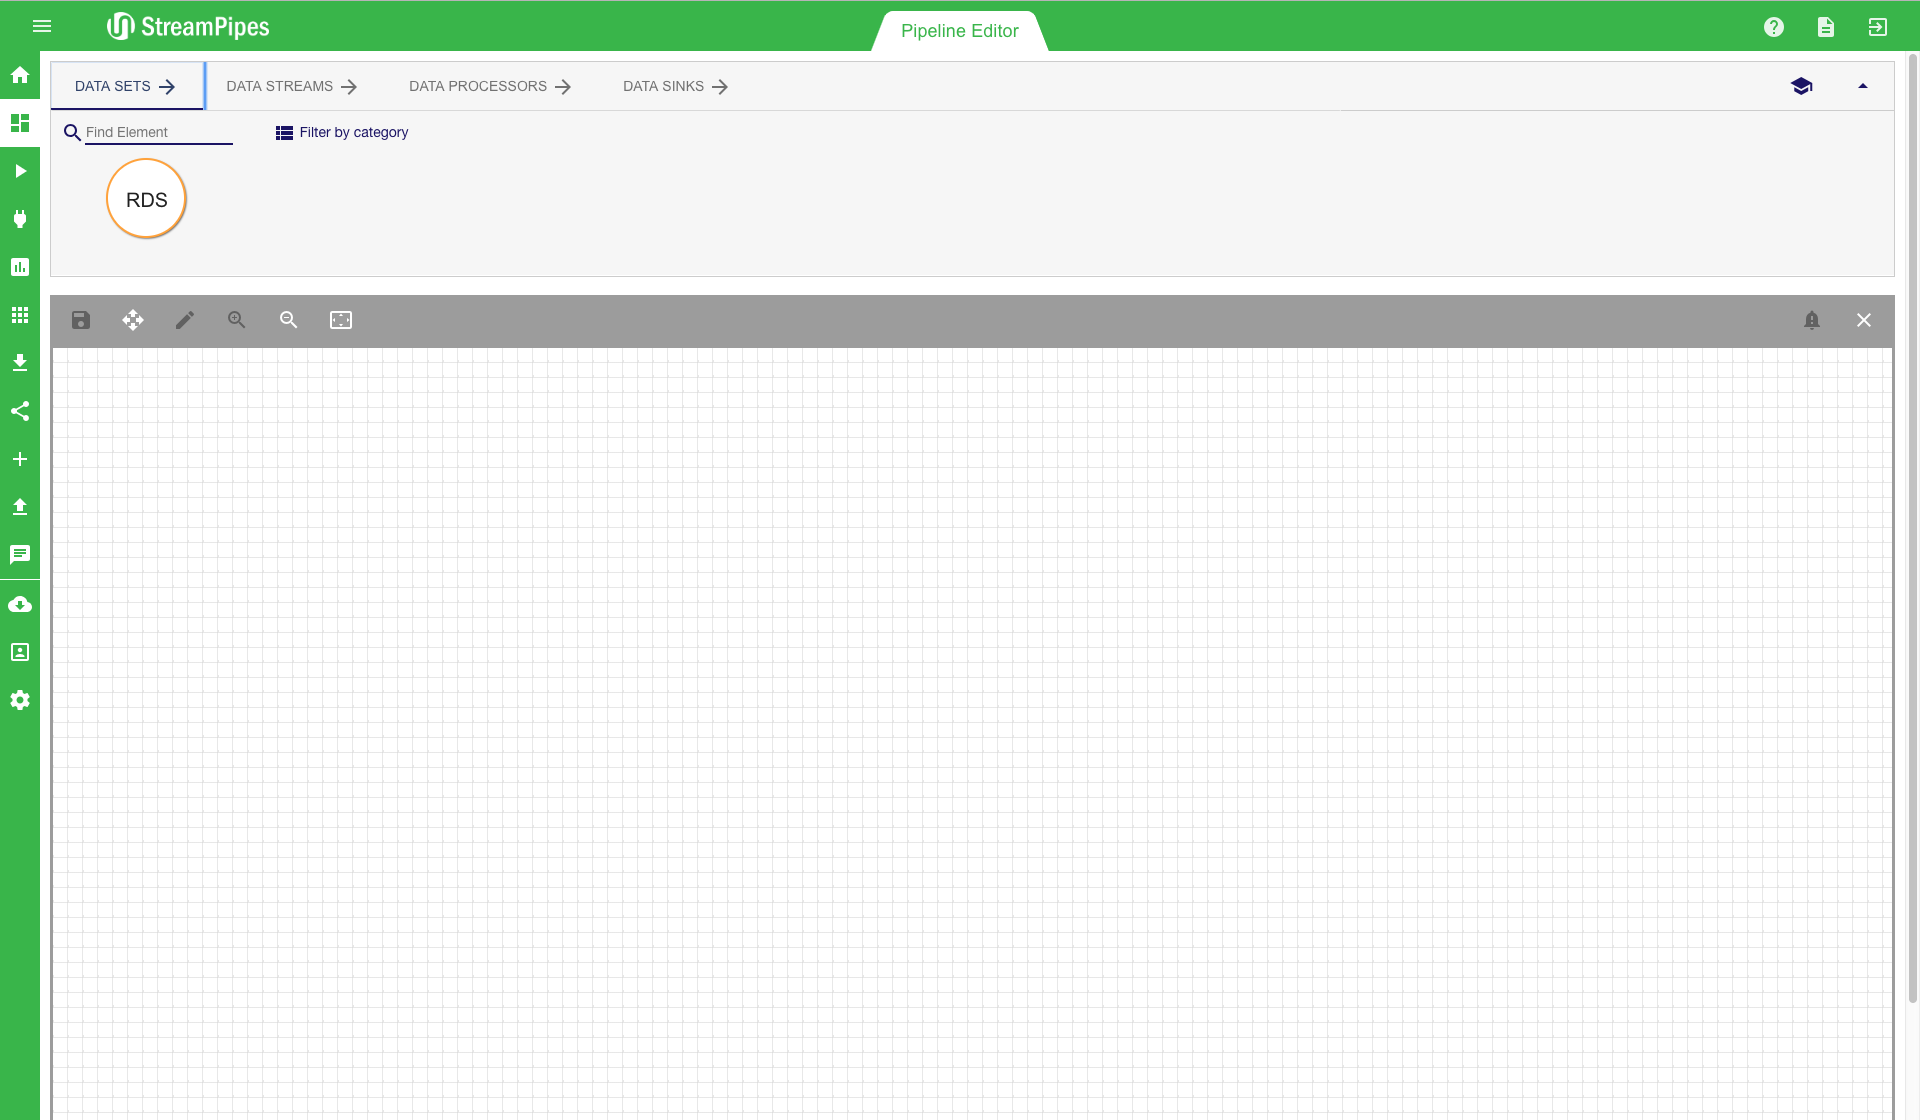
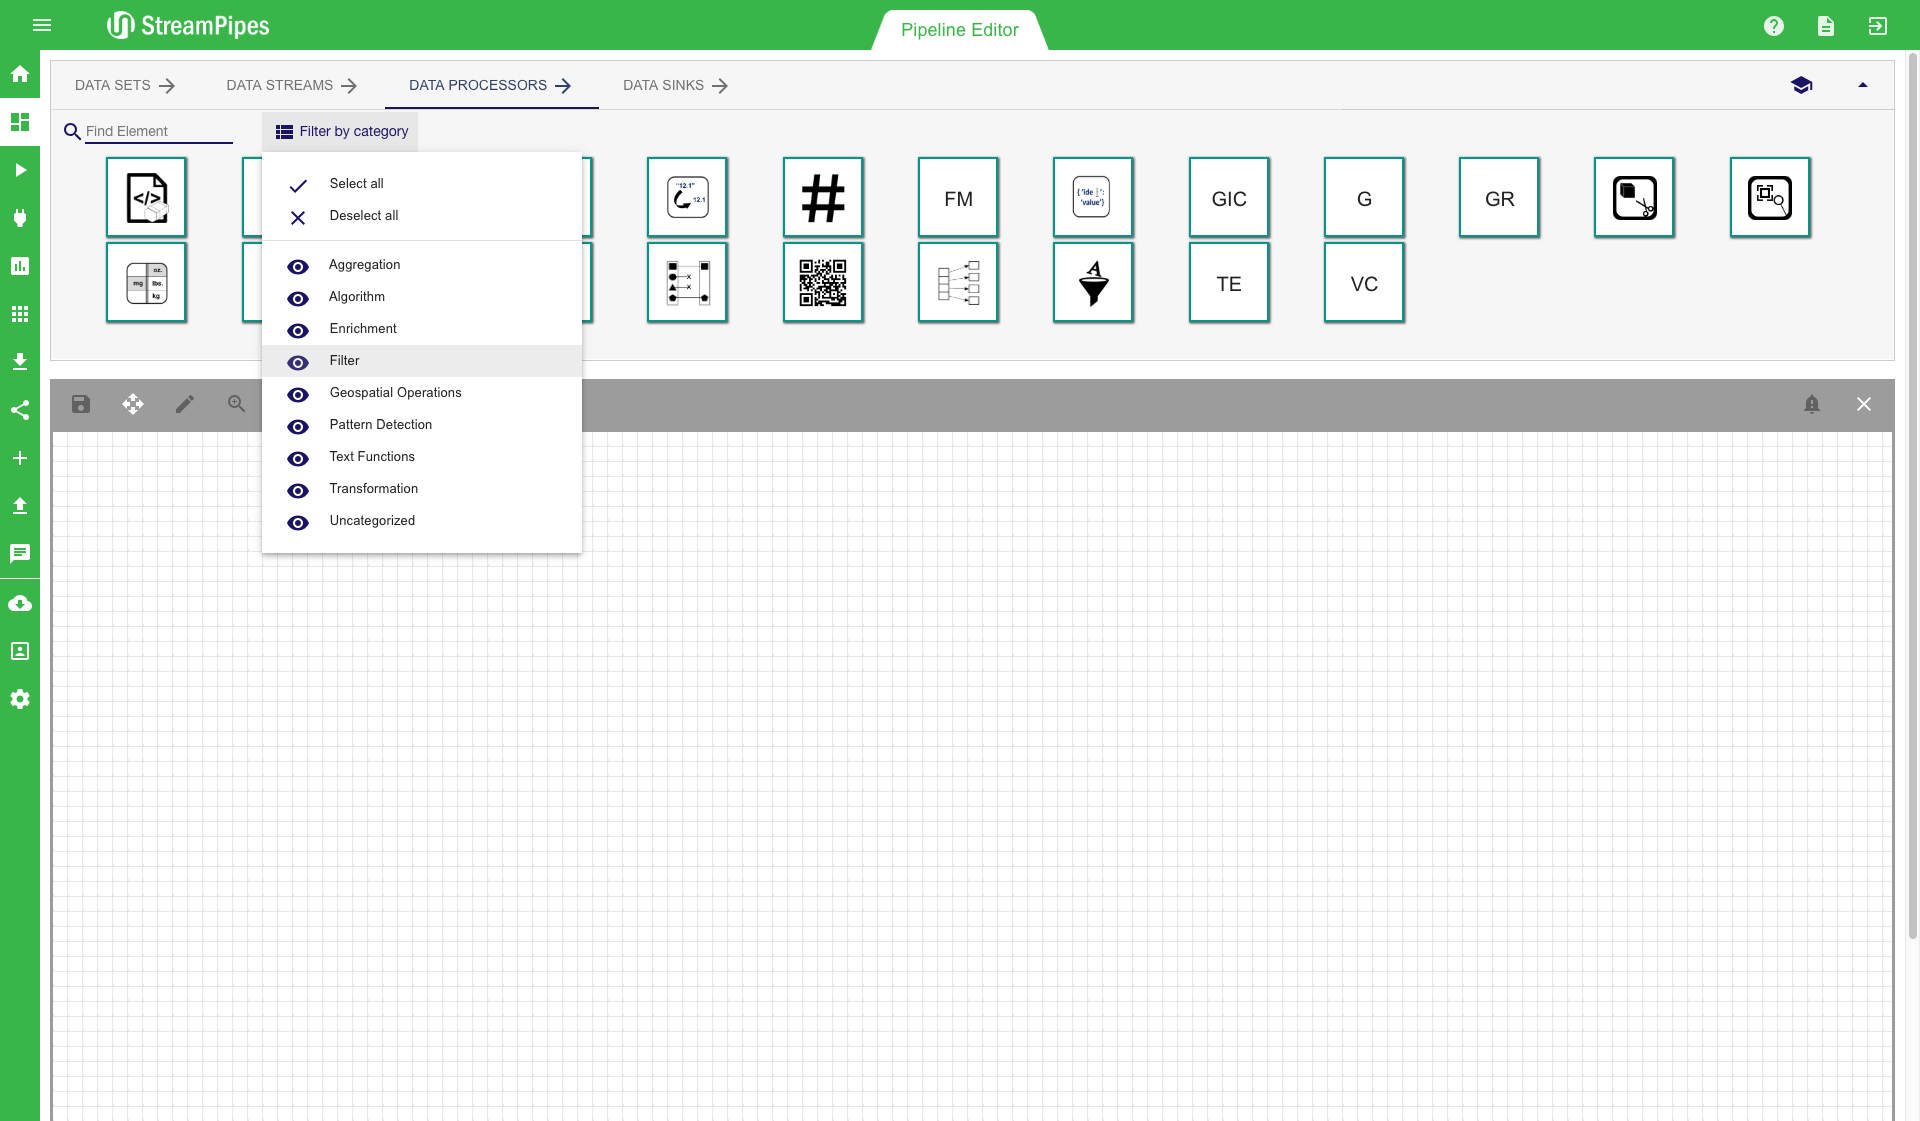
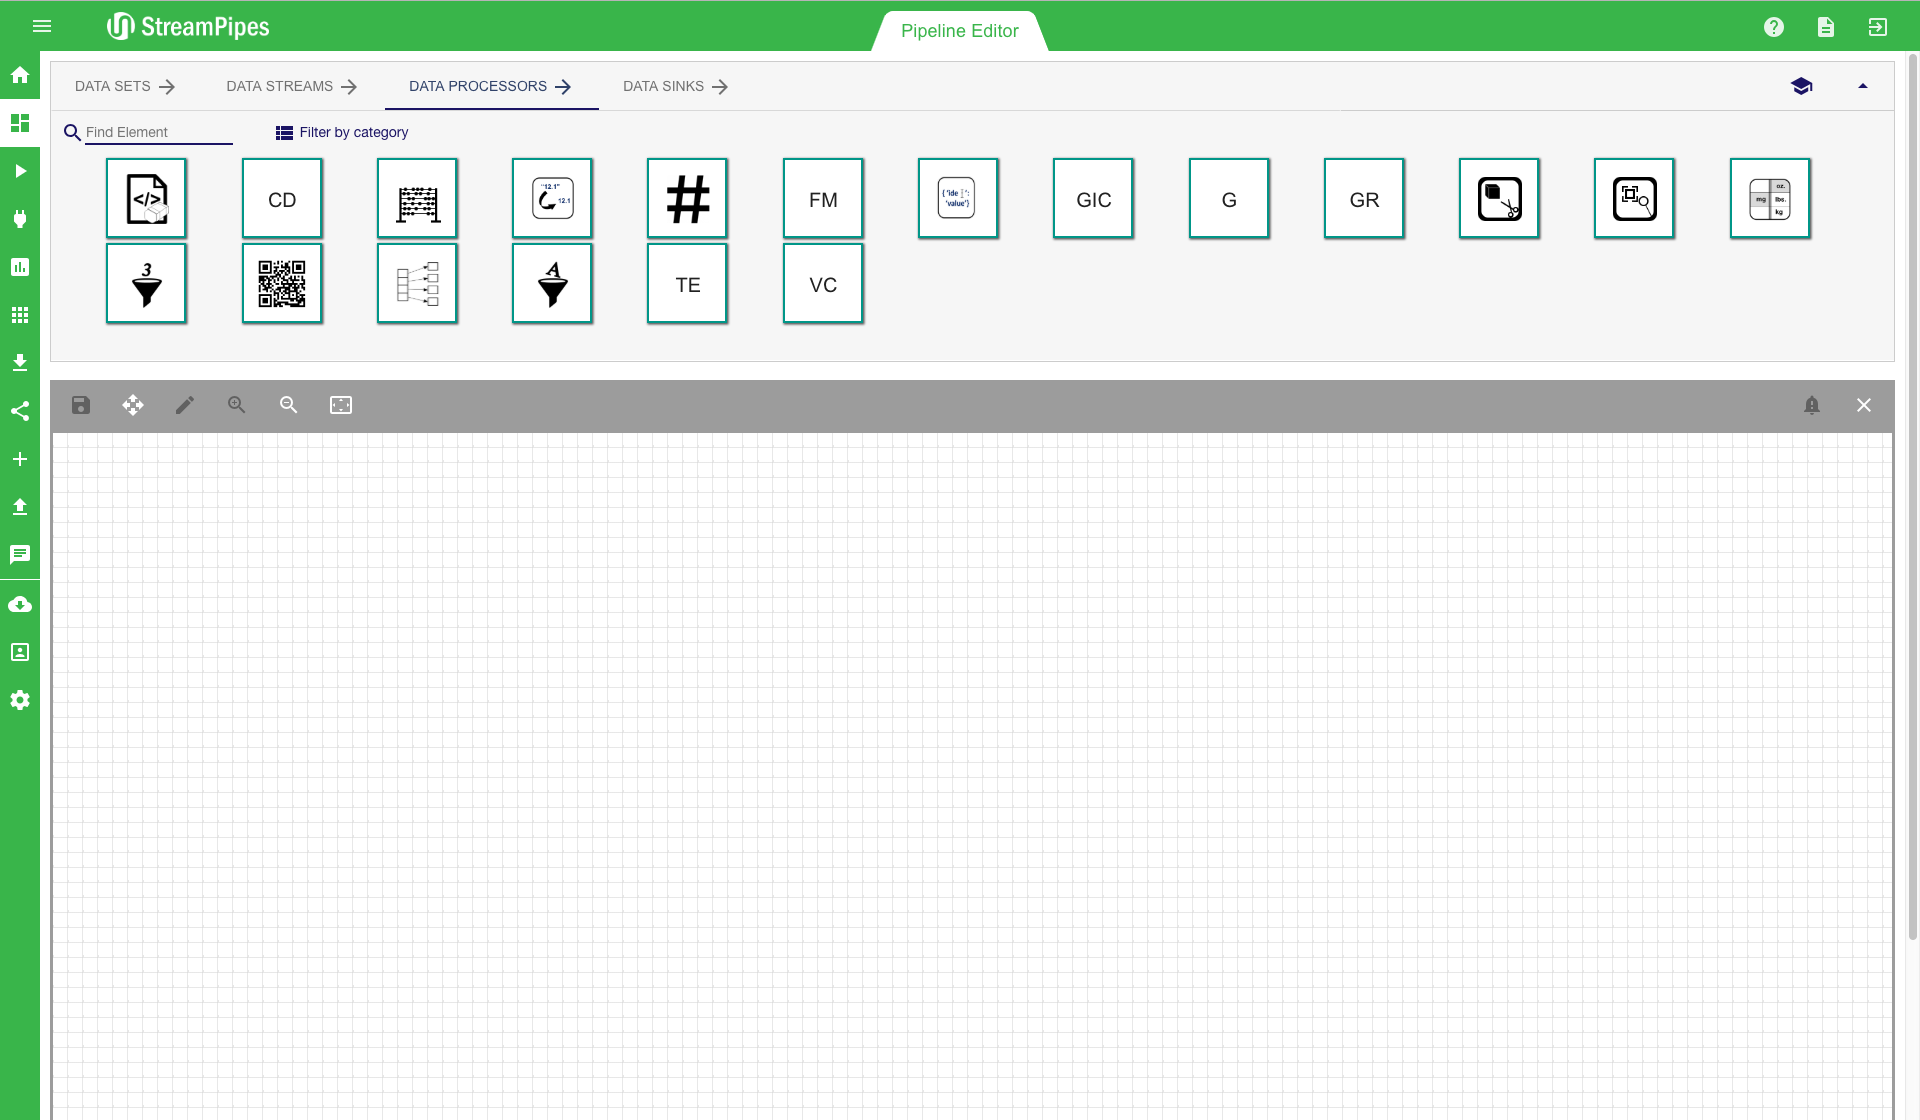
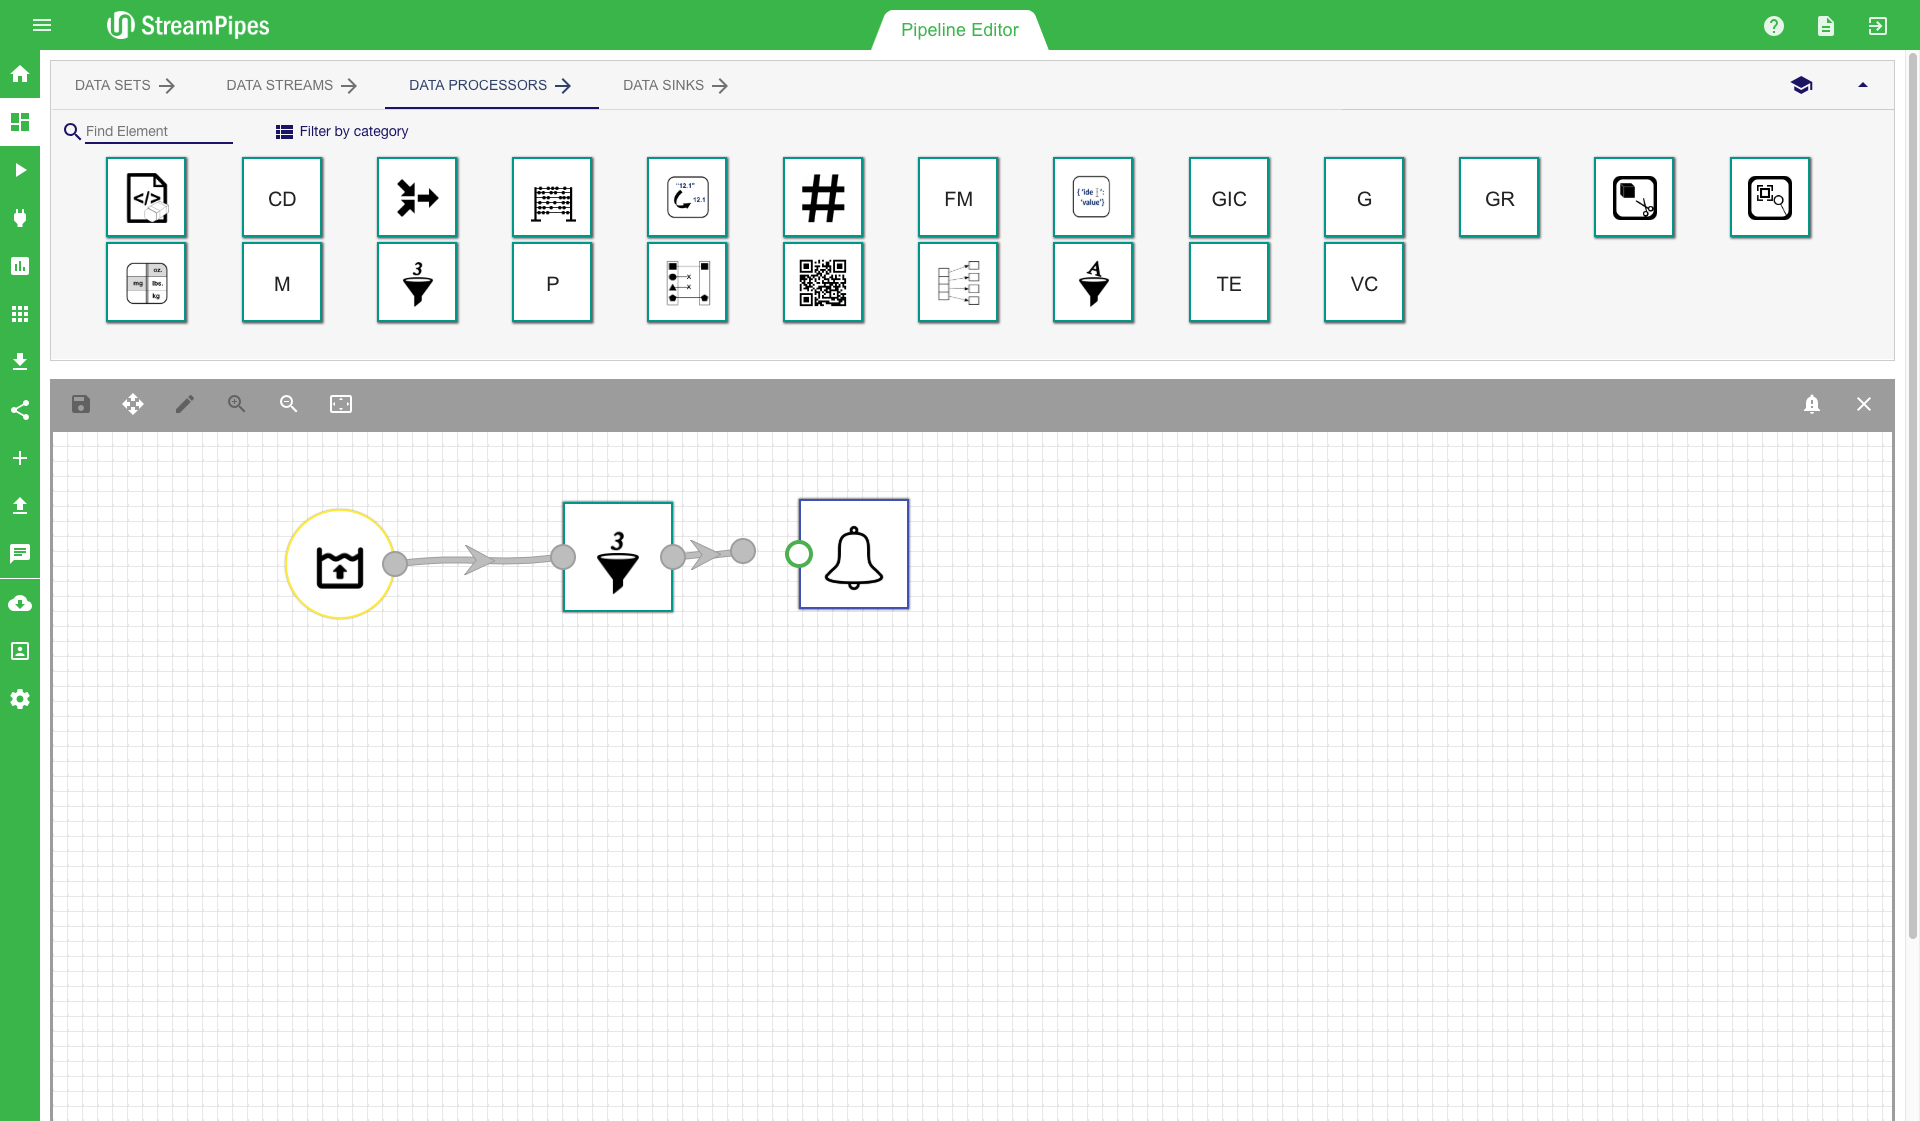
On the top we can see four tabs: Data Sets, Data Streams, Processing Elements, and Data Sinks. Each tab contains multiple pipeline elements, which can be installed at runtime. The installation of pipeline elements is explained later in section Install Pipeline Elements.
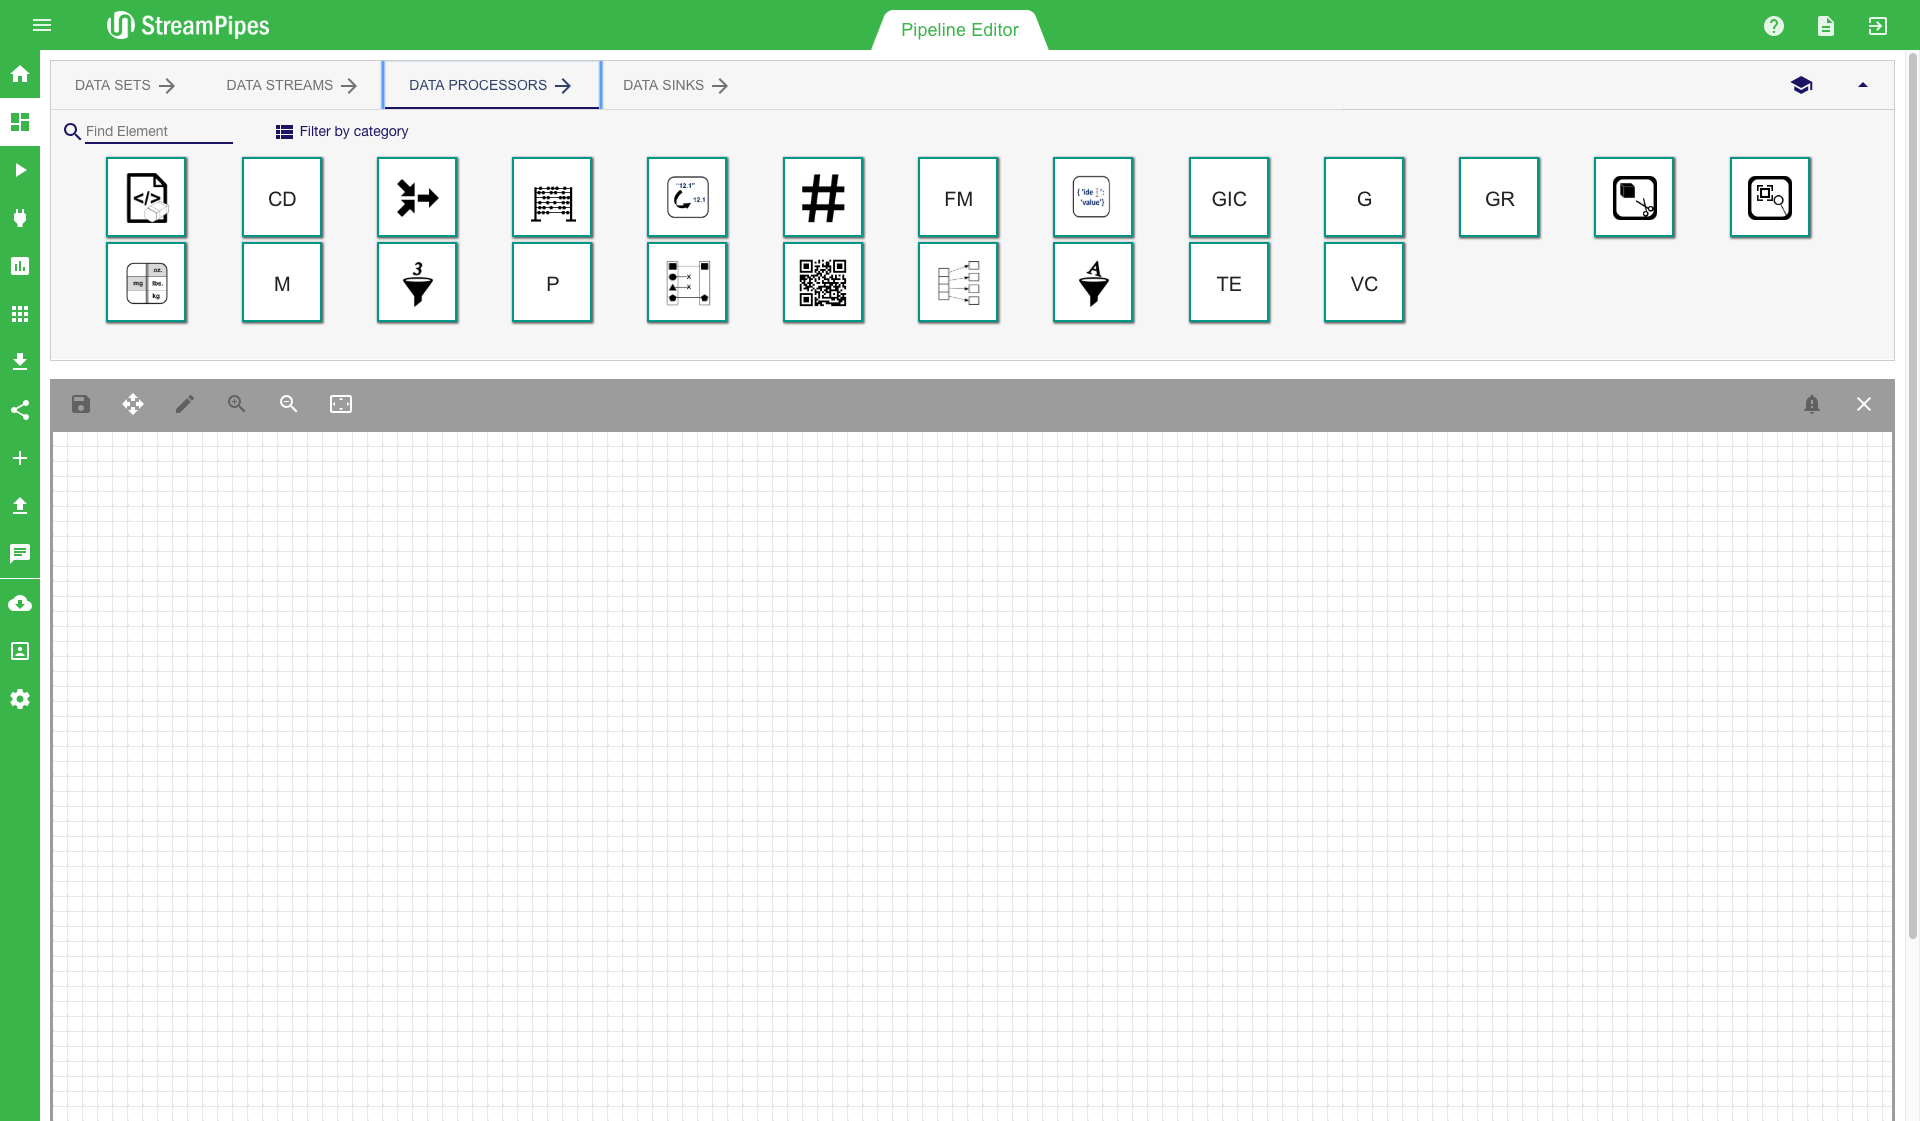
There are multiple ways to search for a pipeline element. The easiest way is to enter a search term in the search field on the top left corner. The system filters the elements according to the search term and only presents the relevant ones. Another way is to select one of the categories from the drop down menu. The system then filters the elements according to the selected category. The category of an element is defined by its functionality.
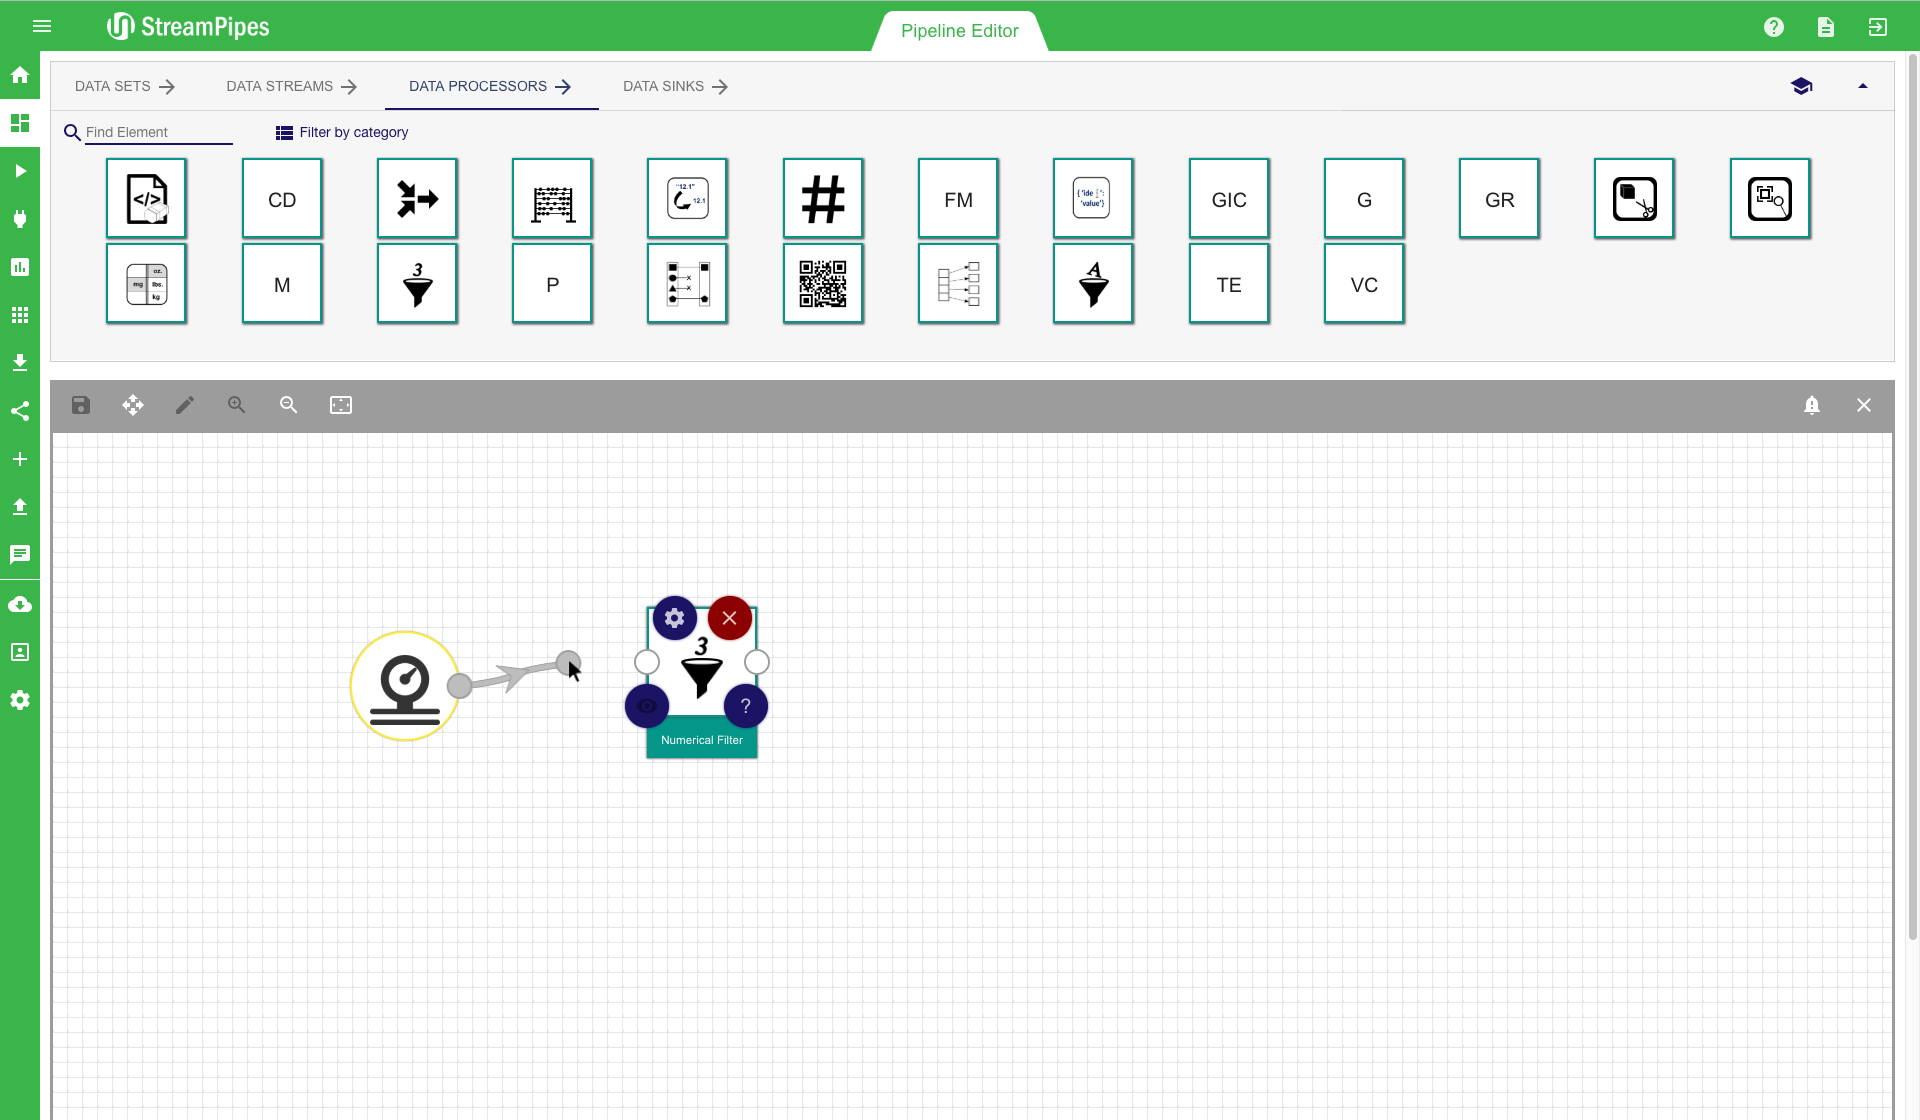
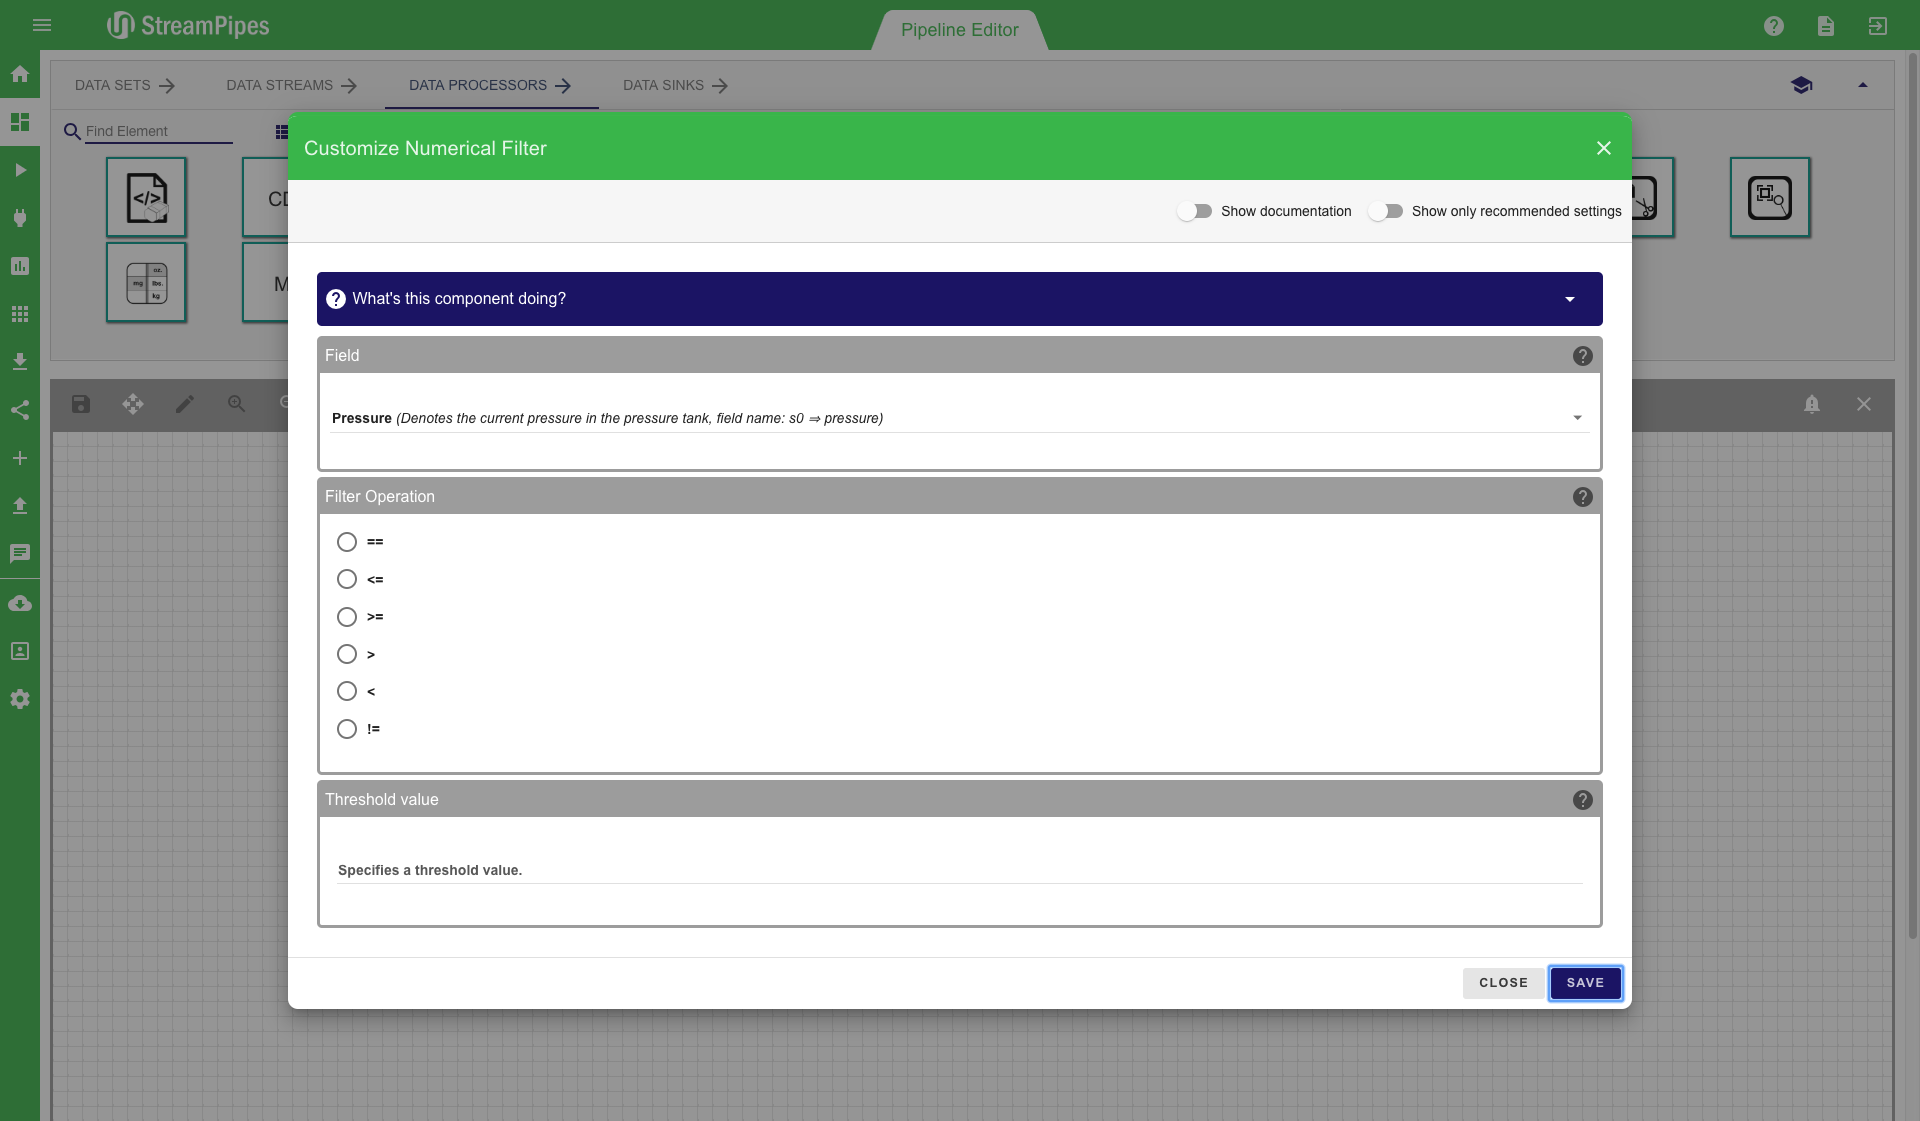
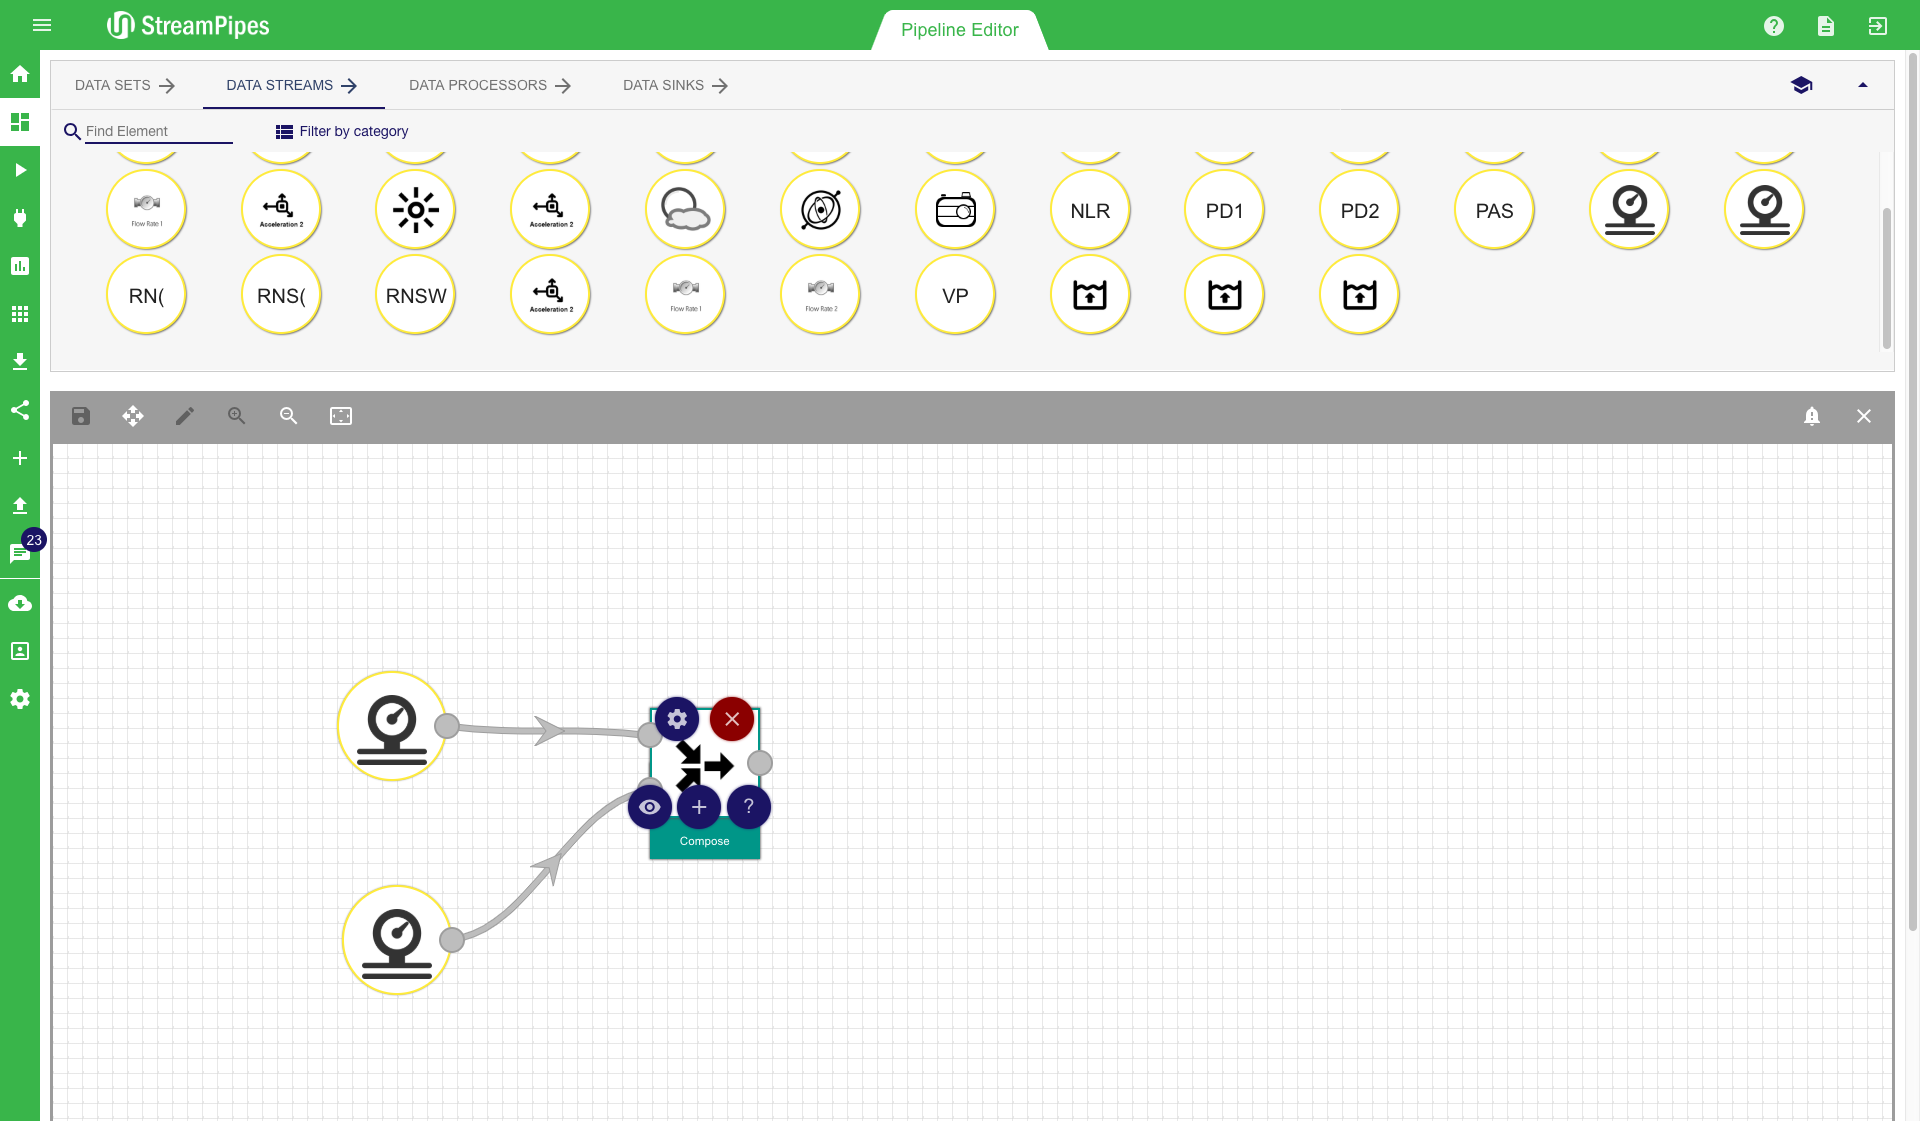
Modelling of a pipeline starts with choosing one ore more data sources. Therefore a data stream or data set must be selected and moved into the editor via drag and drop. After adding a data stream, we can select a processing element to transform the events of the data stream. This is done again by dragging the processing element icon into our editor. The mouse can be used to connect the two elements. It is automatically checked in the background if the two elements are semantically compatible. If this check is successful, a configuration menu is shown. It contains the parameters that can be modified by the user. For all parameters, a description is provided and the system also prevents the user from entering parameters that are not correct, according to the semantic description of the element. It is also ensured that all required parameters are provided by the user, otherwise an error message is displayed.
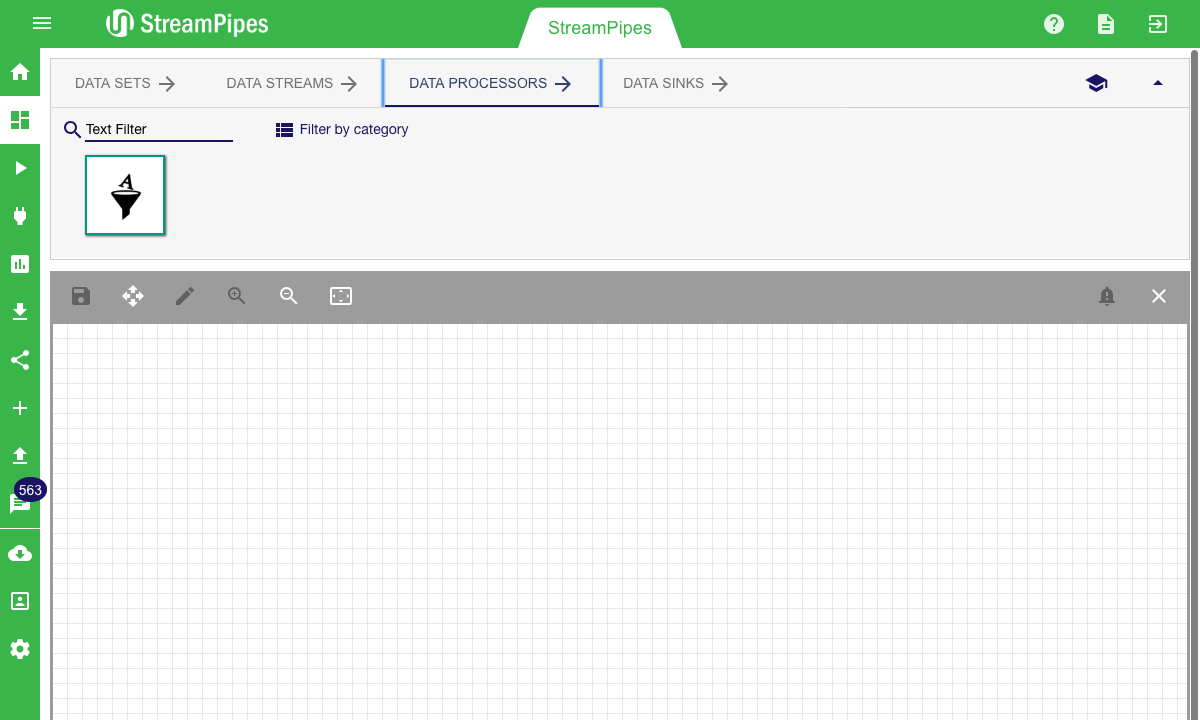
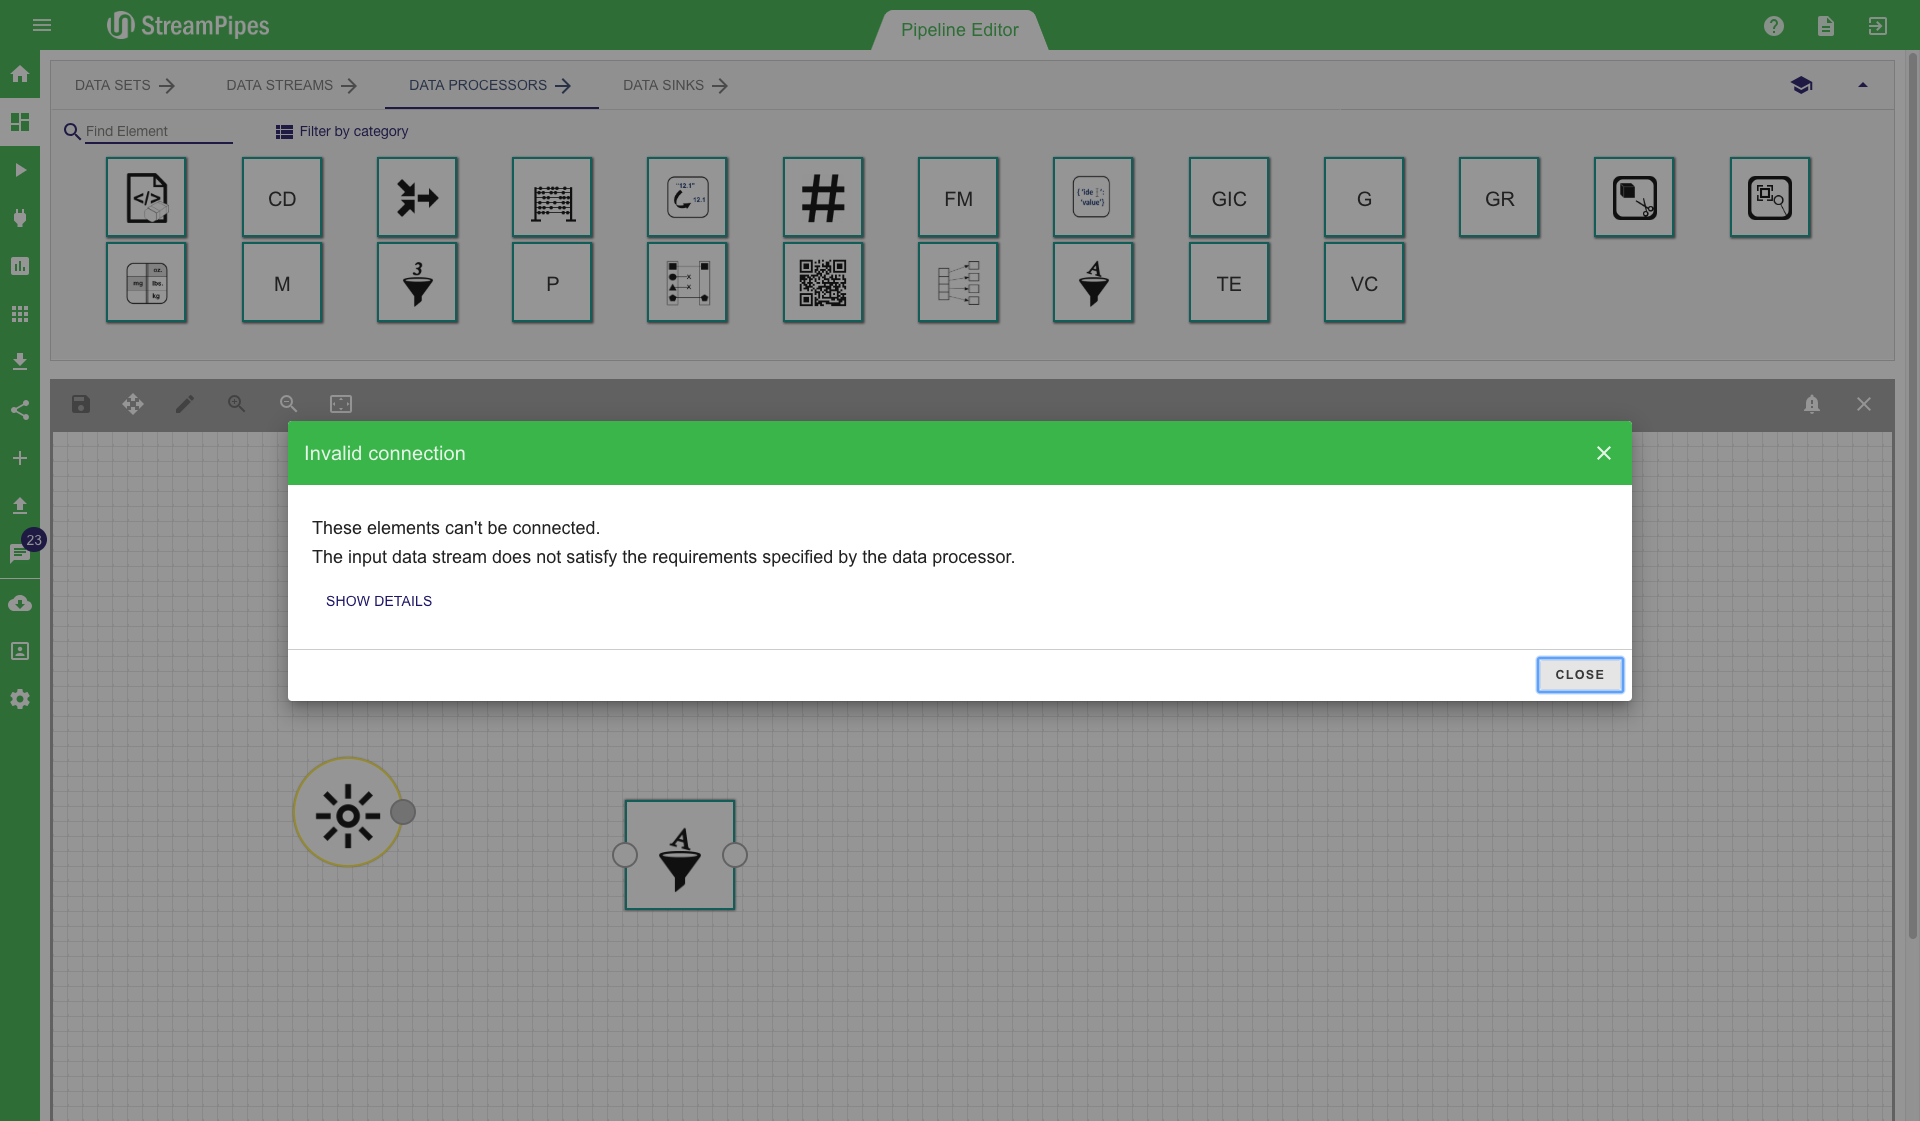
When the user tries to connect two elements that are not compatible, the system shows a connection error message. The example illustrated below shows such a case. The user tried to connect a text filter to a light sensor. This is not possible since the text filter processing element requires at least one event property of type string, which is not provided by the light sensor.
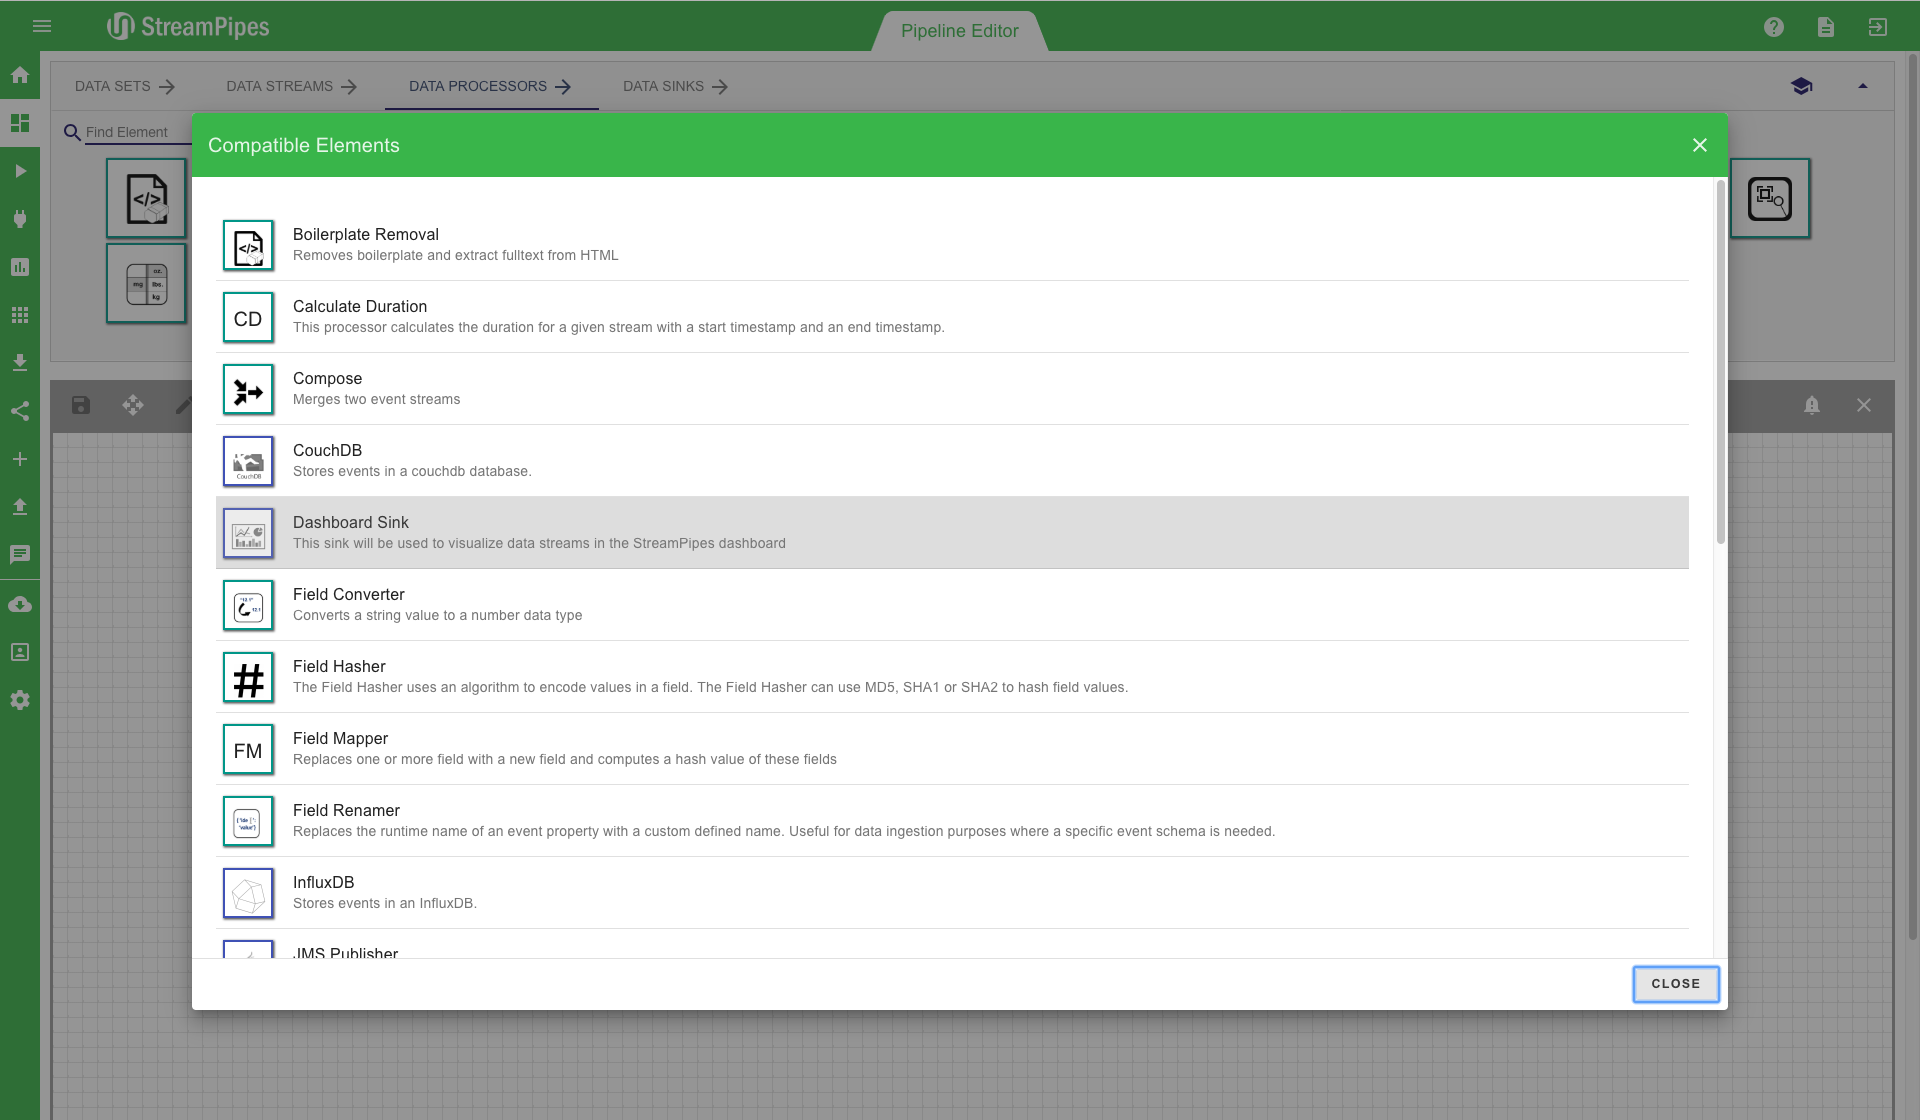
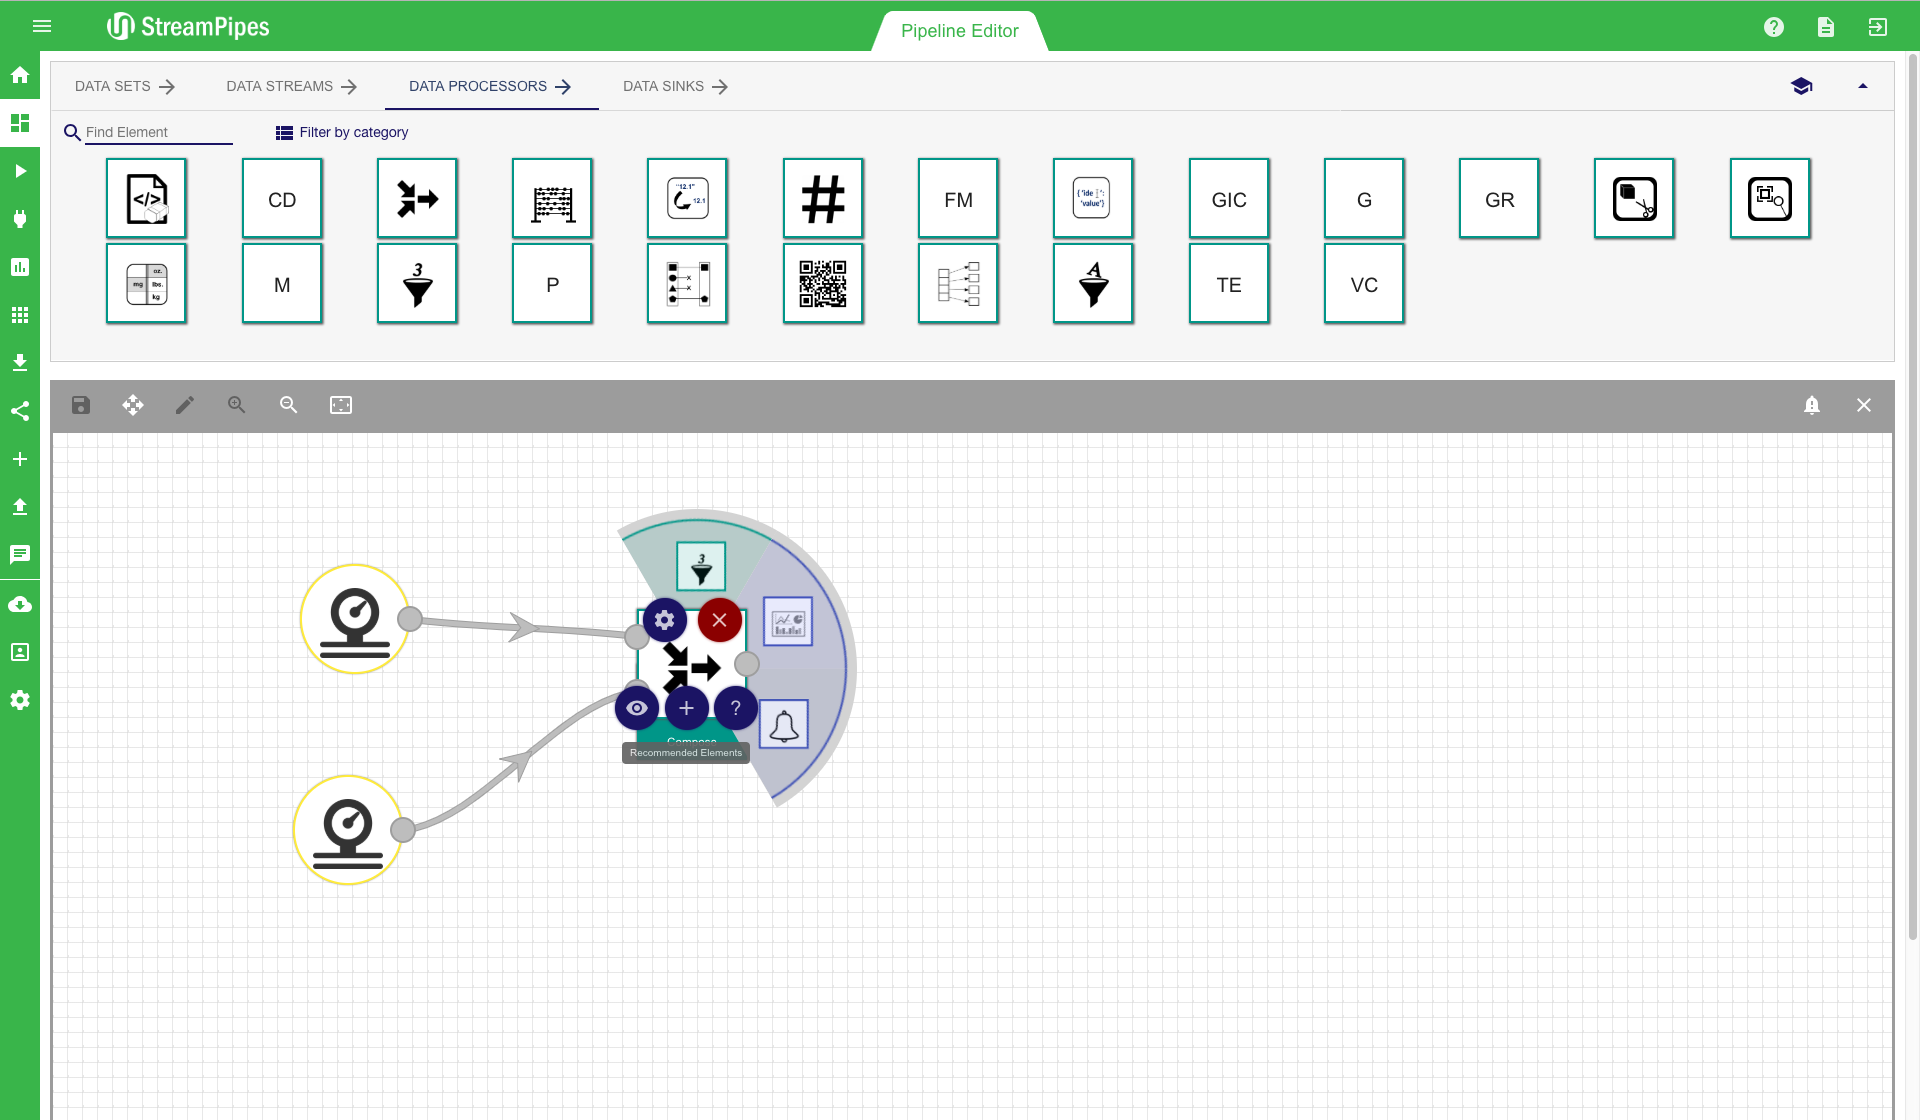
To further improve the usability, multiple ways are available to connect new elements besides the drag and drop option. Each processing element has multiple short-cut buttons to connect it with another element. The first one (eye icon) can be used to get a suggestion of all elements that are compatible with the current element. The second one (plus icon) gives a recommendation on the elements the user might want to connect, based on the usage of the component in other pipelines. There is also a button (question tag icon) to open the documentation of a selected element. Elements can be deleted by clicking the 'delete' button. Each element can also be re-configured at a later point in time using the configuration button. There is one important aspect about re-configuration of pipeline elements you need to be aware of: Only elements that are not yet connected to another element can be modified. The reason for this behaviour is that some of the following elements might rely on the configuration of previous elements. This way it is ensured that the user can not change the behaviour of the pipeline by accident.
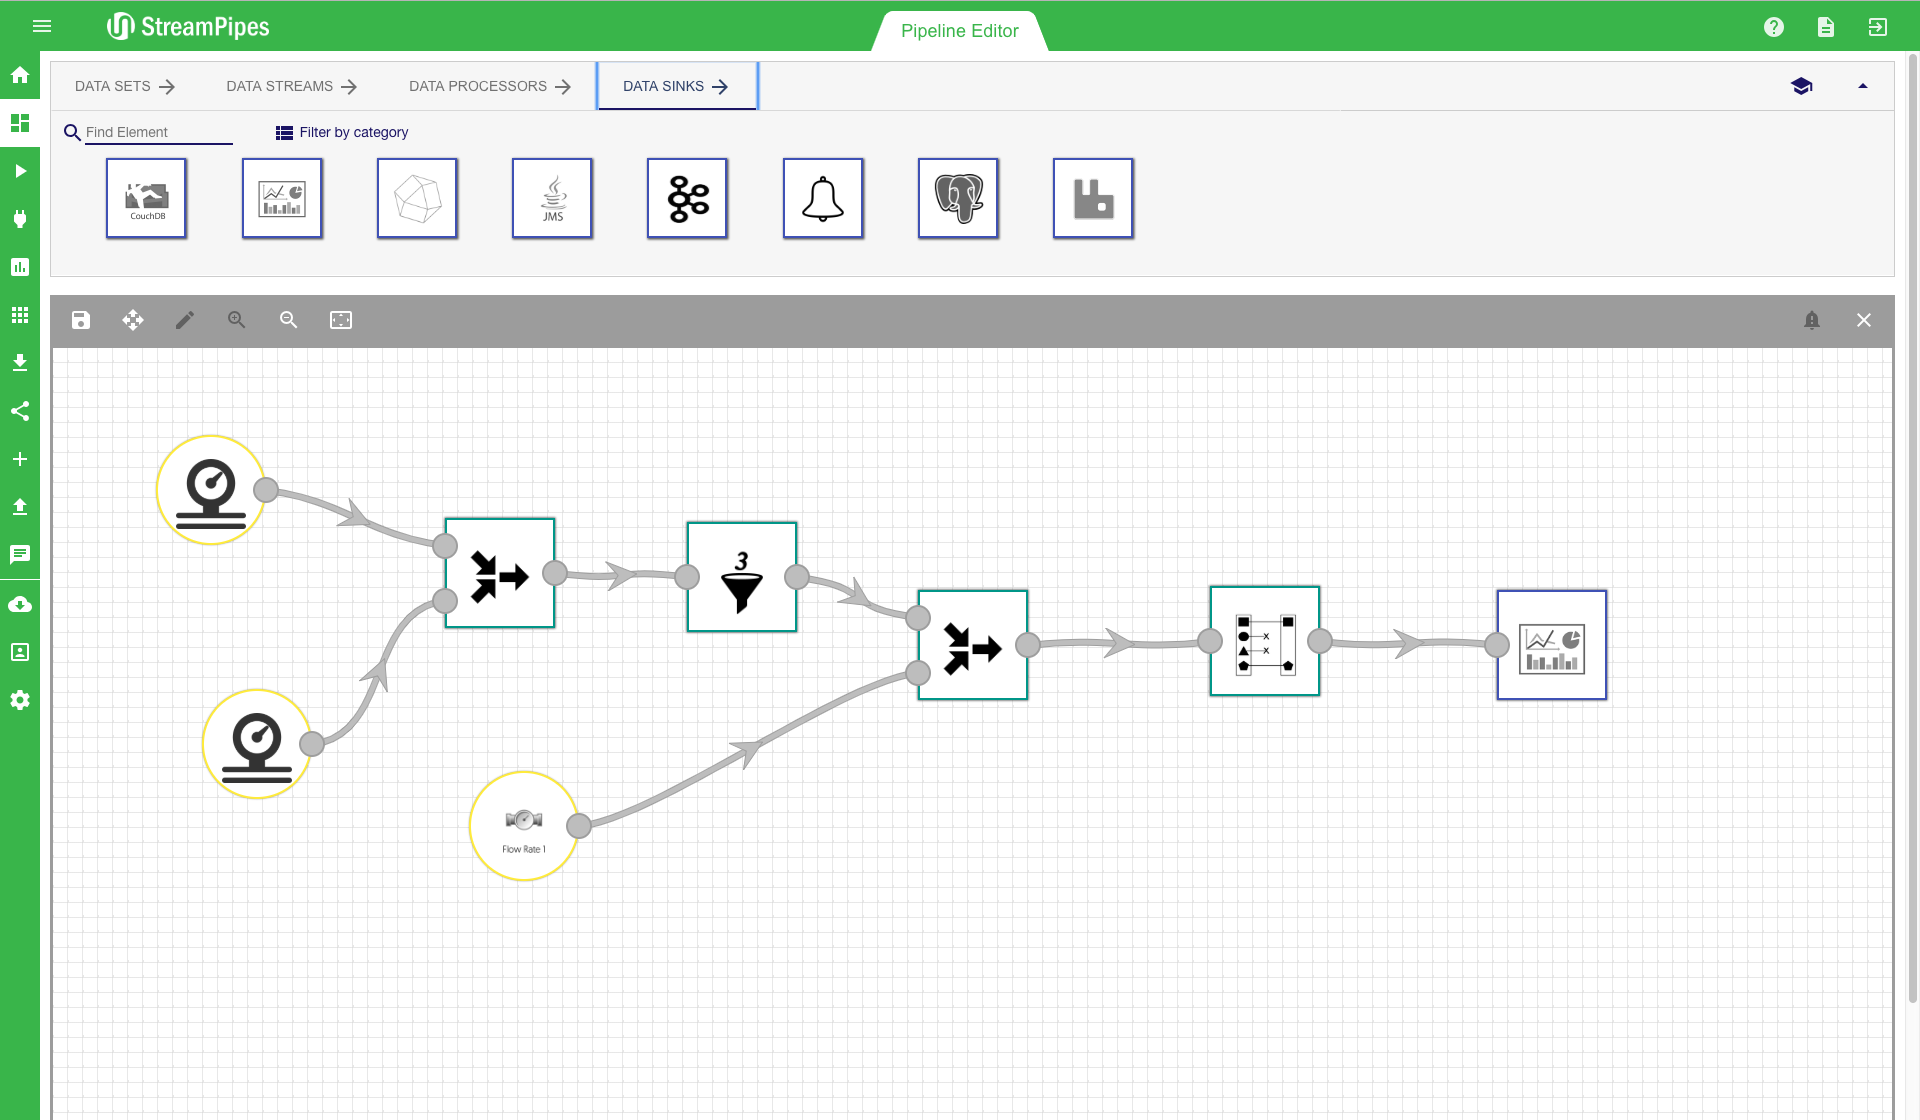
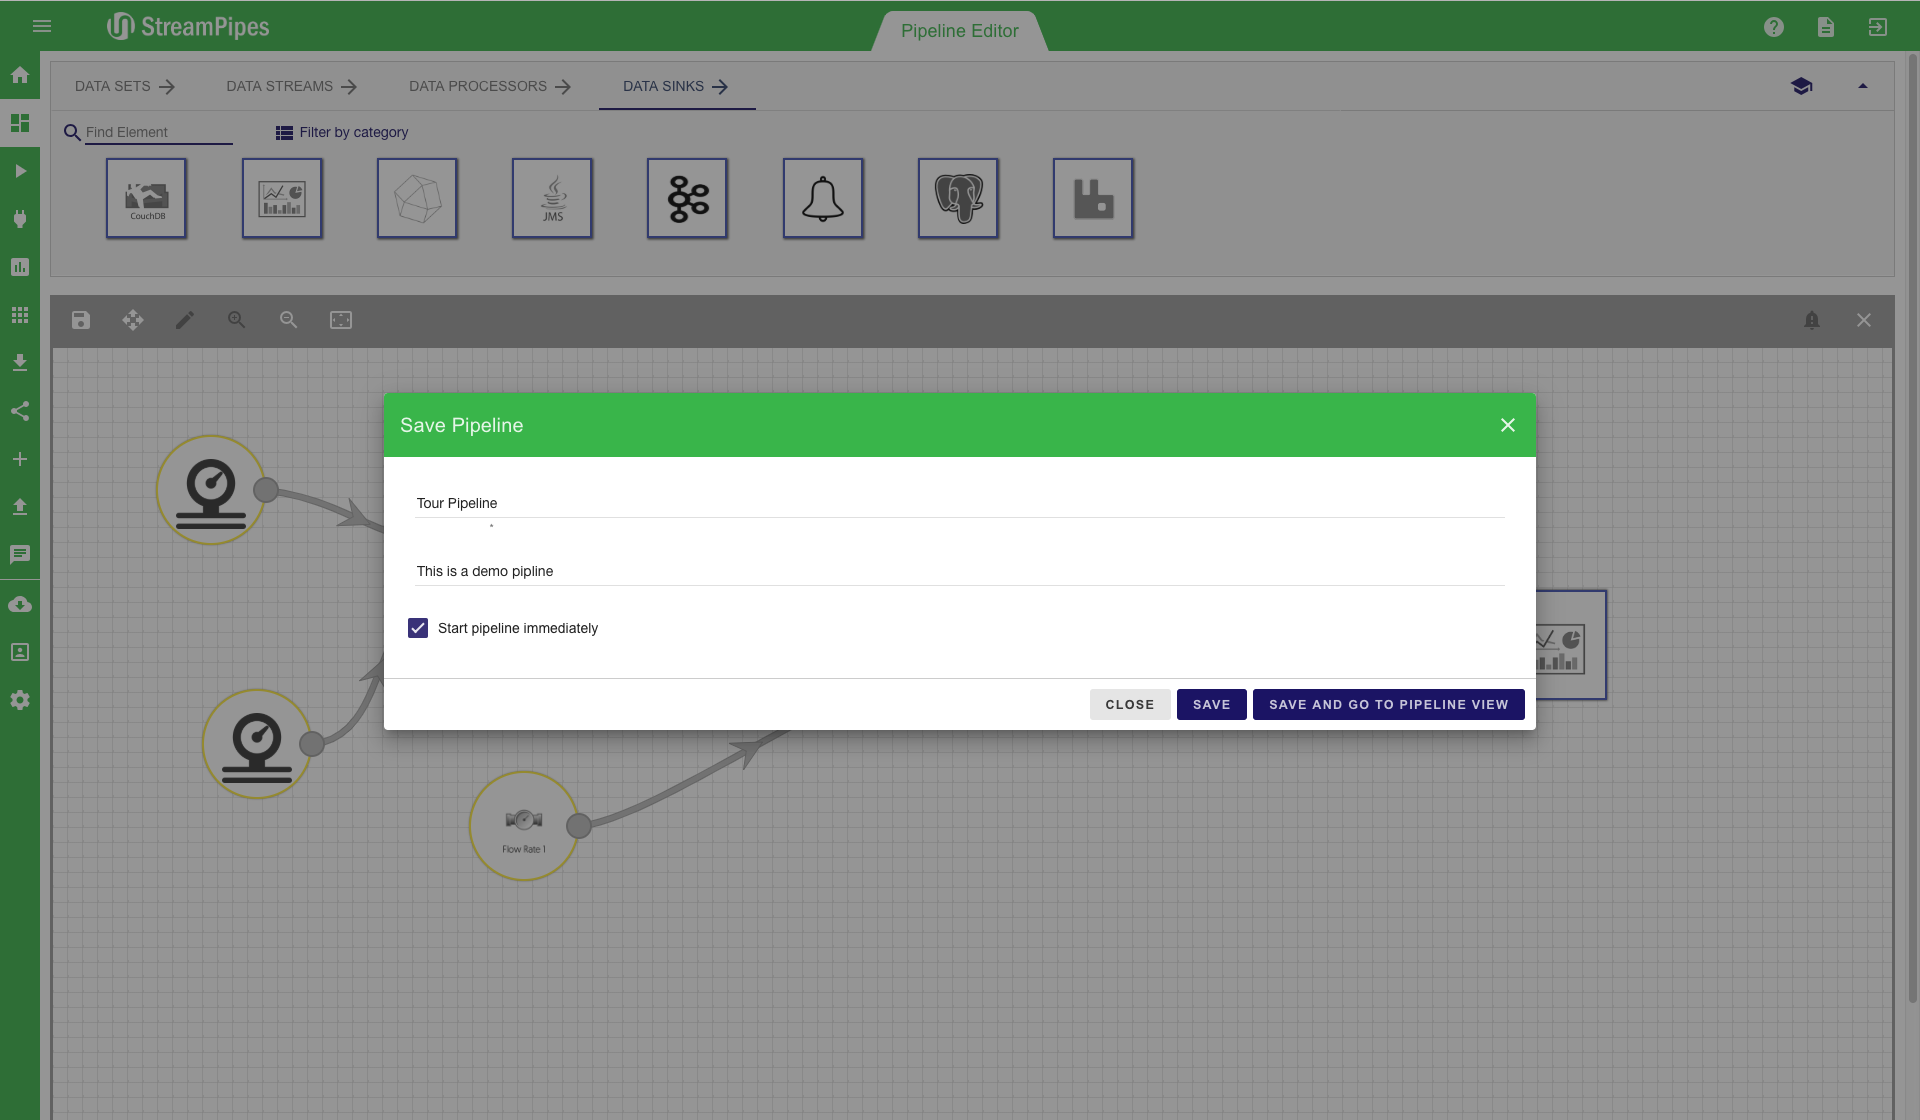
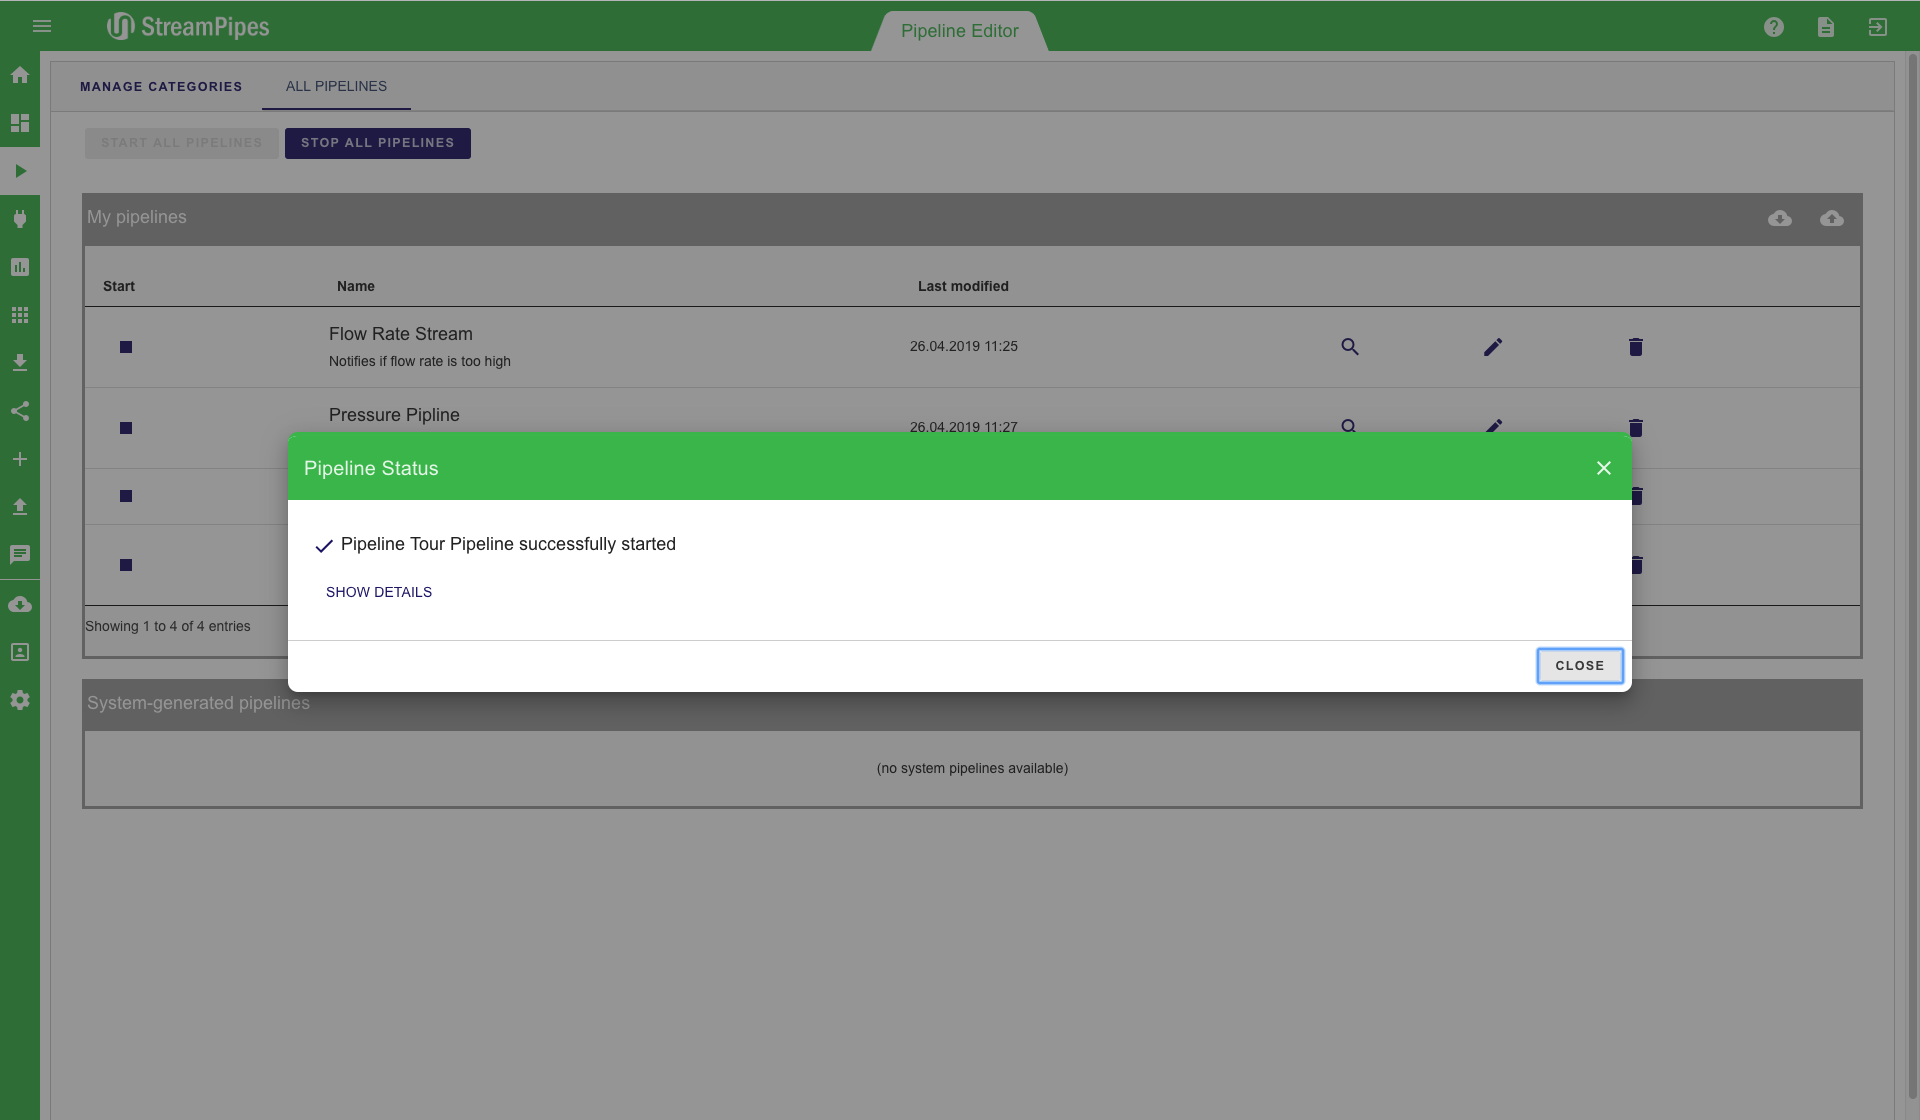
After the pipeline is completely modelled, the editor looks similar to the first image below. Especially for larger pipelines, the auto layout button in the editor menu might be helpful. With this button, the pipeline will be beautifully aligned in the editor, helping users to get a better overview of the complete pipeline. On the top left corner of the editor, the 'save' button can be found. After the modelling of the pipeline is done, use this button to save and execute the pipeline. A save dialogue pops up when clicking the save button. The pipeline title must be entered and an additional description can be provided. It is recommended to always provide a description, because it makes it easier for other users to understand the meaning of the pipeline. In the save menu, the user can either just store the pipeline configuration or store it and immediately start the pipeline. Once the pipeline is executed, the user is redirected to the Manage Pipeline view. In this view, the user gets immediate feedback whether all components did start correctly and the pipeline is up and running. This view also shows that individual elements might run in different environments on different servers. If there is an error during the execution, a notification containing a (hopefully) detailed error description is provided in this view.
Connect new Data Sources
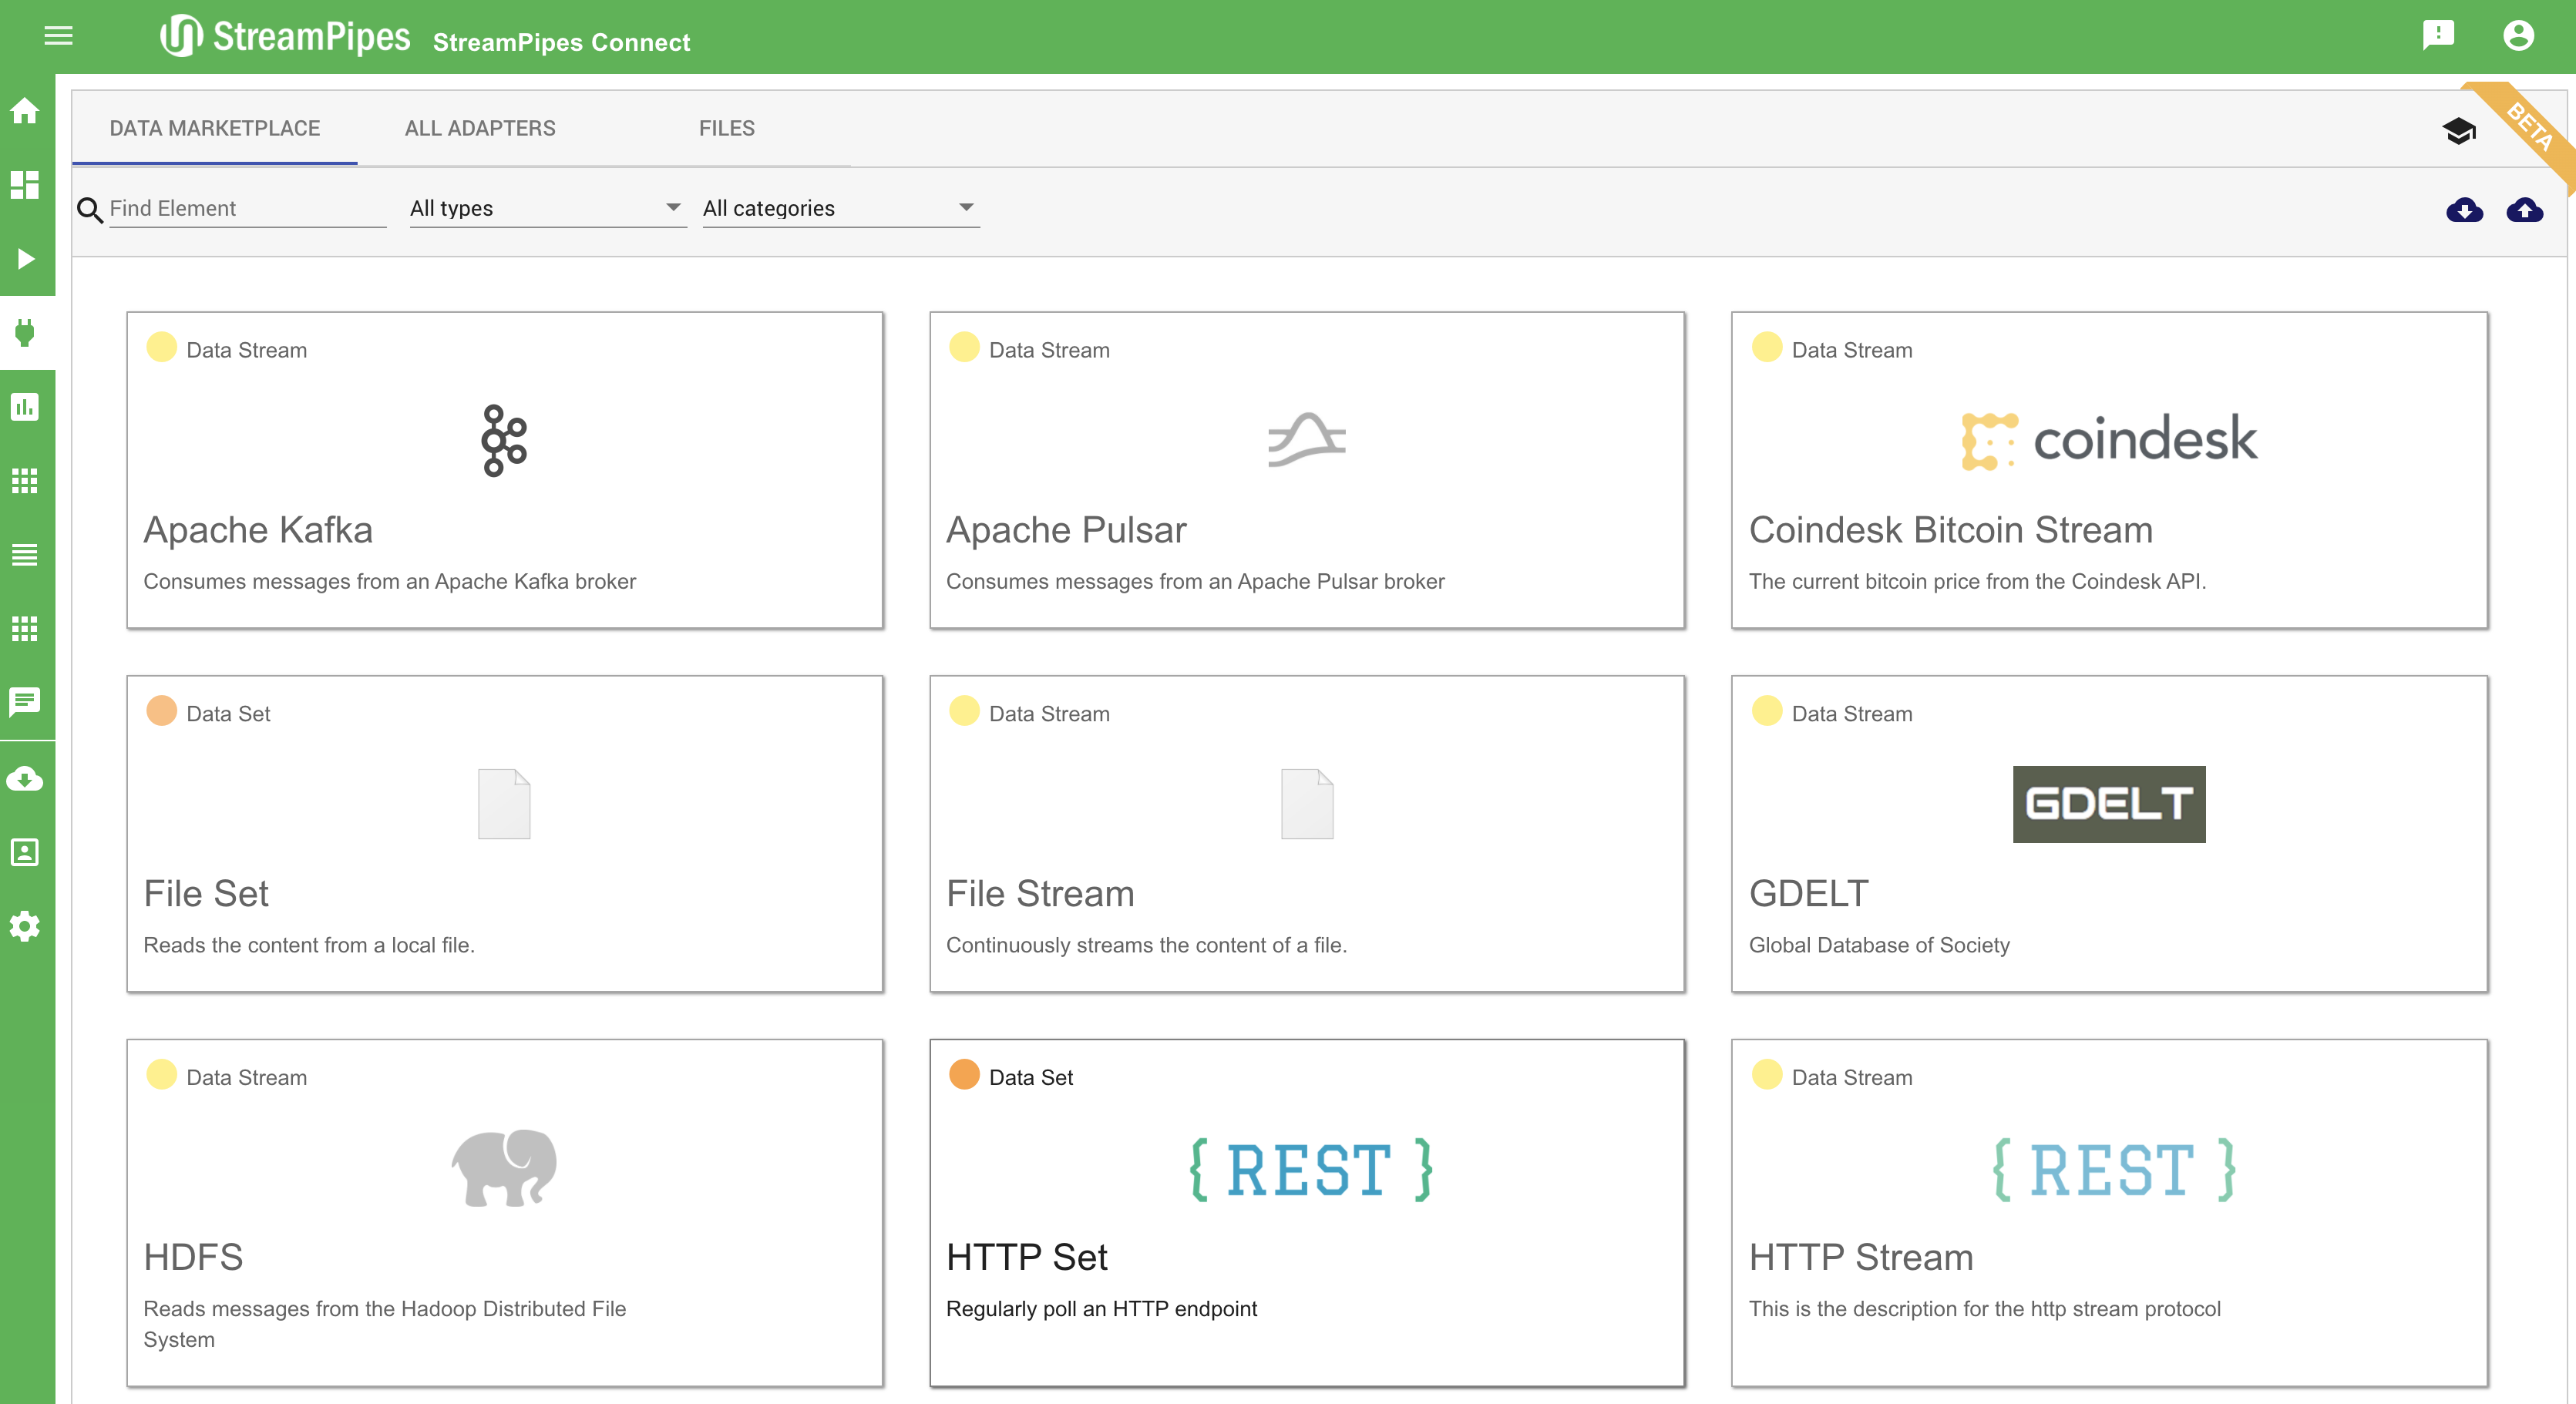
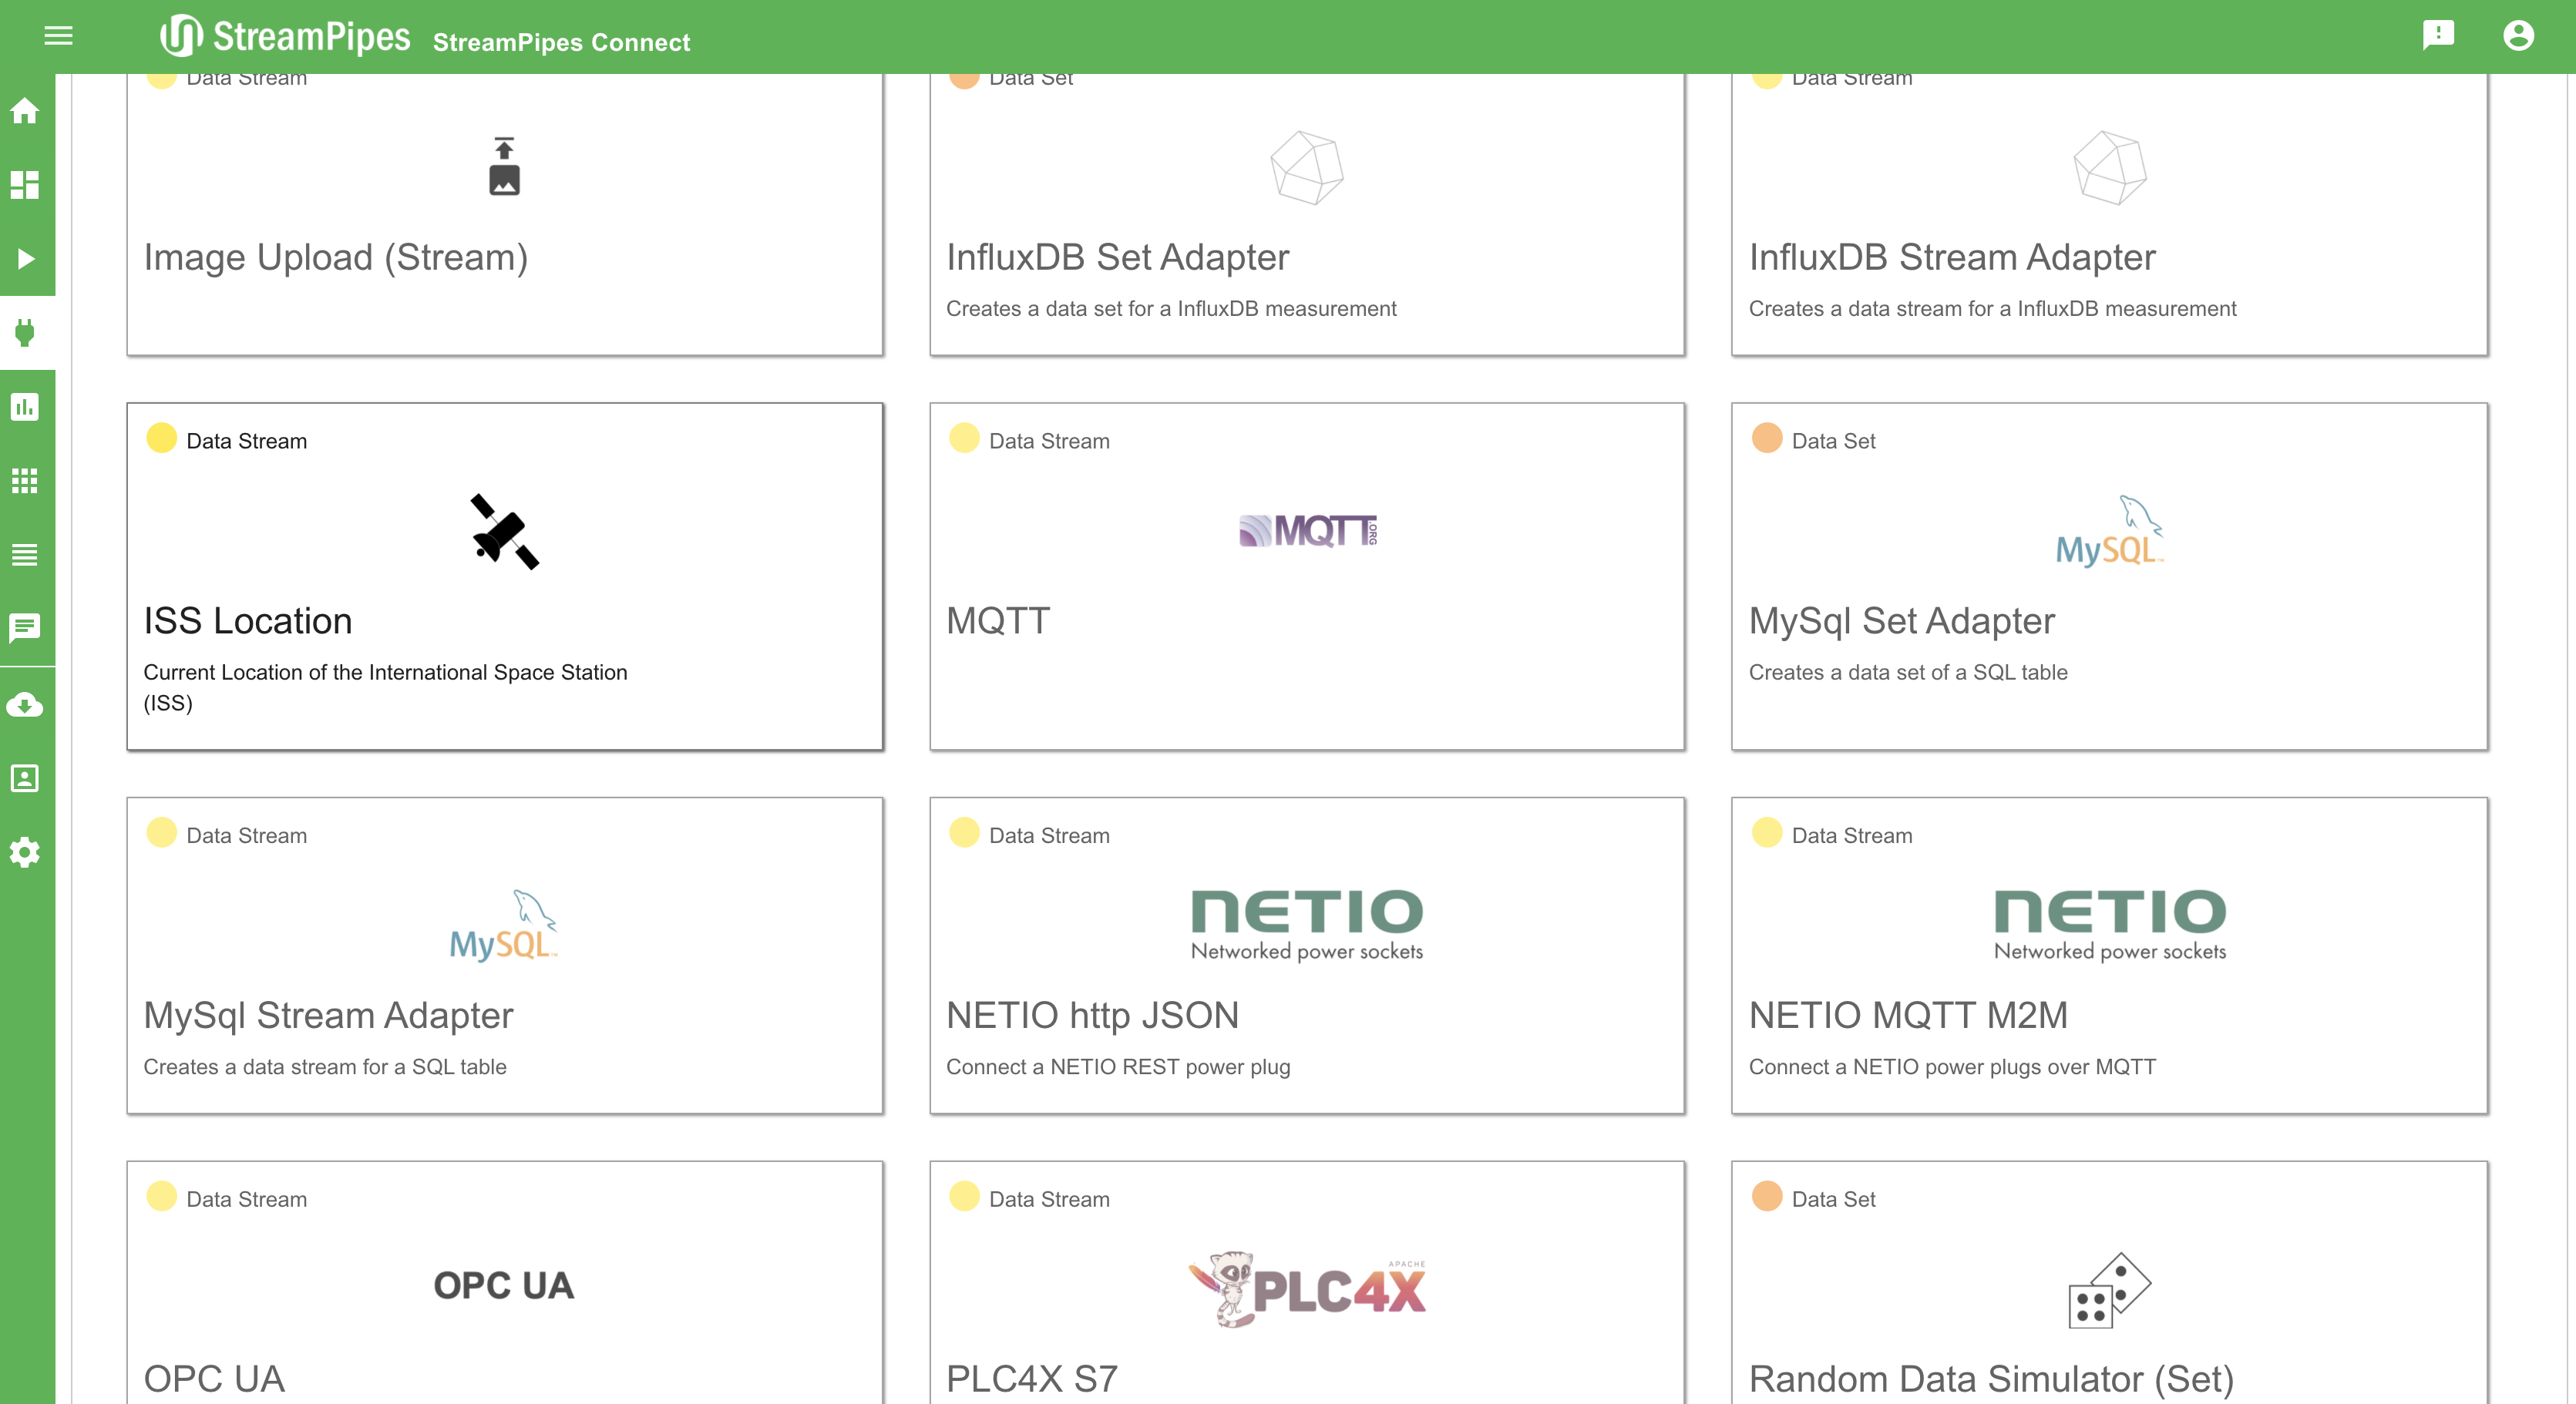
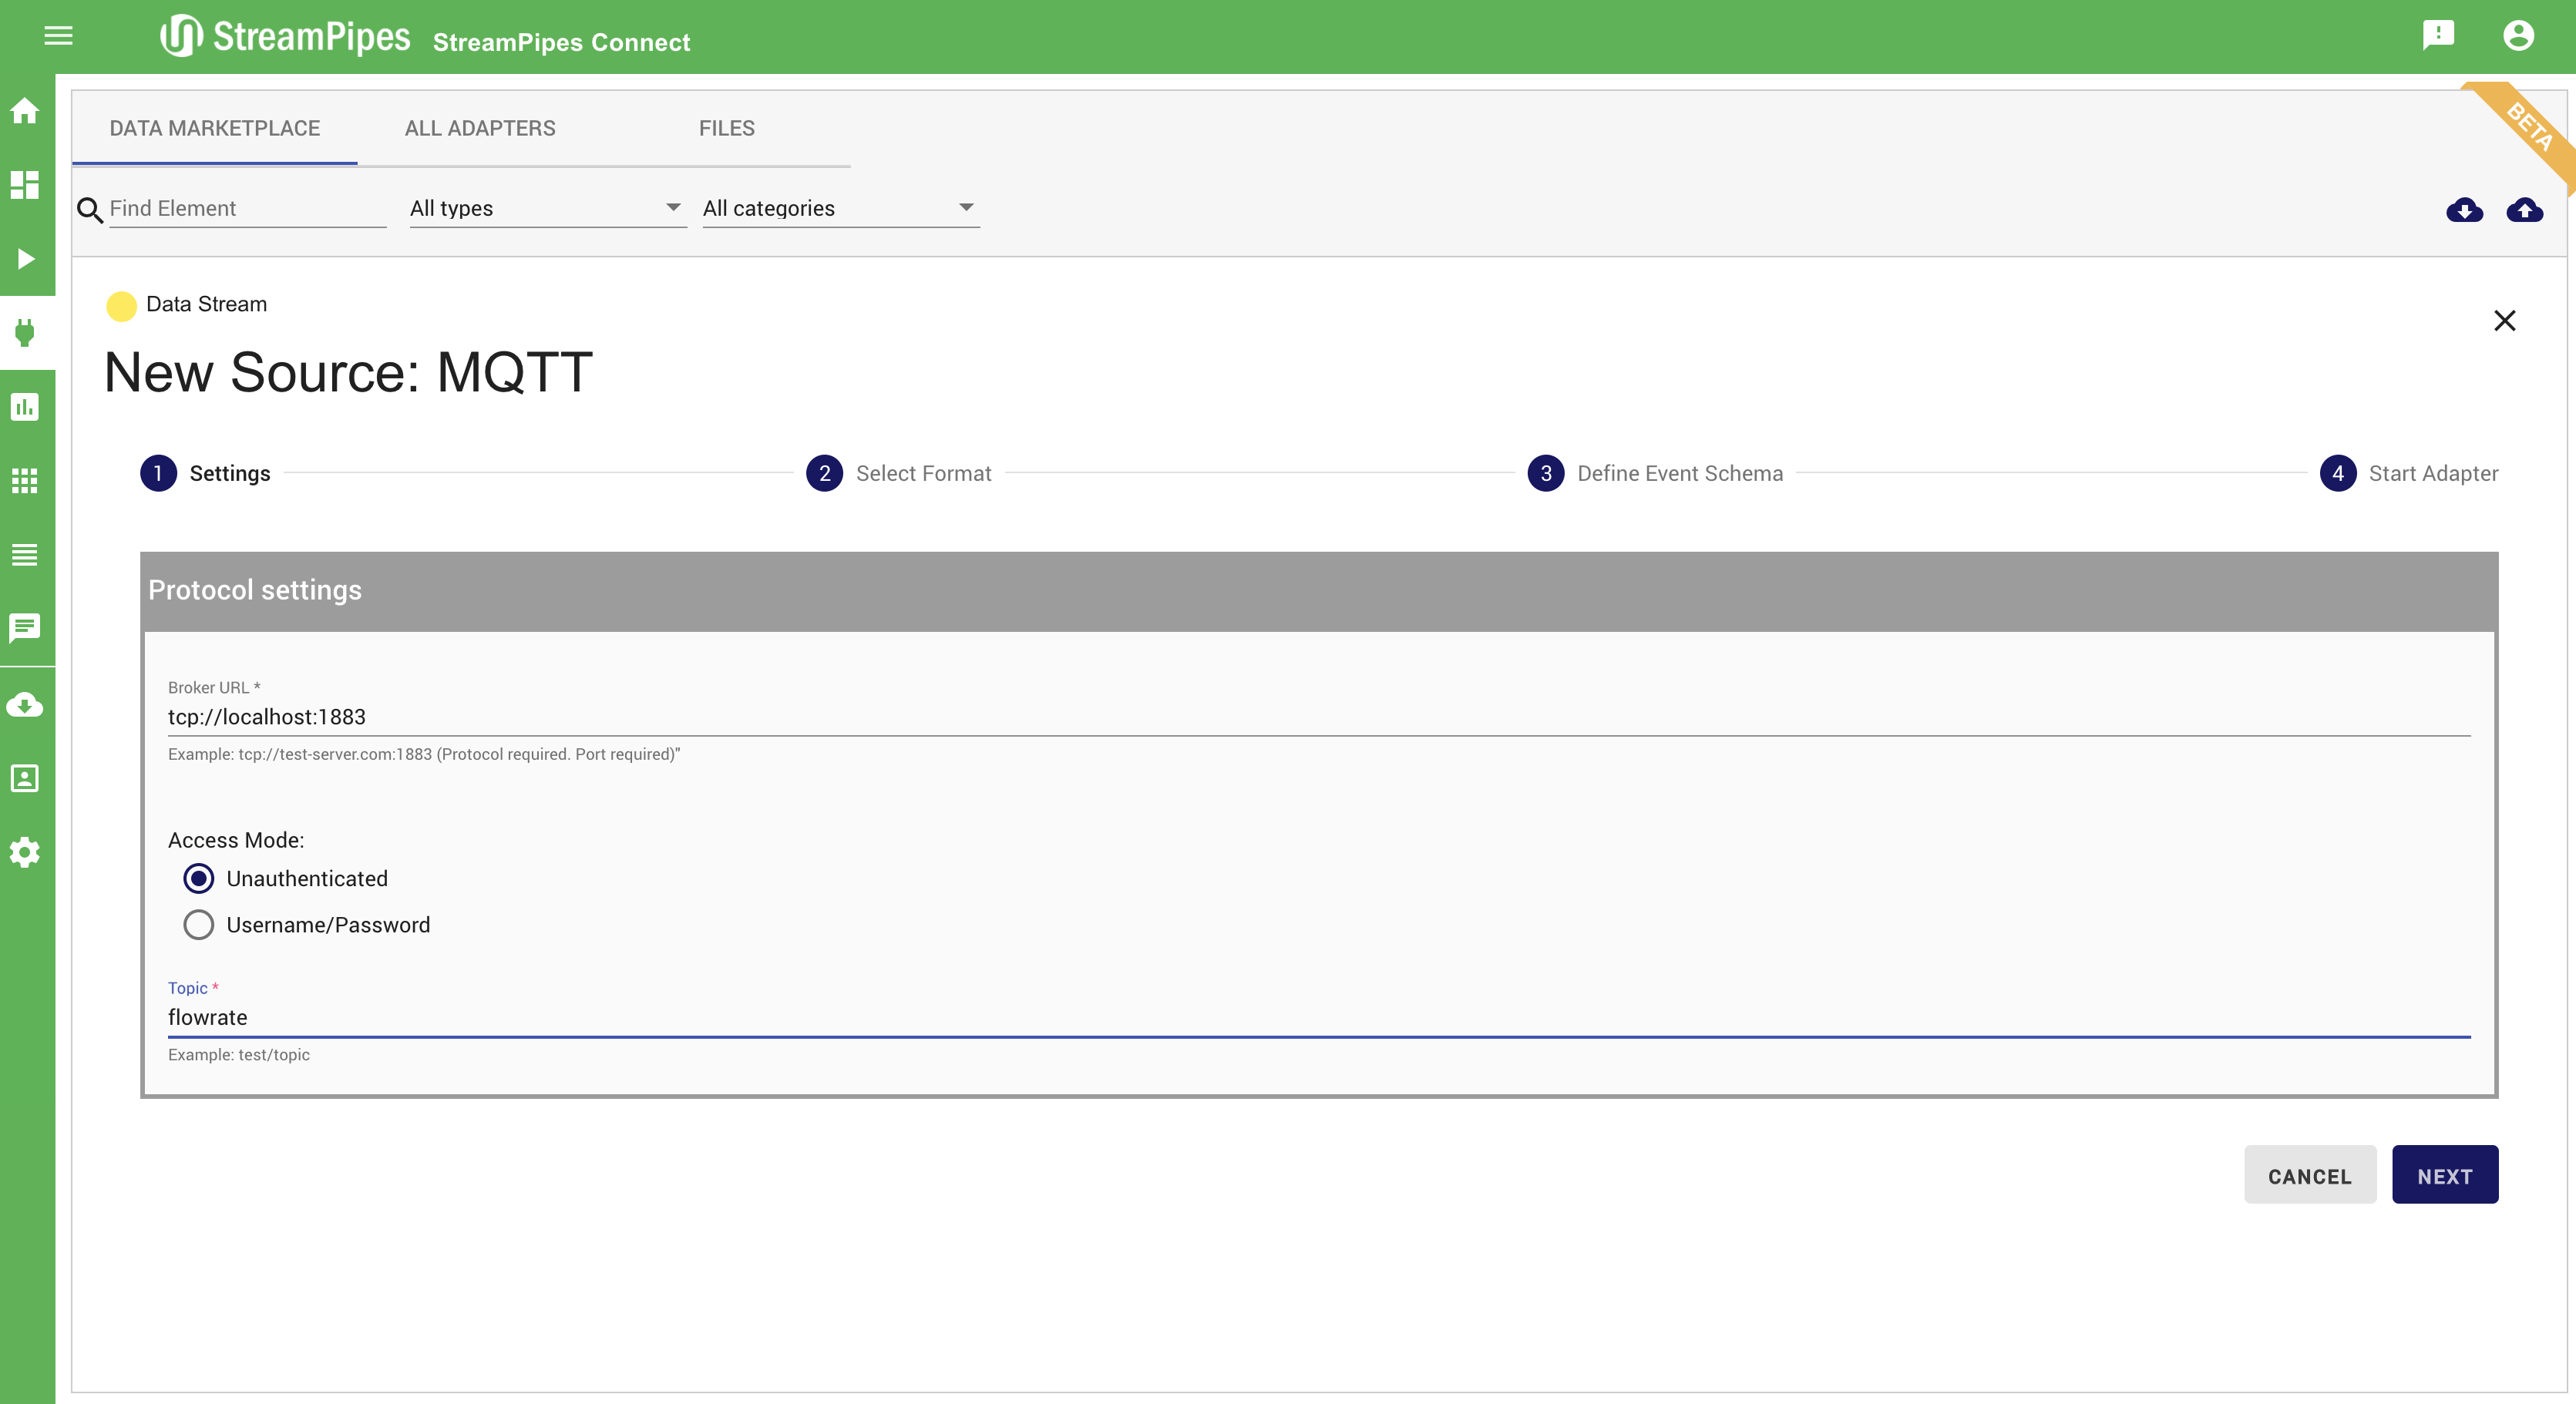
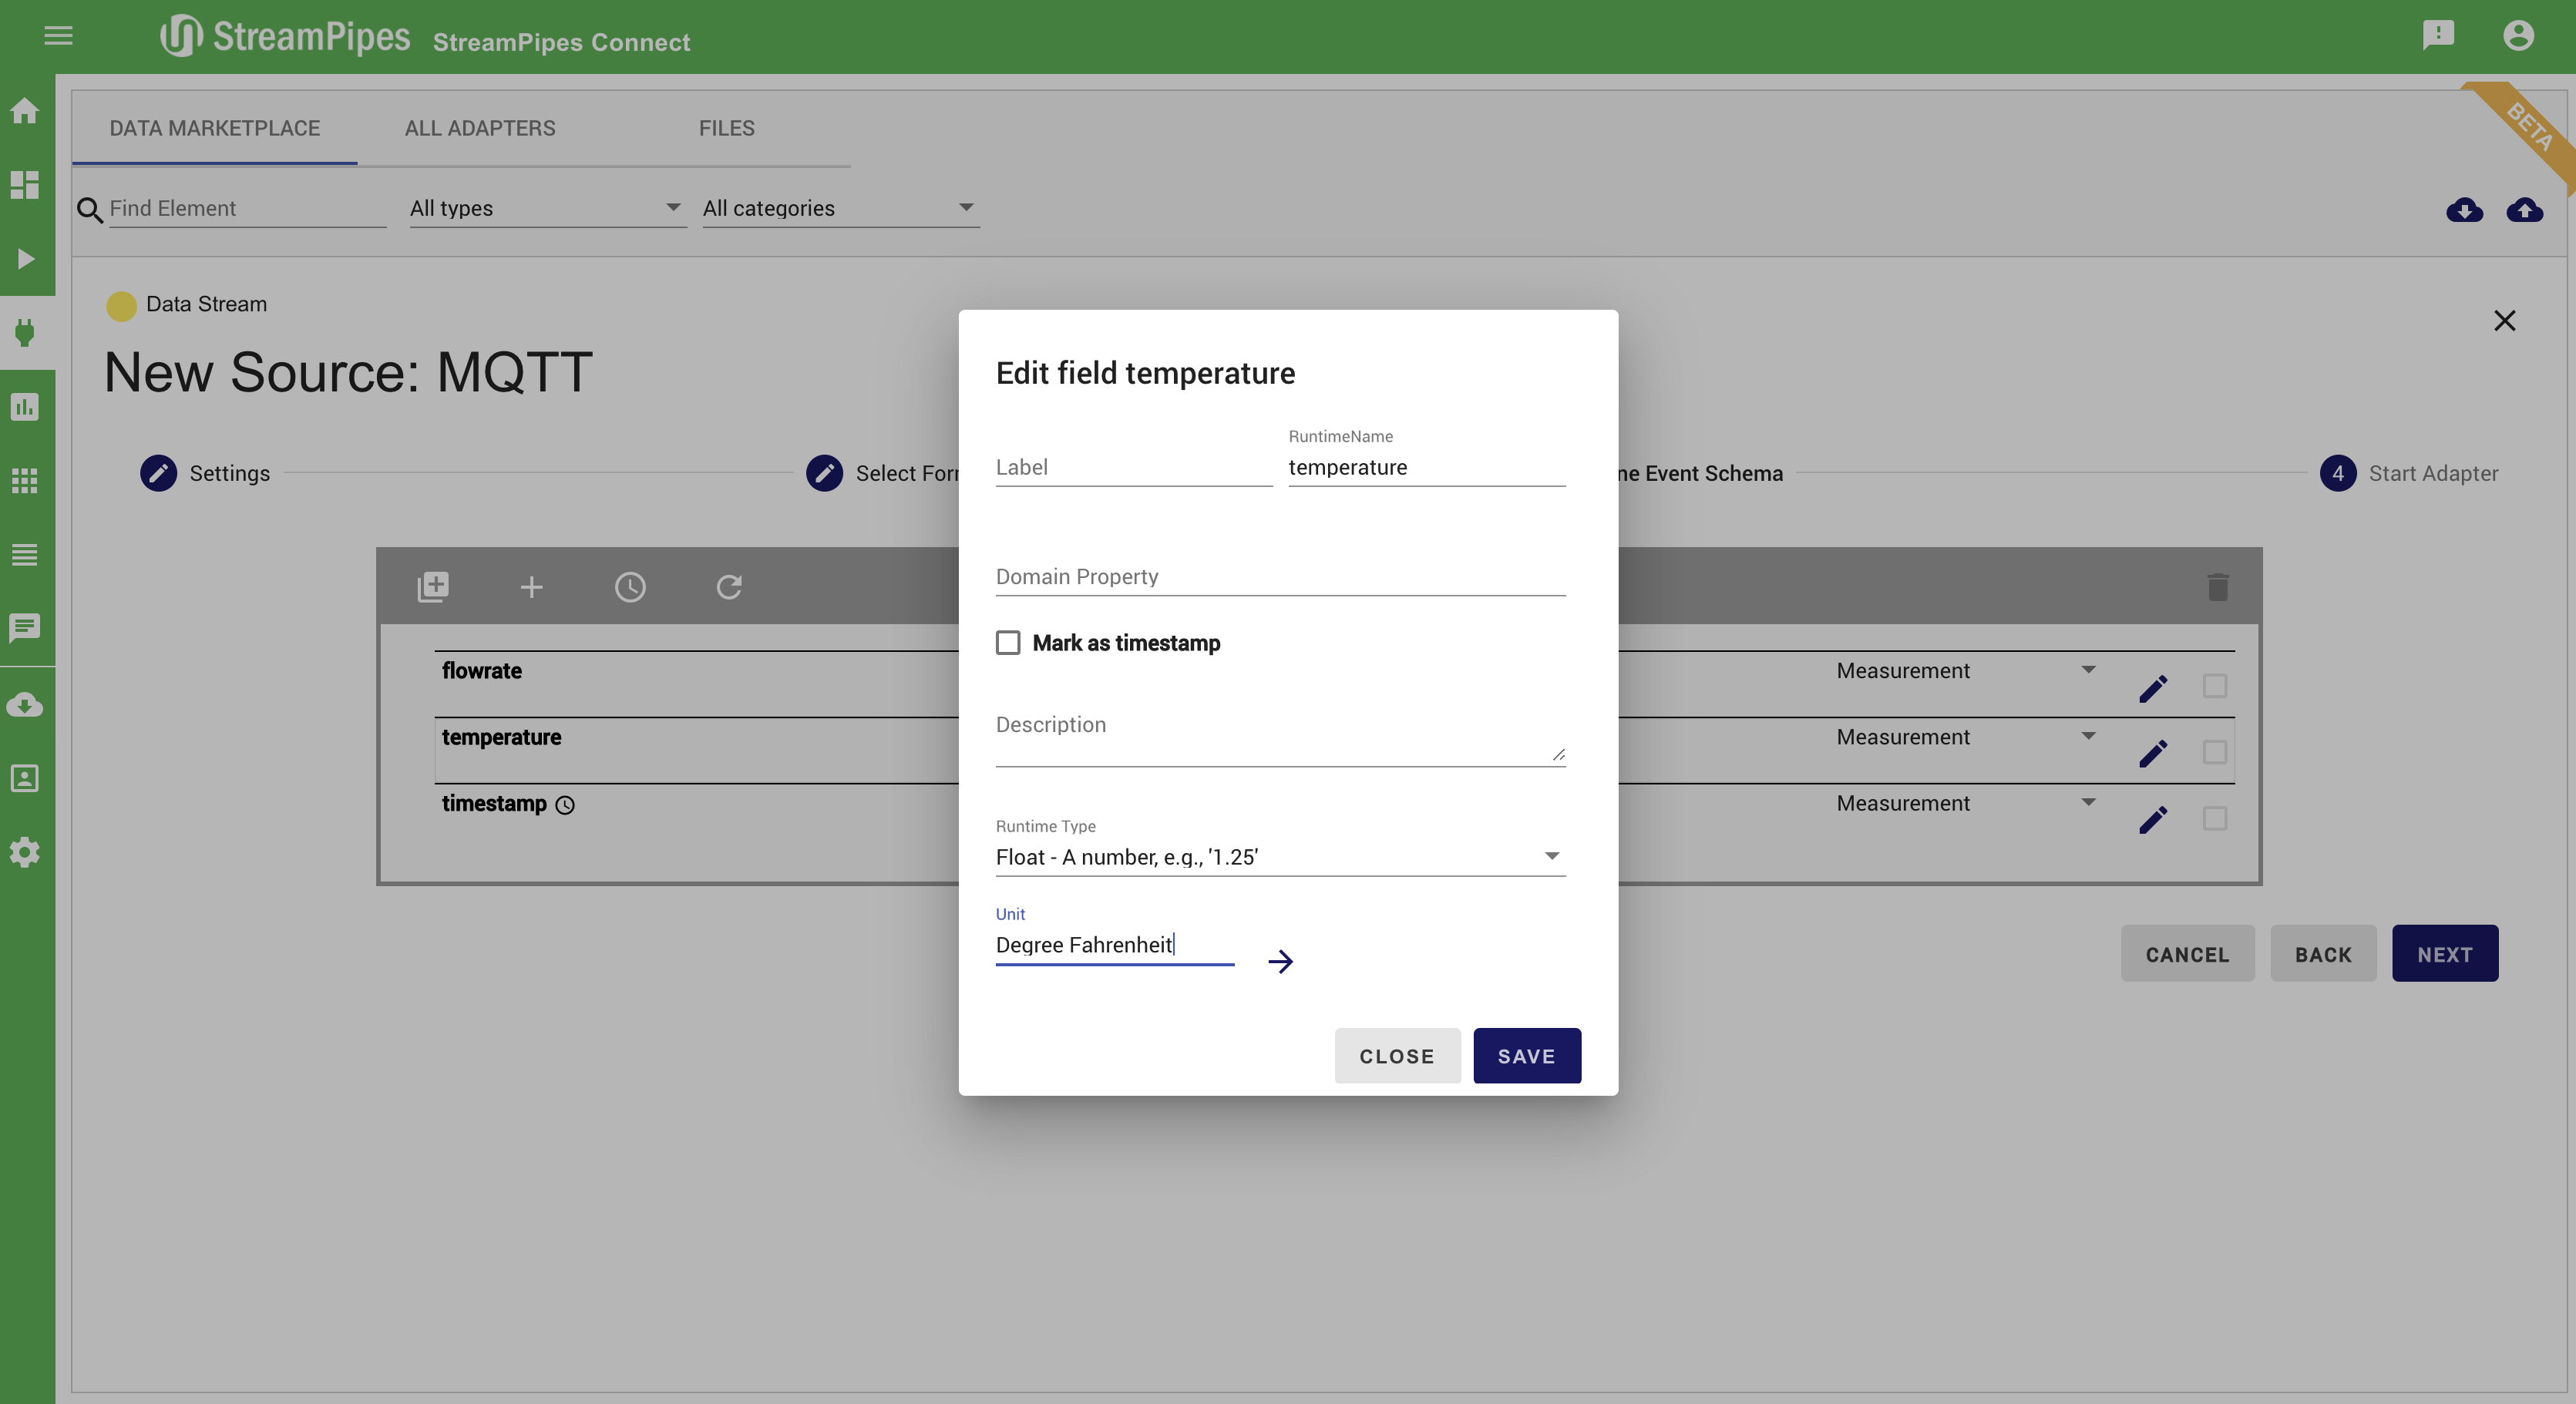
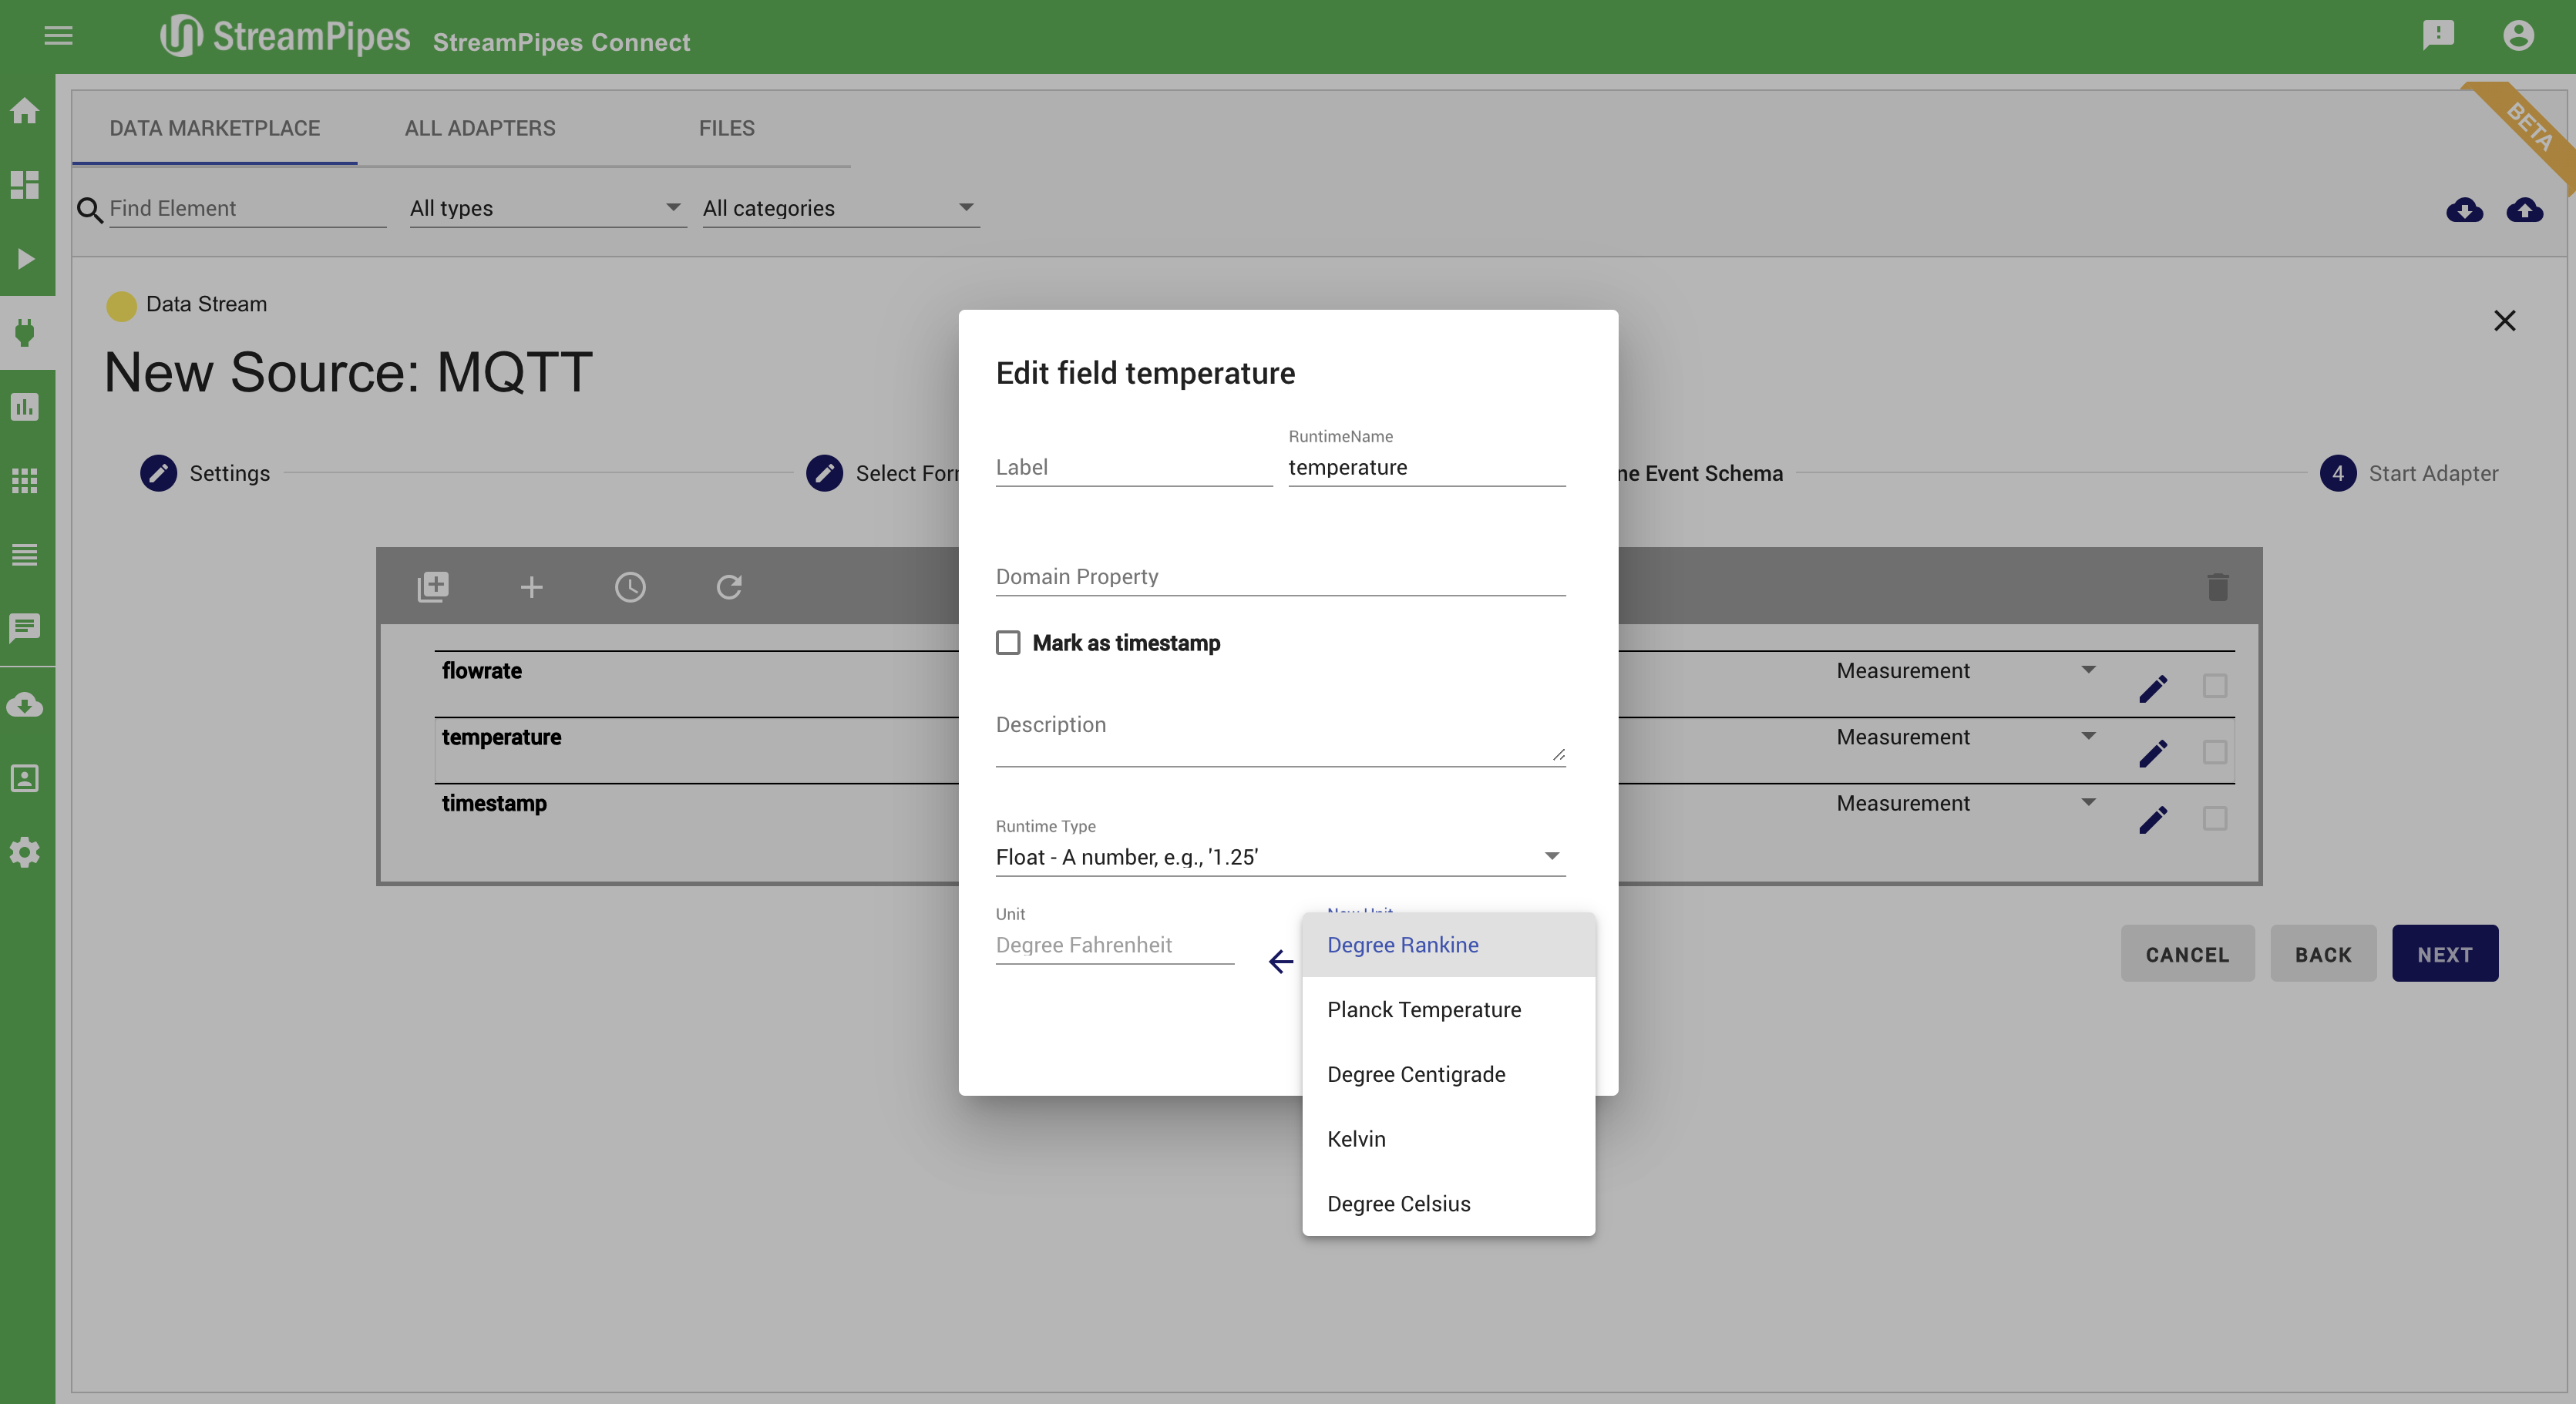
With StreamPipes Connect it is possible to connect new data sources in StreamPipes with just a few clicks. Therefore, we provide a marketplace with a lot of different adapters that can be configured and executed to create new Data Streams in the Pipeline Editor. With StreamPipes Connect it is possible to connect specific data sources - e.g. an adapter streaming the current location of the ISS (International Space Station). It is also possible to connect generic sources like message brokers or databases. If the event schema of the data source is unknown, the system tries to infer the schema by extracting some sample data and analysing it.
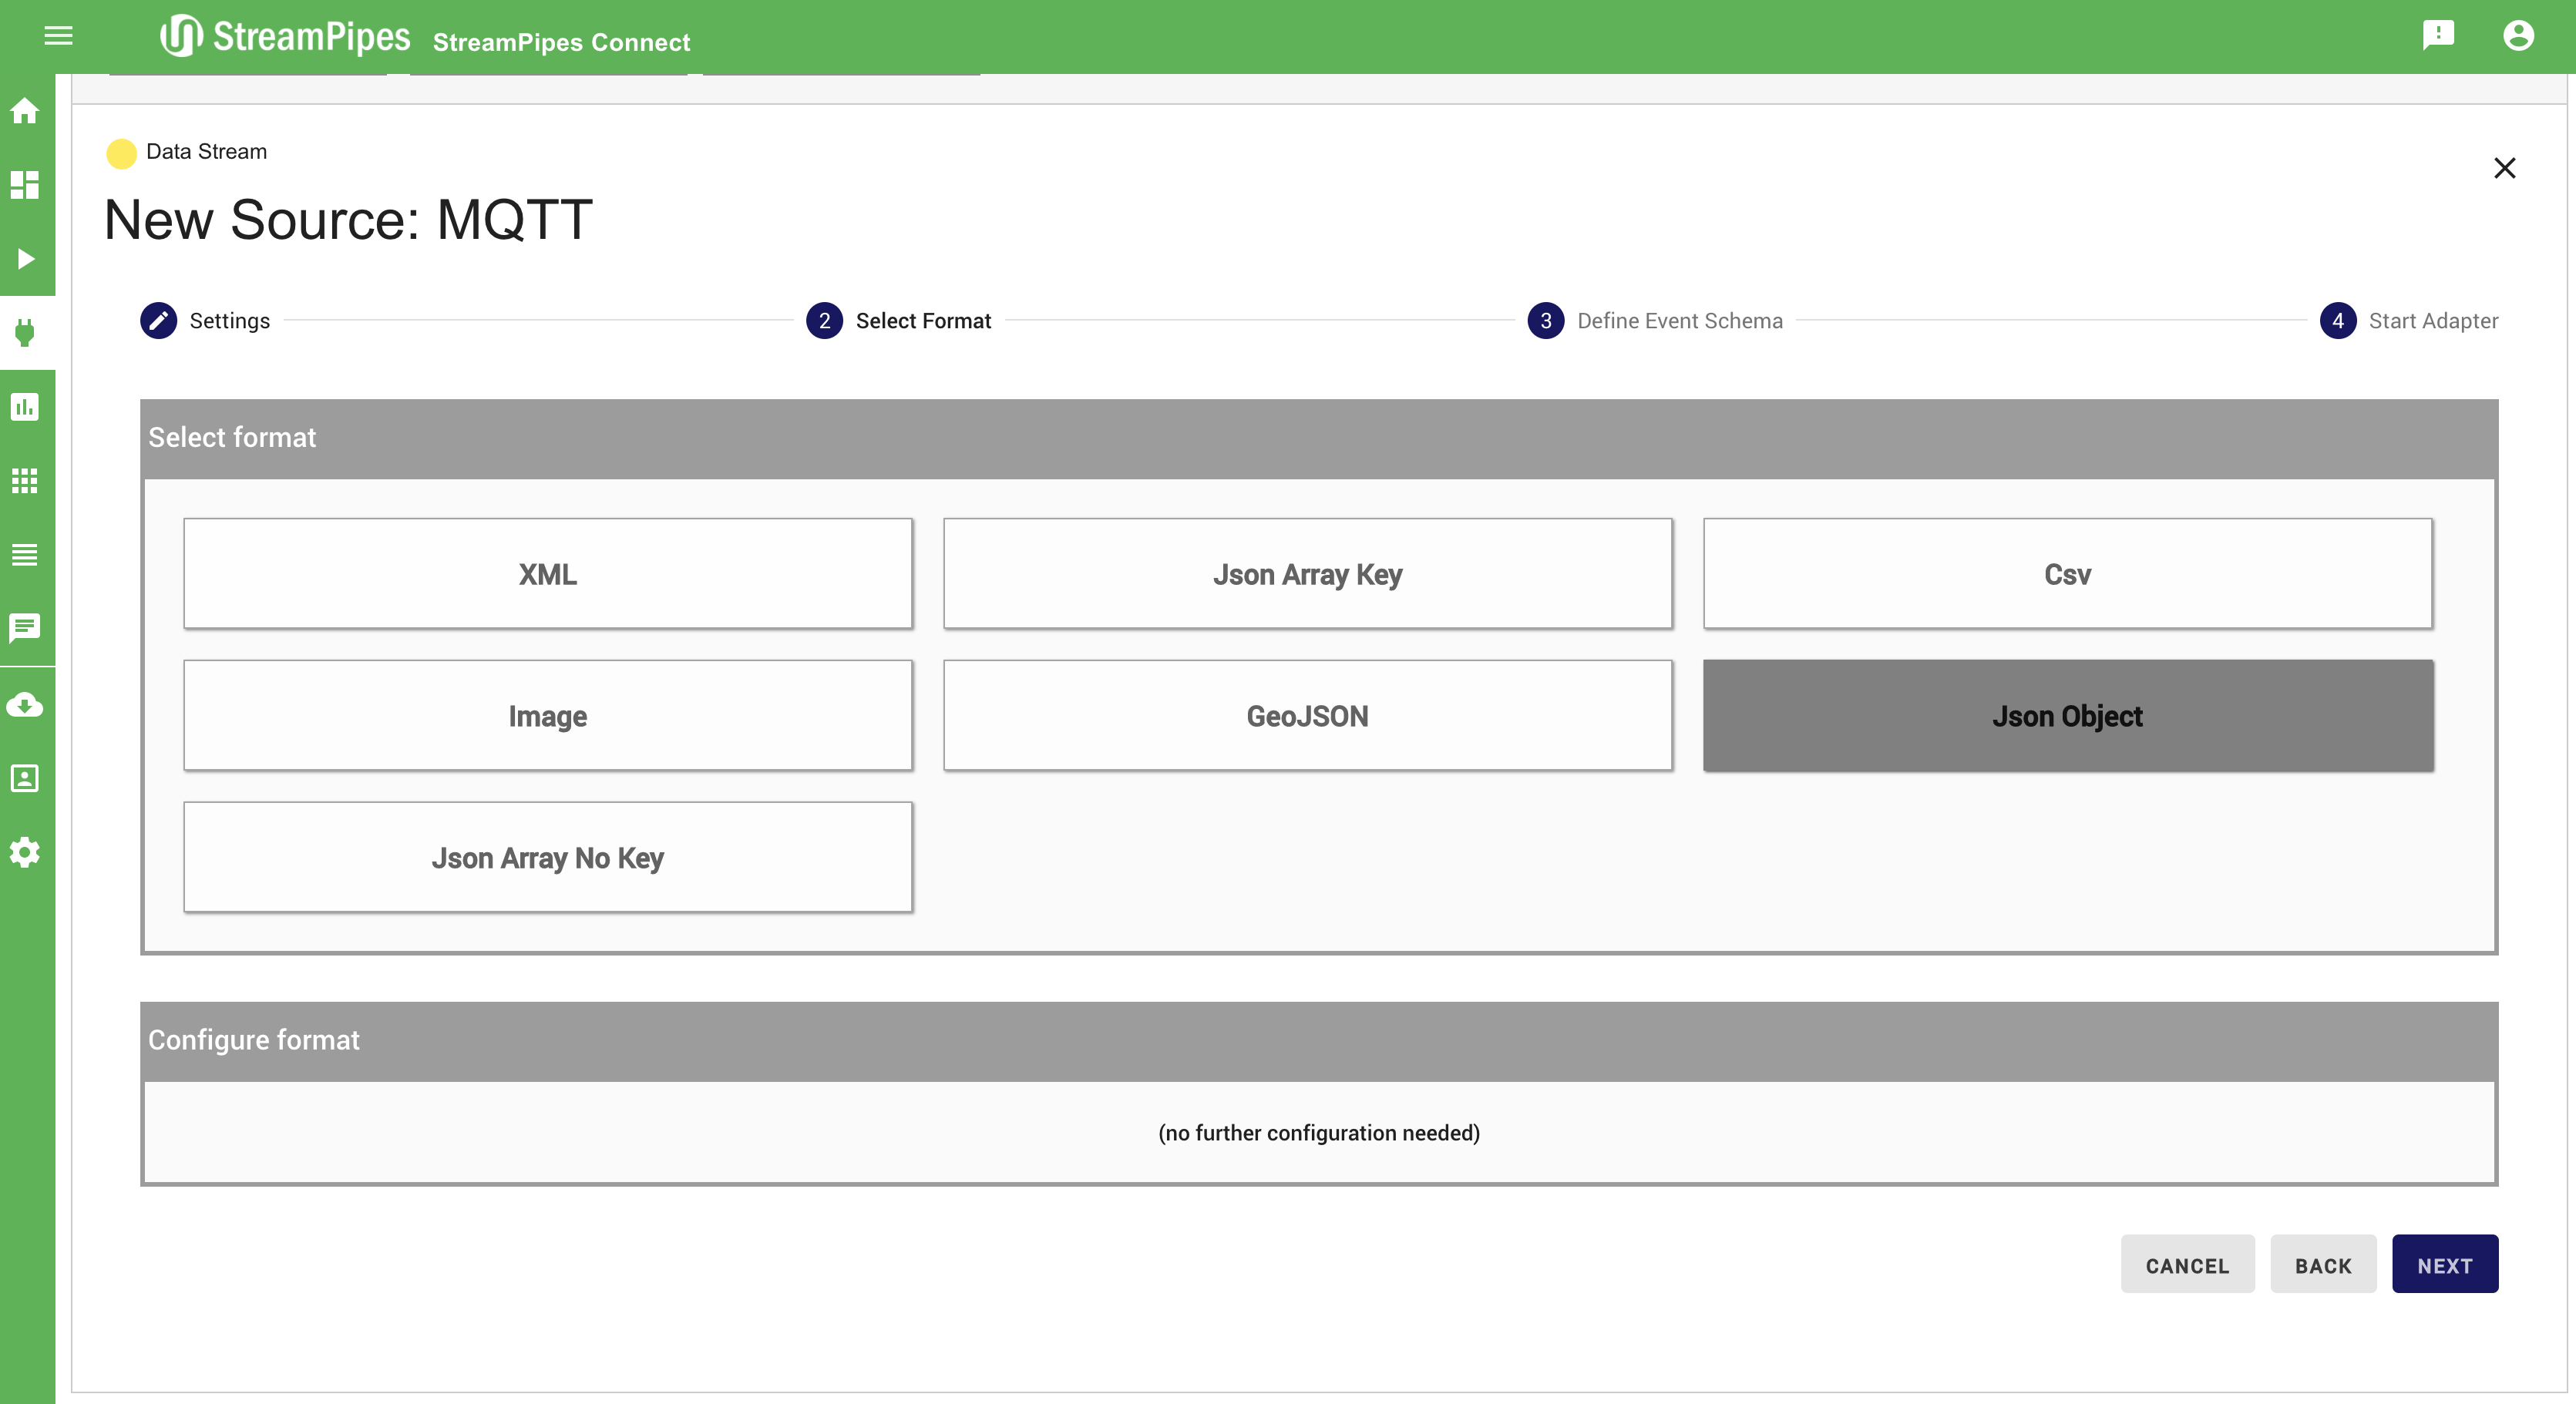
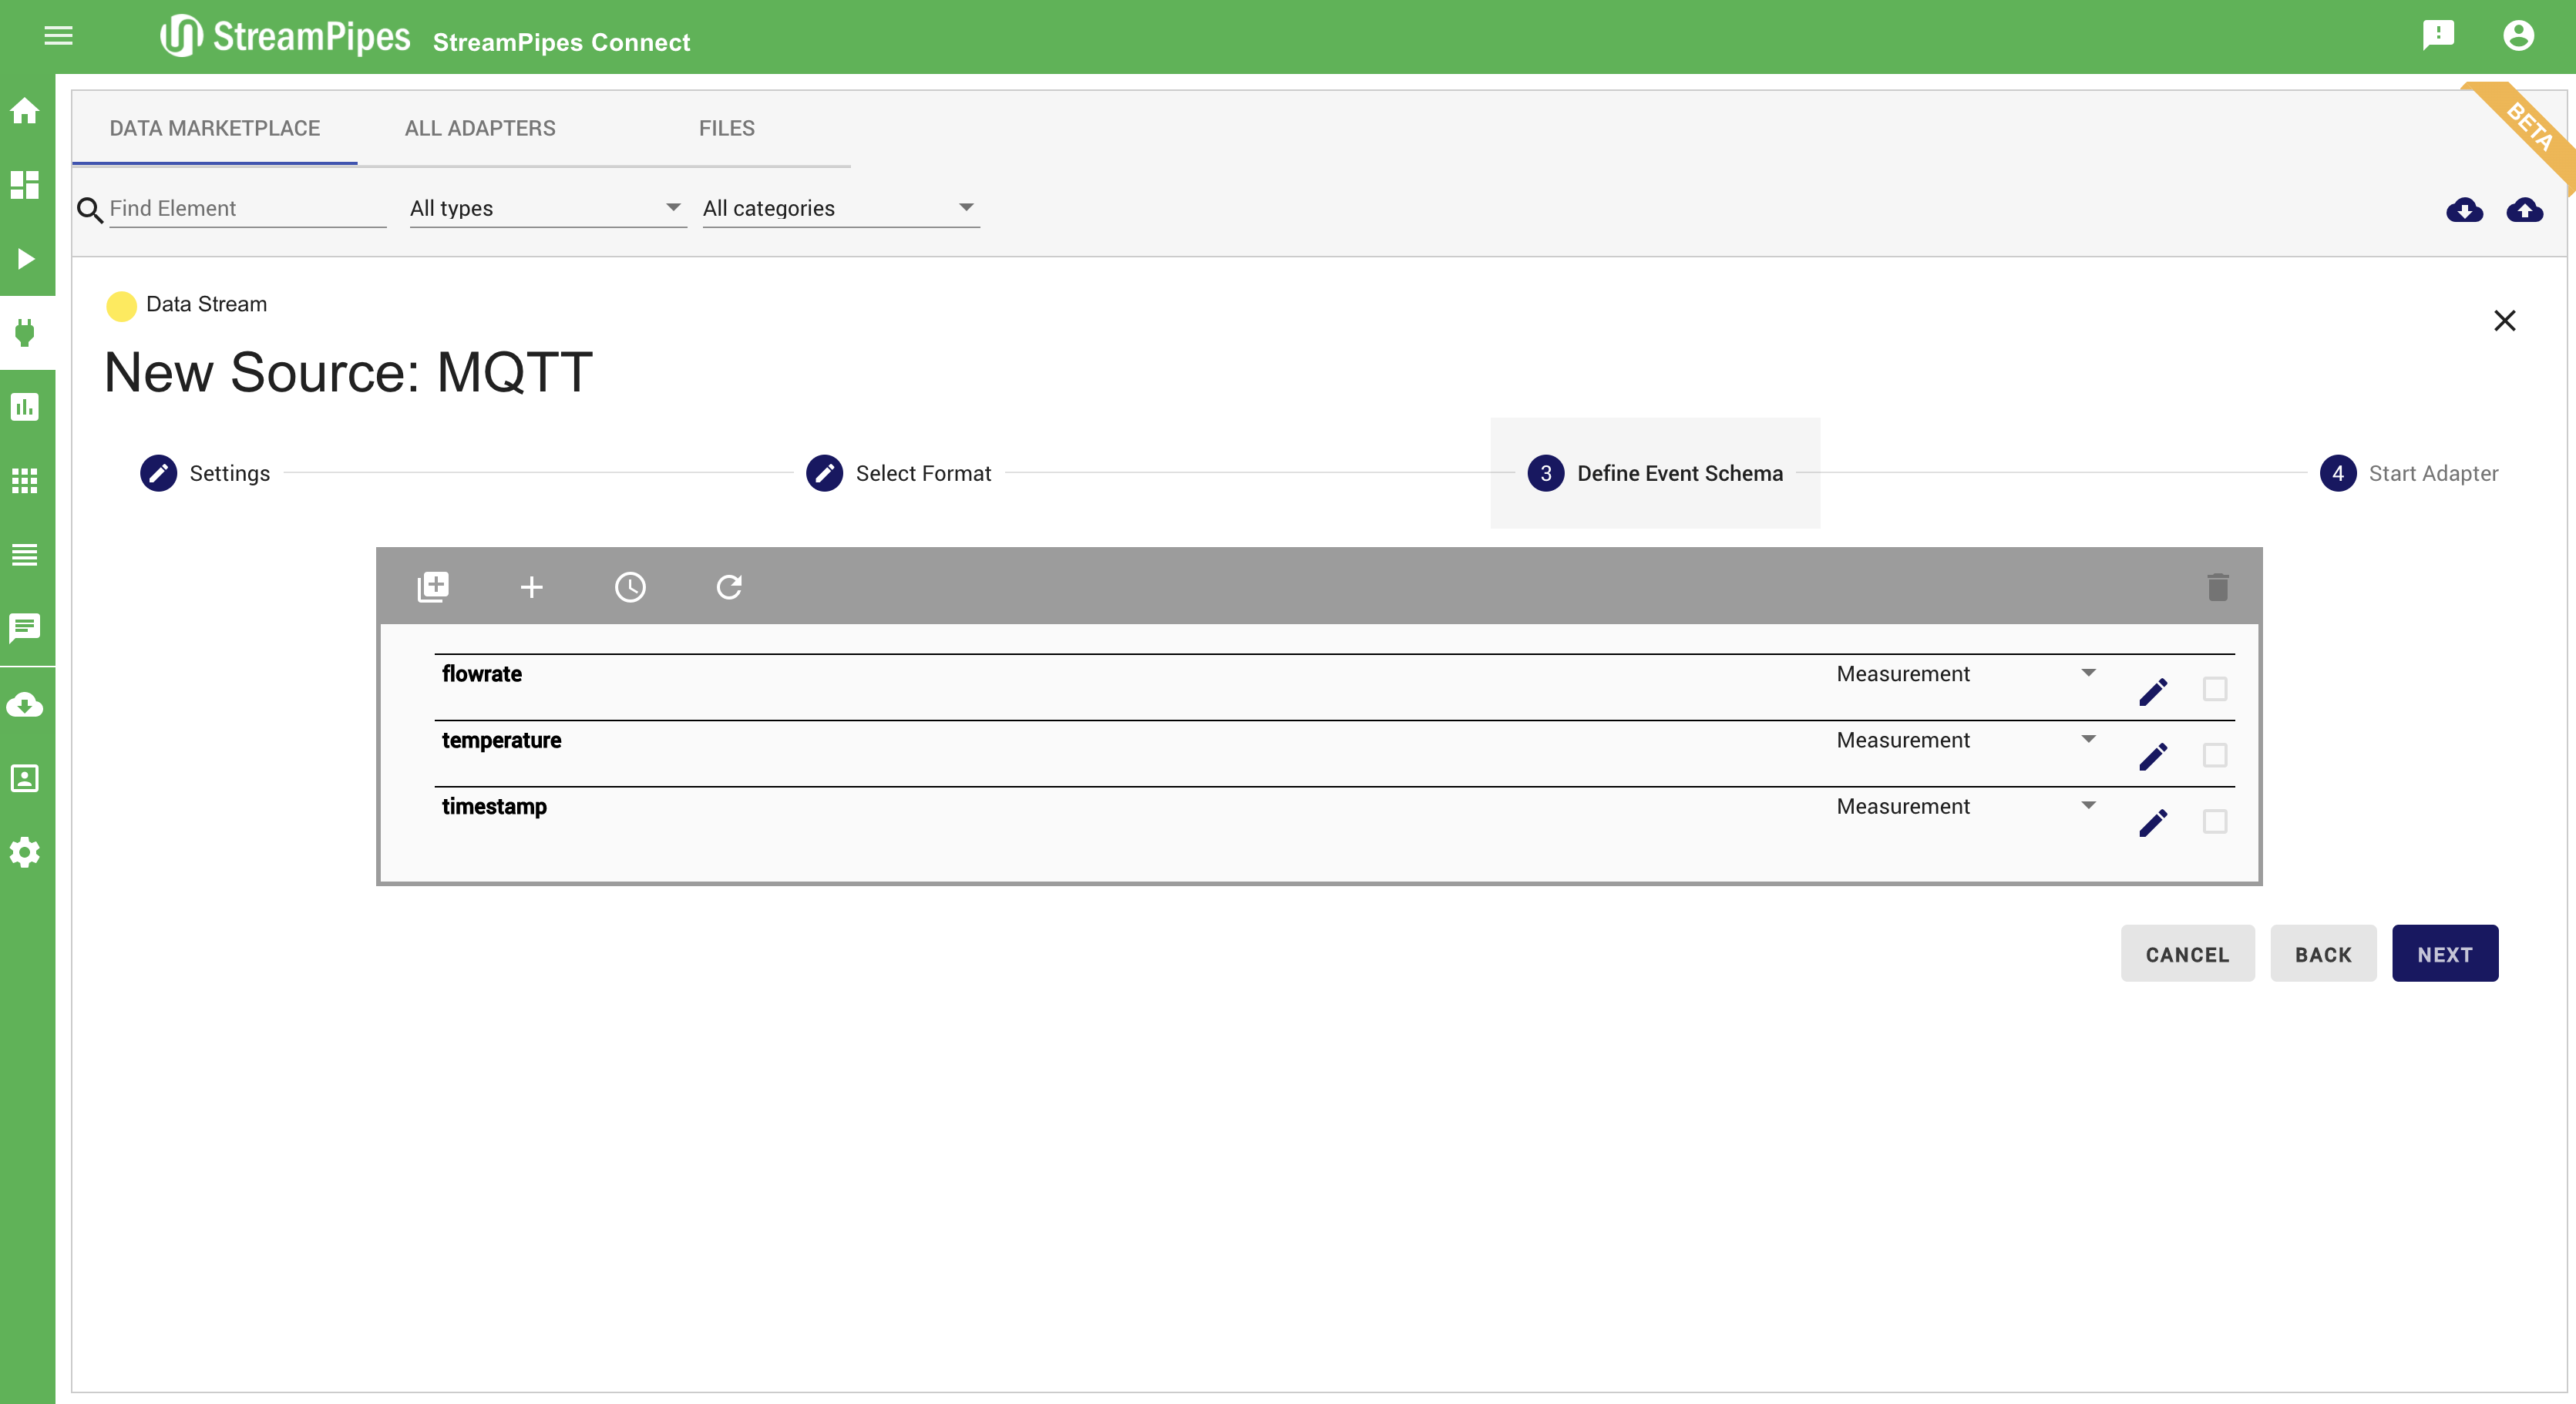
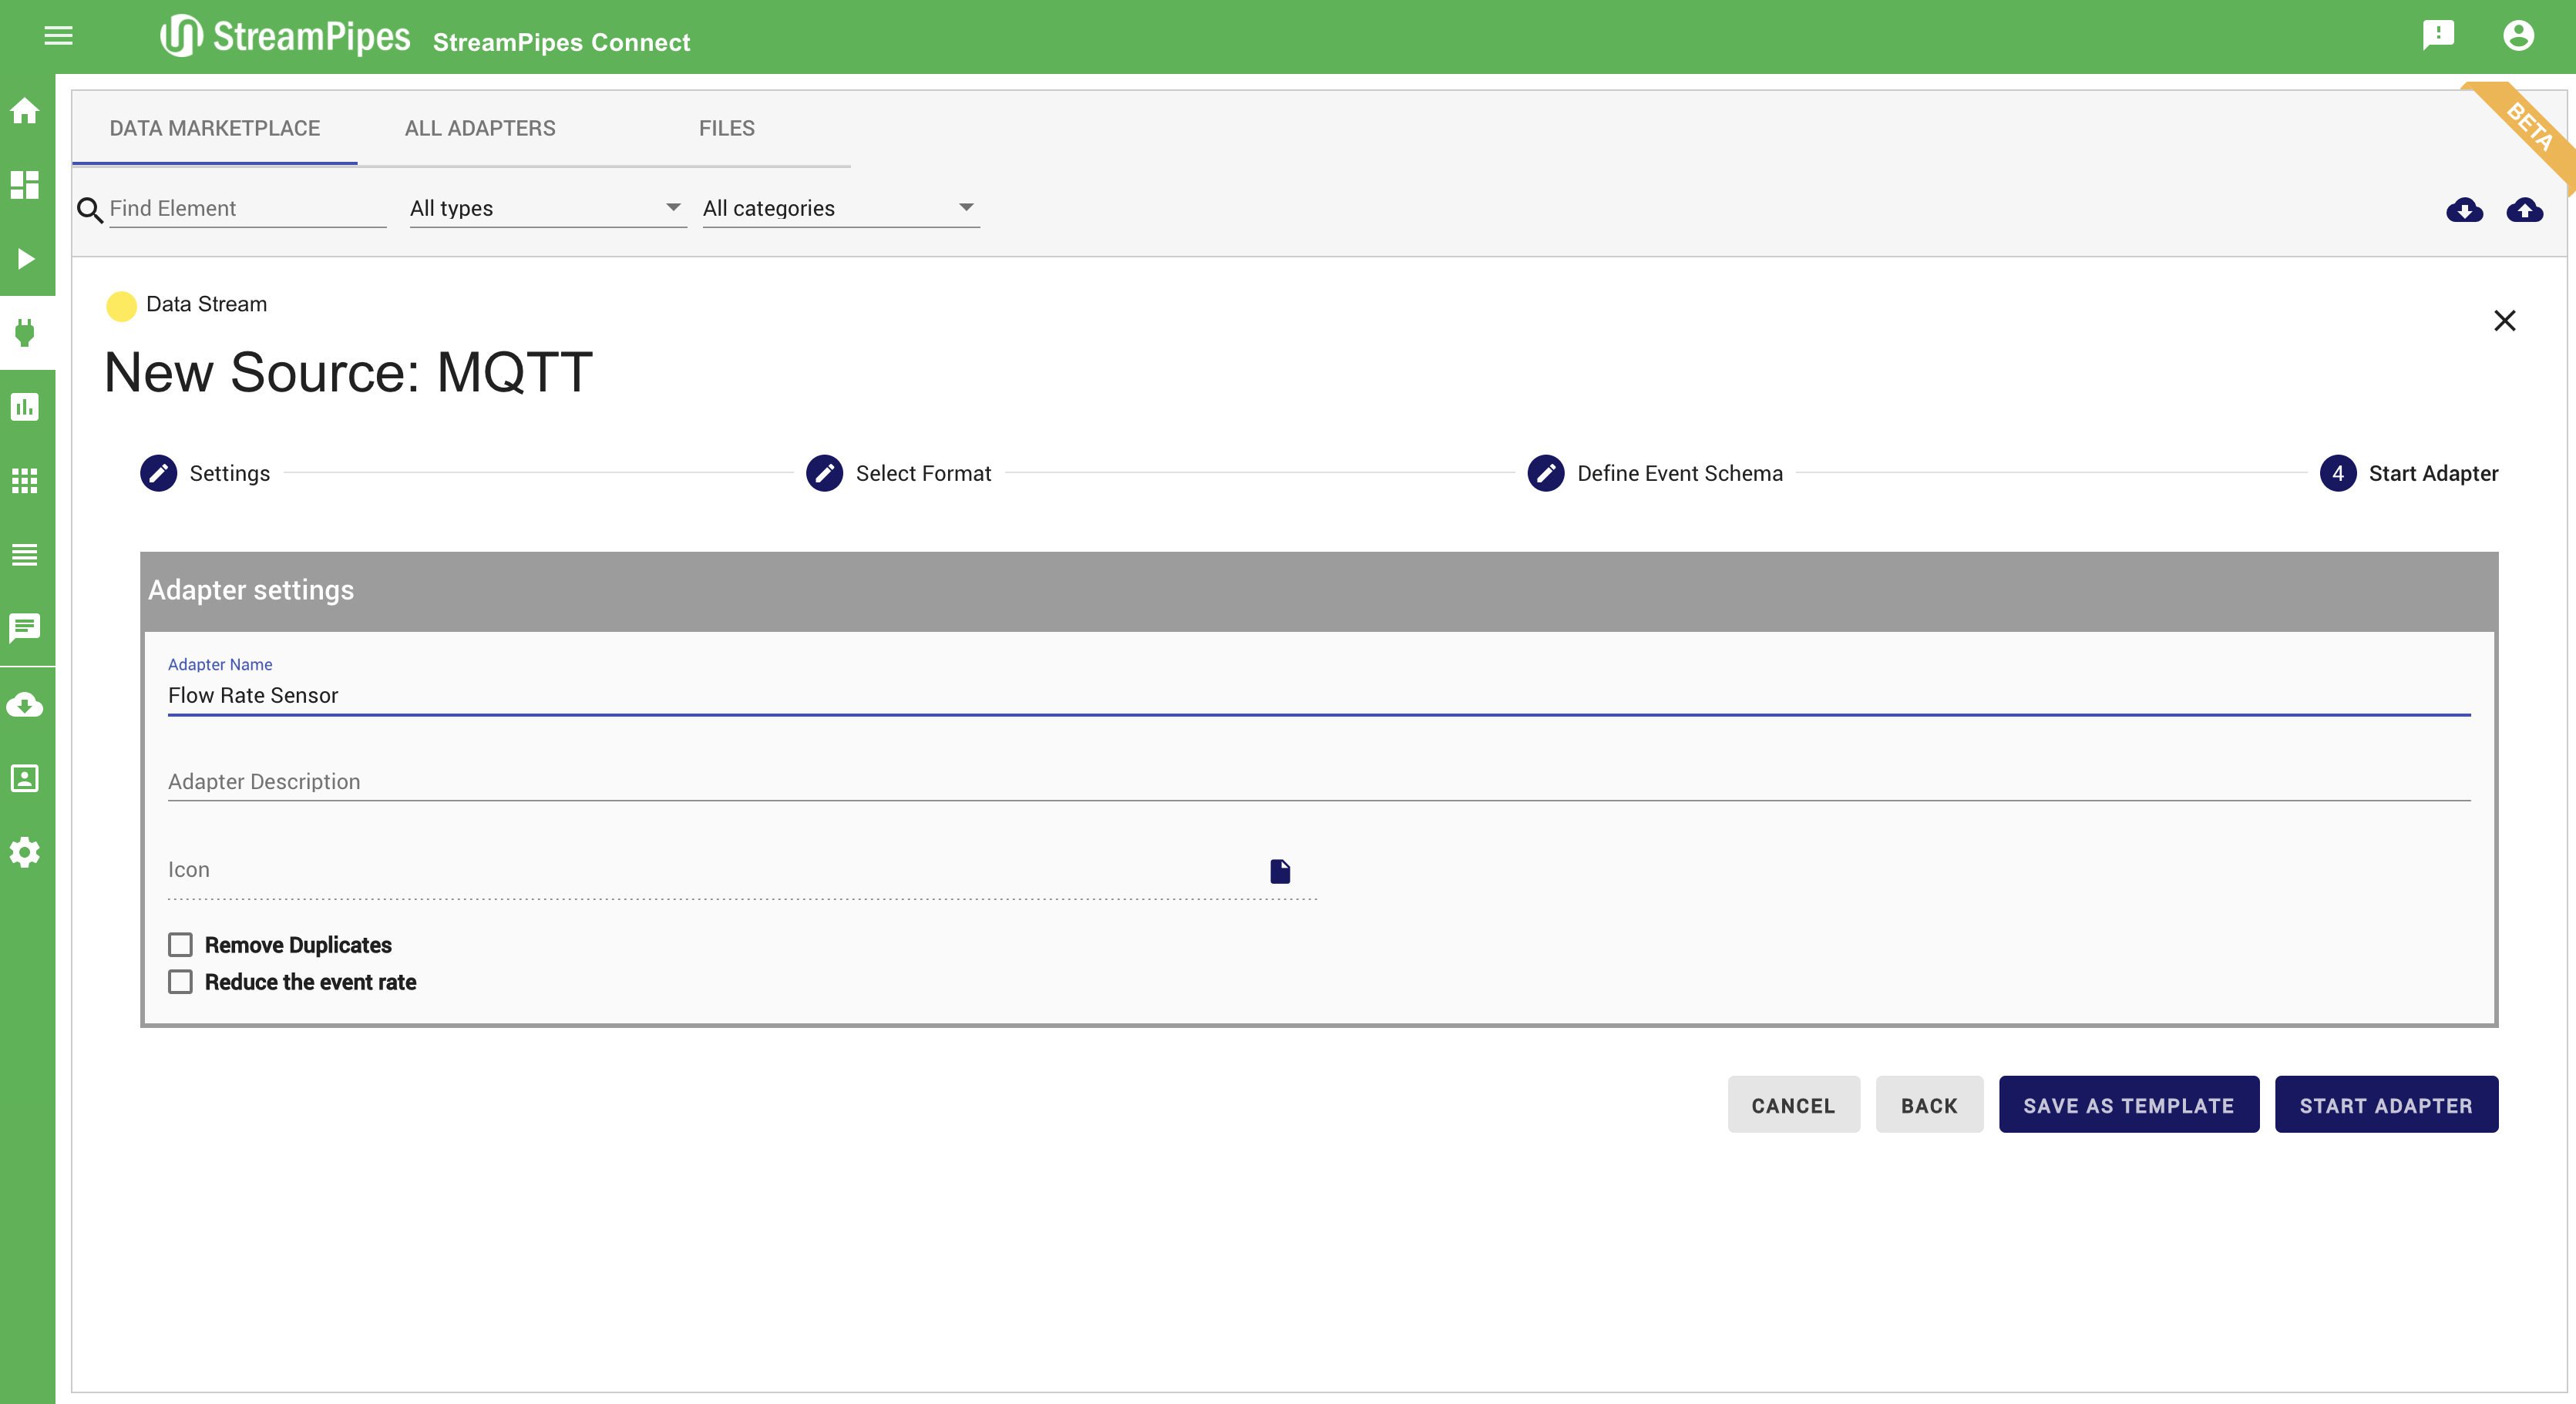
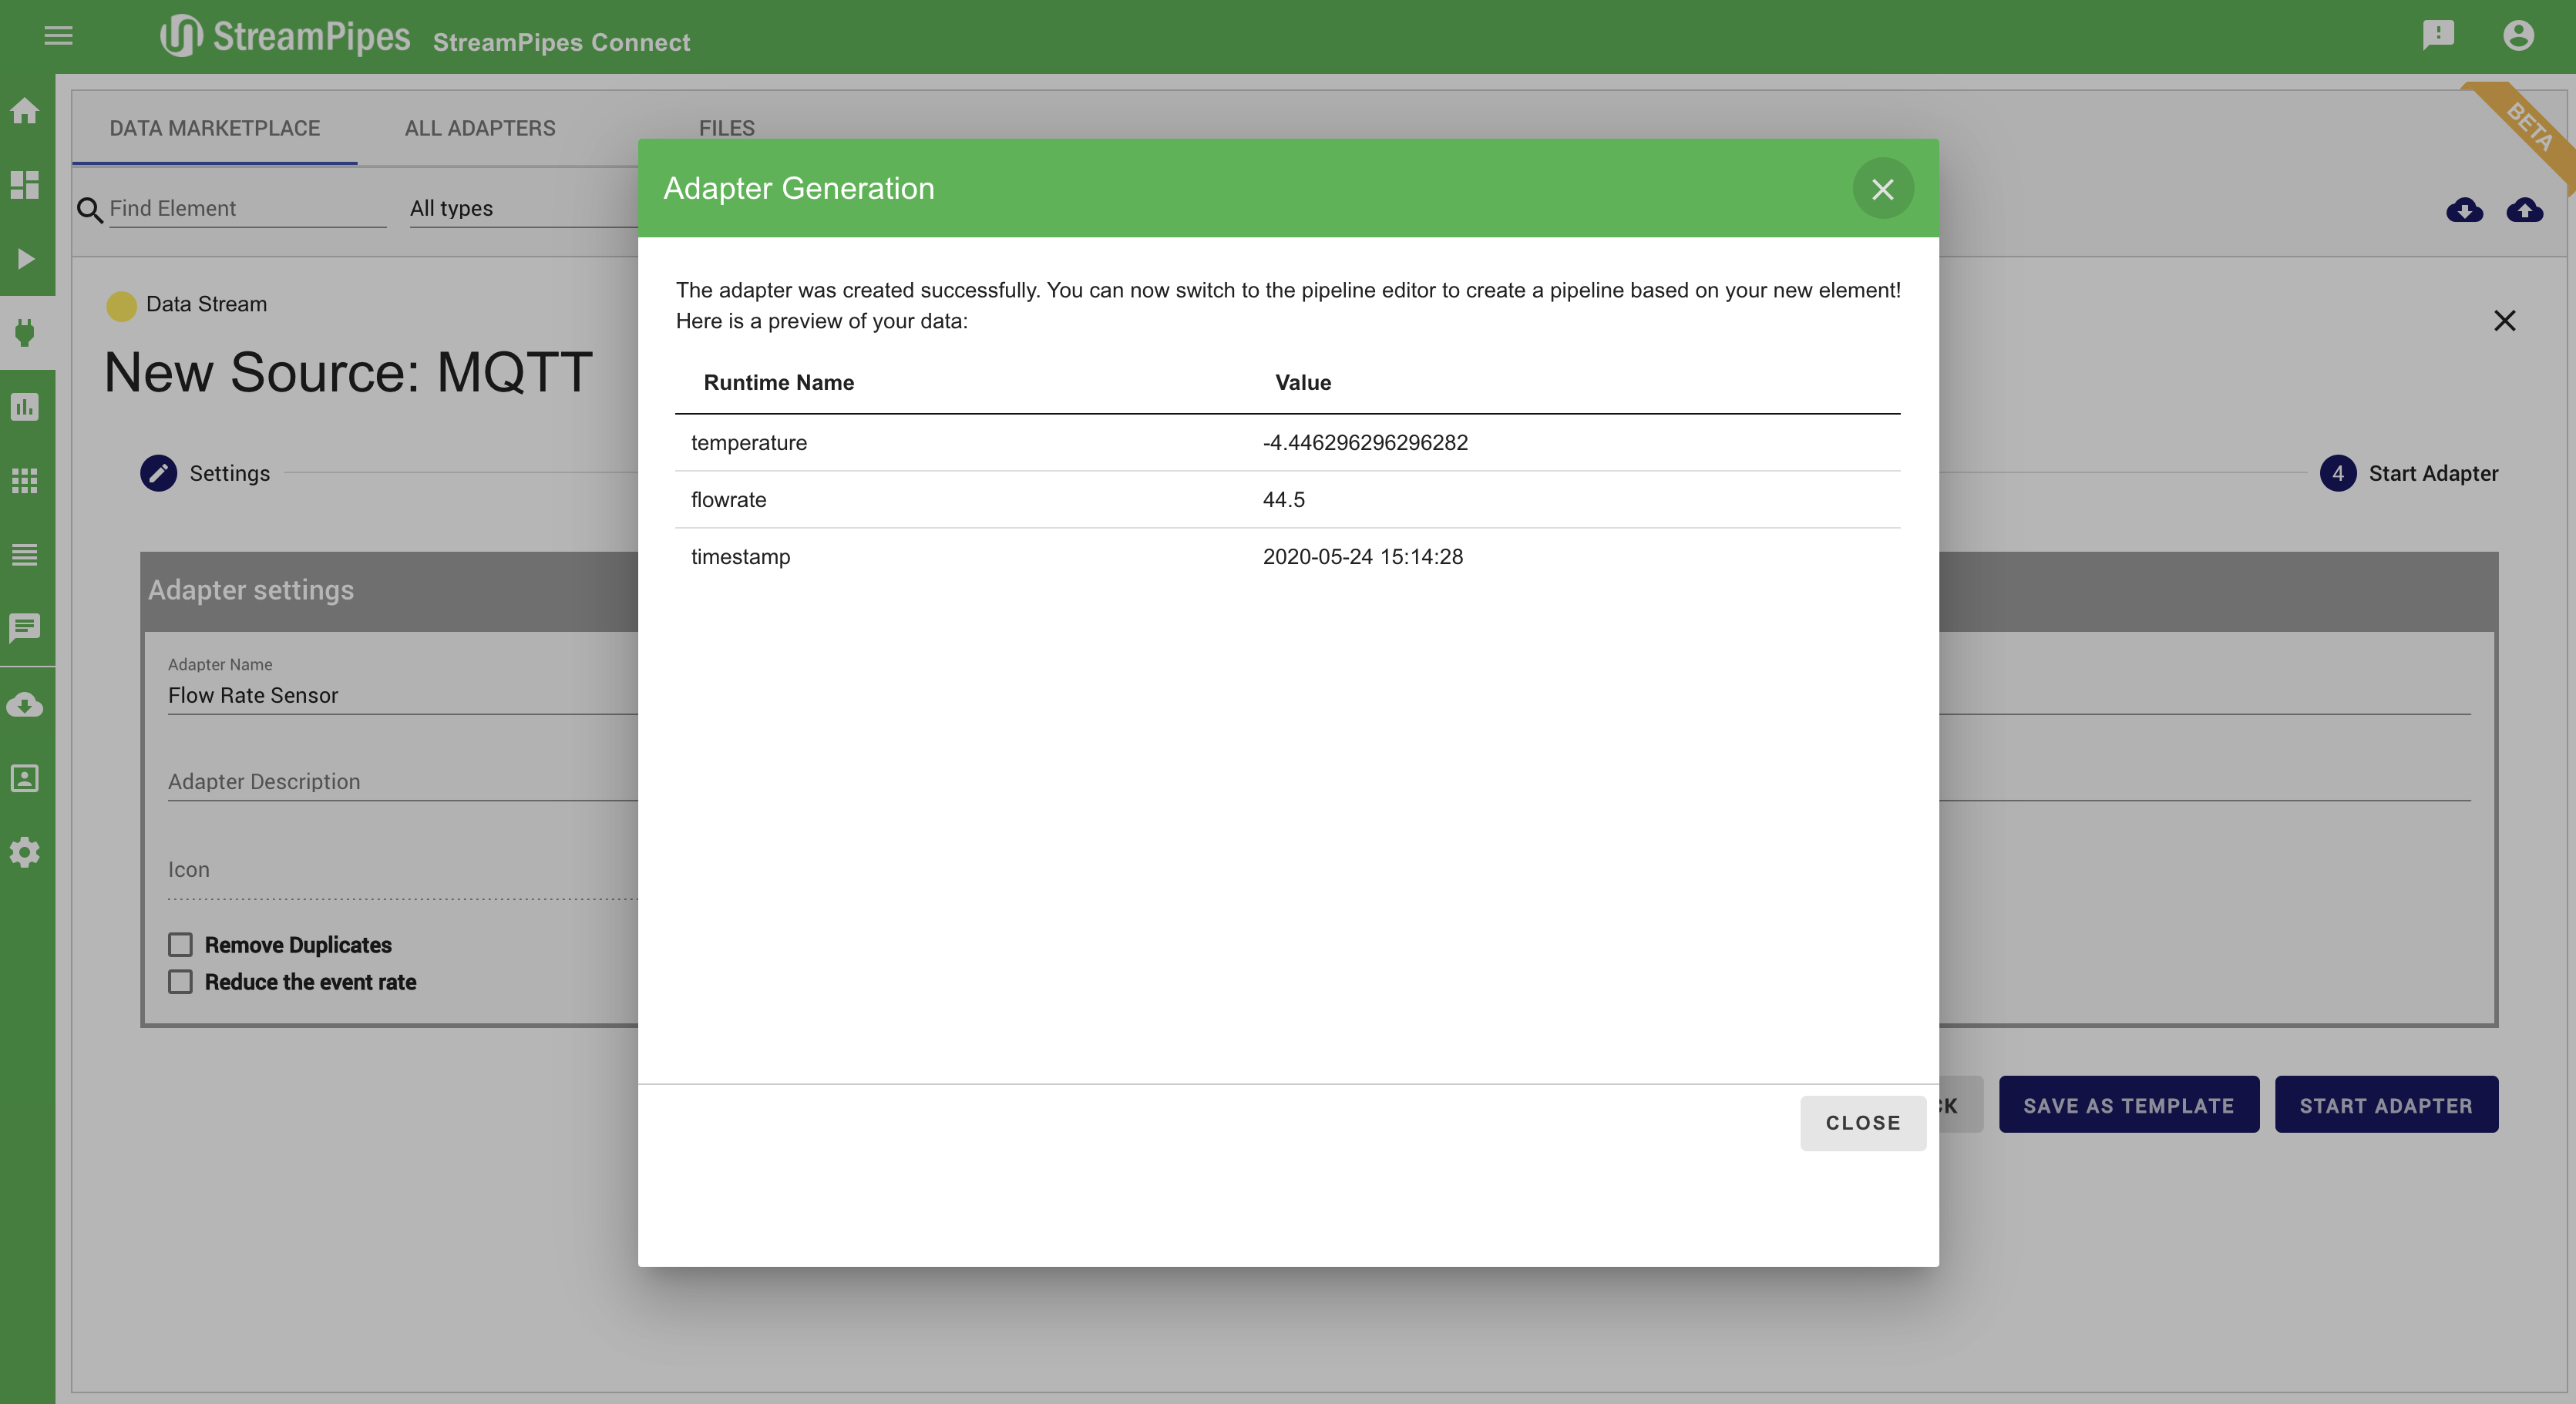
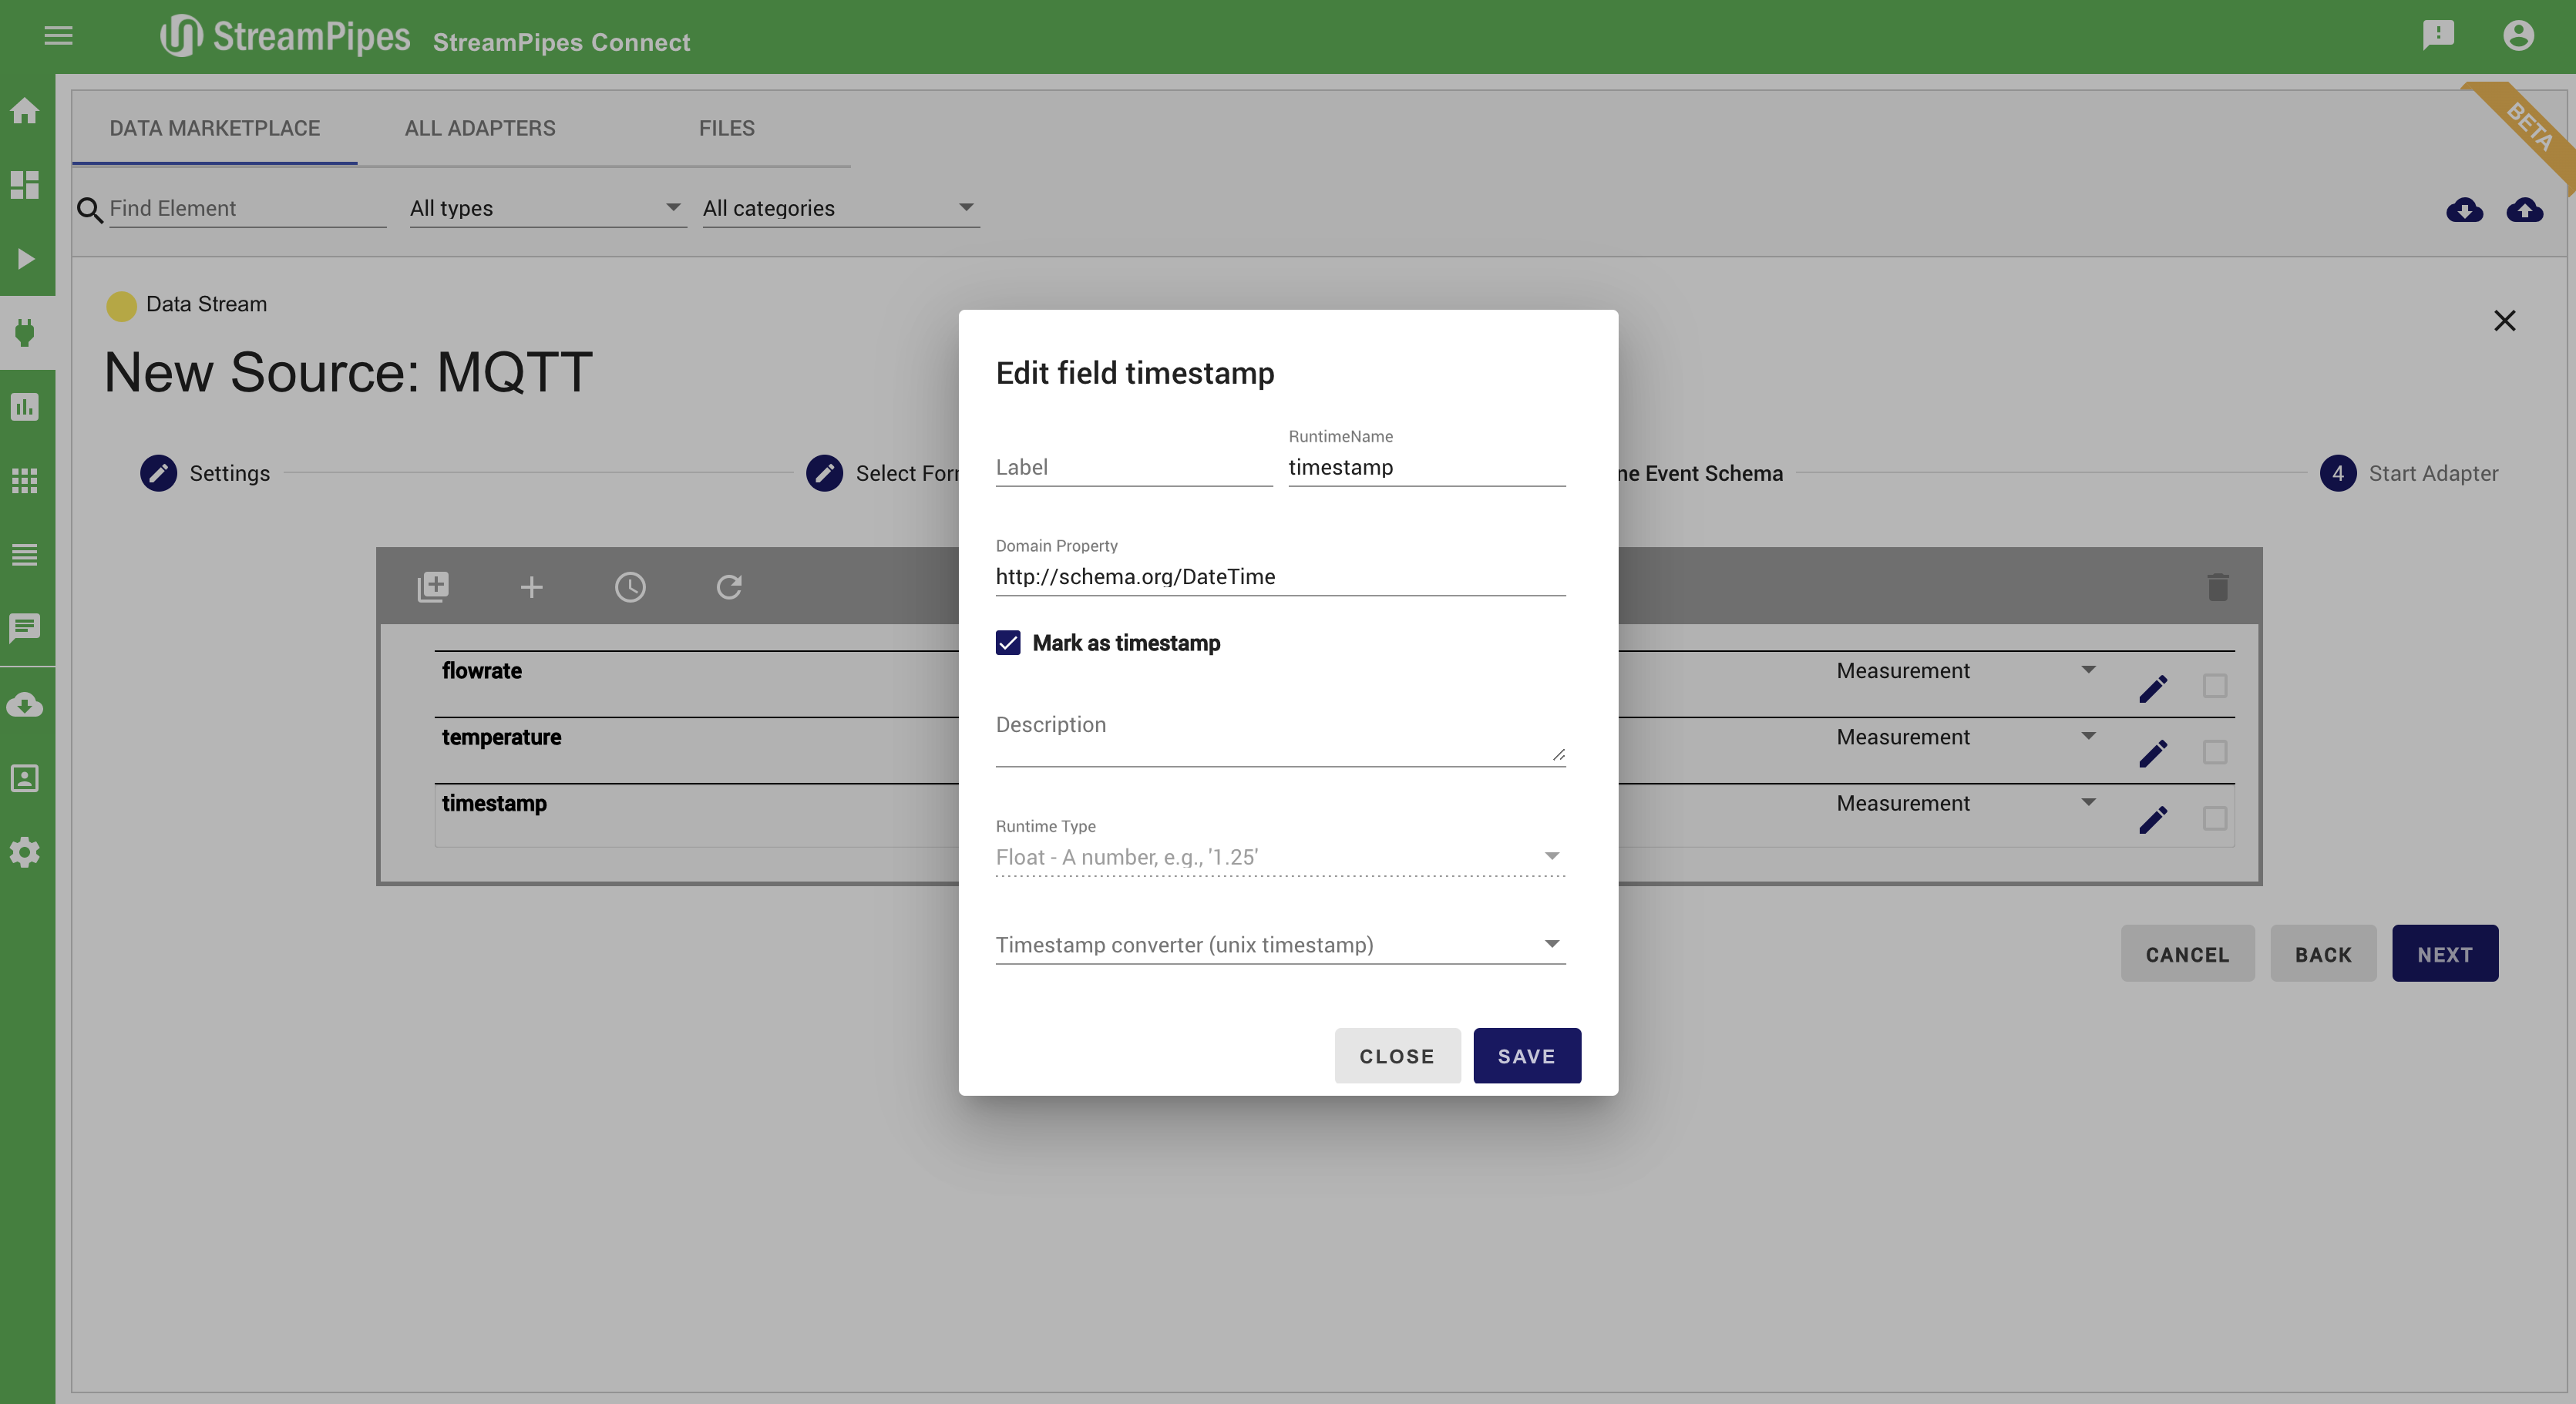
Additionally to connecting new sources, data can be cleaned, transformed, and enriched with meta-information. Therefore, the event schema can be changed or enriched in step 3 (Define Event Schema).
Manage Pipelines
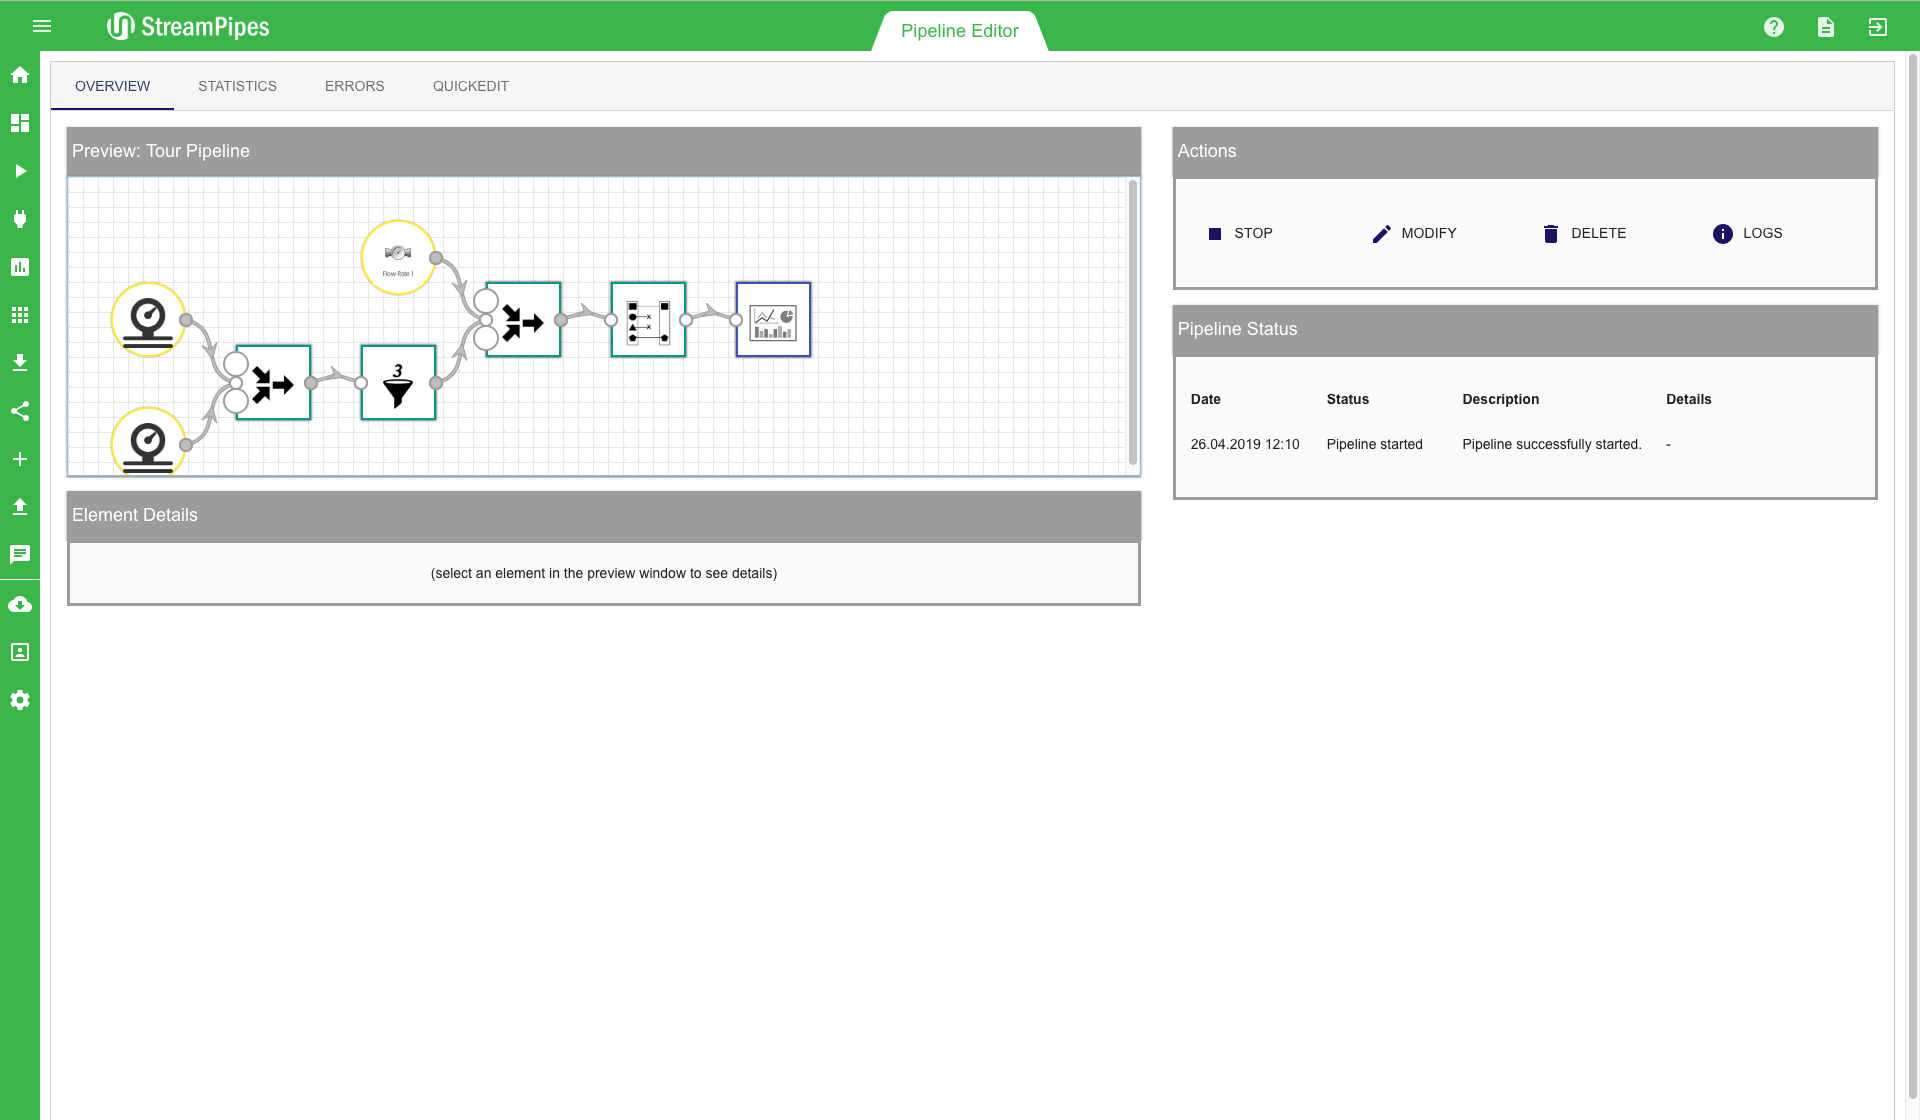
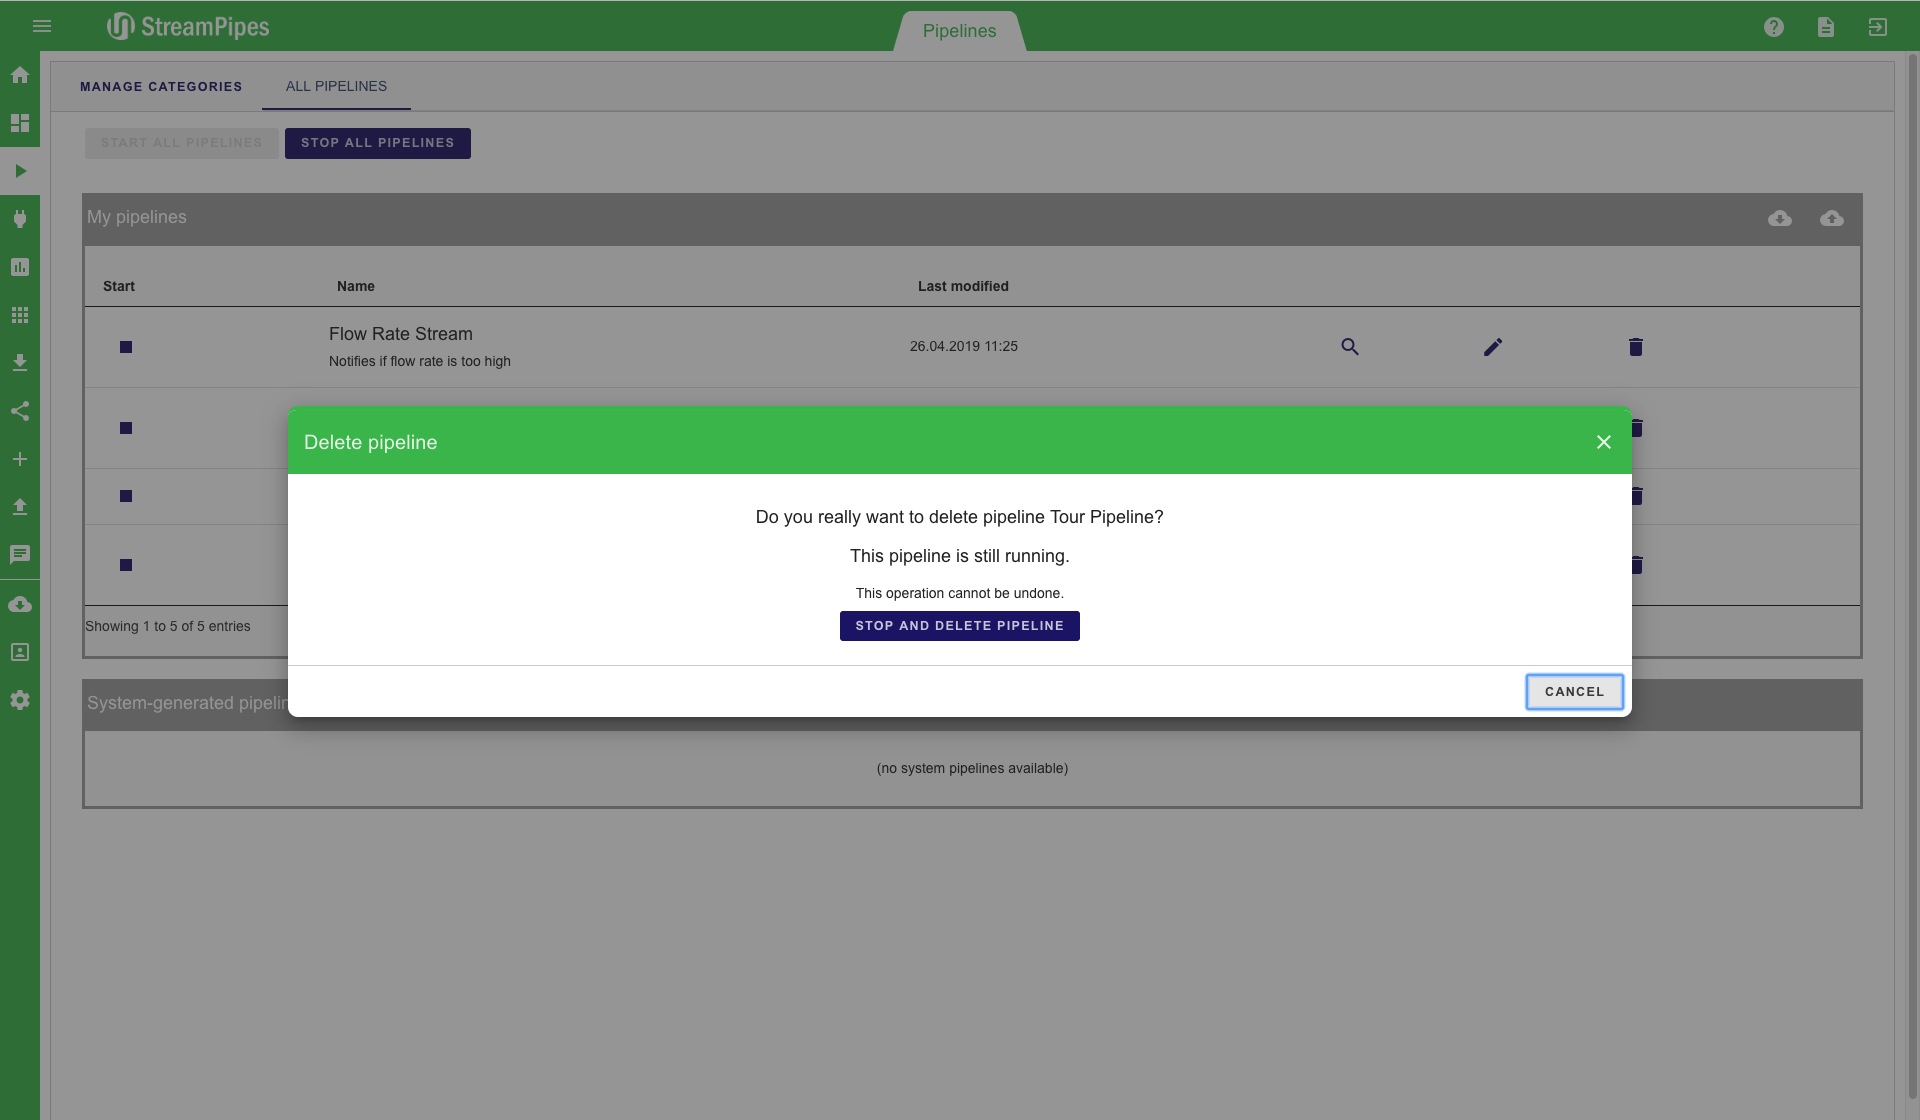
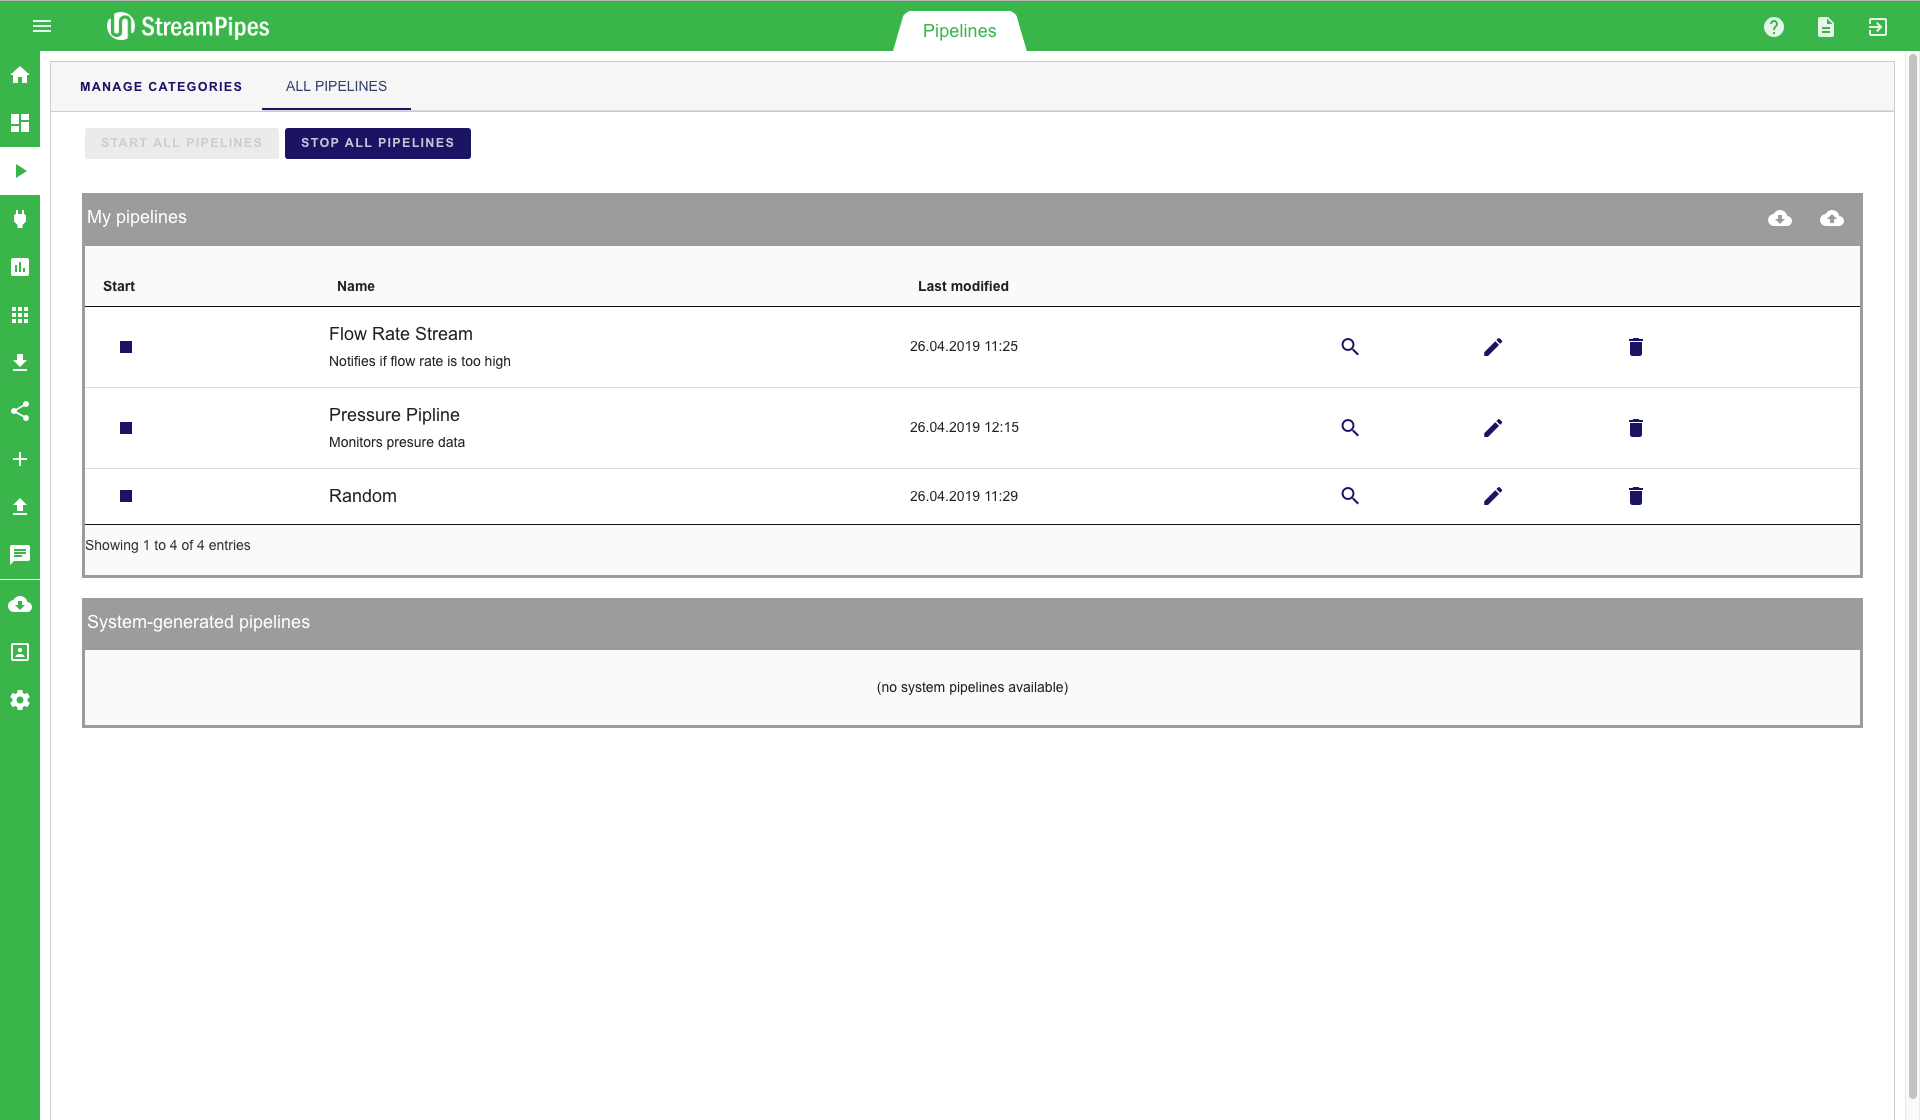
The Manage Pipelines view provides an overview of all existing pipelines. Existing pipelines can be managed using this view. For instance, users can start and stop pipelines or delete them when they are not longer needed. Pipeline actions can be performed by clicking one of the buttons next to each pipeline. For each pipeline, the title and description is displayed in the table. By clicking the edit symbol an overview of the created pipline is shown. In this window you are able to analyze statistics, identify errors or edit the pipeline.
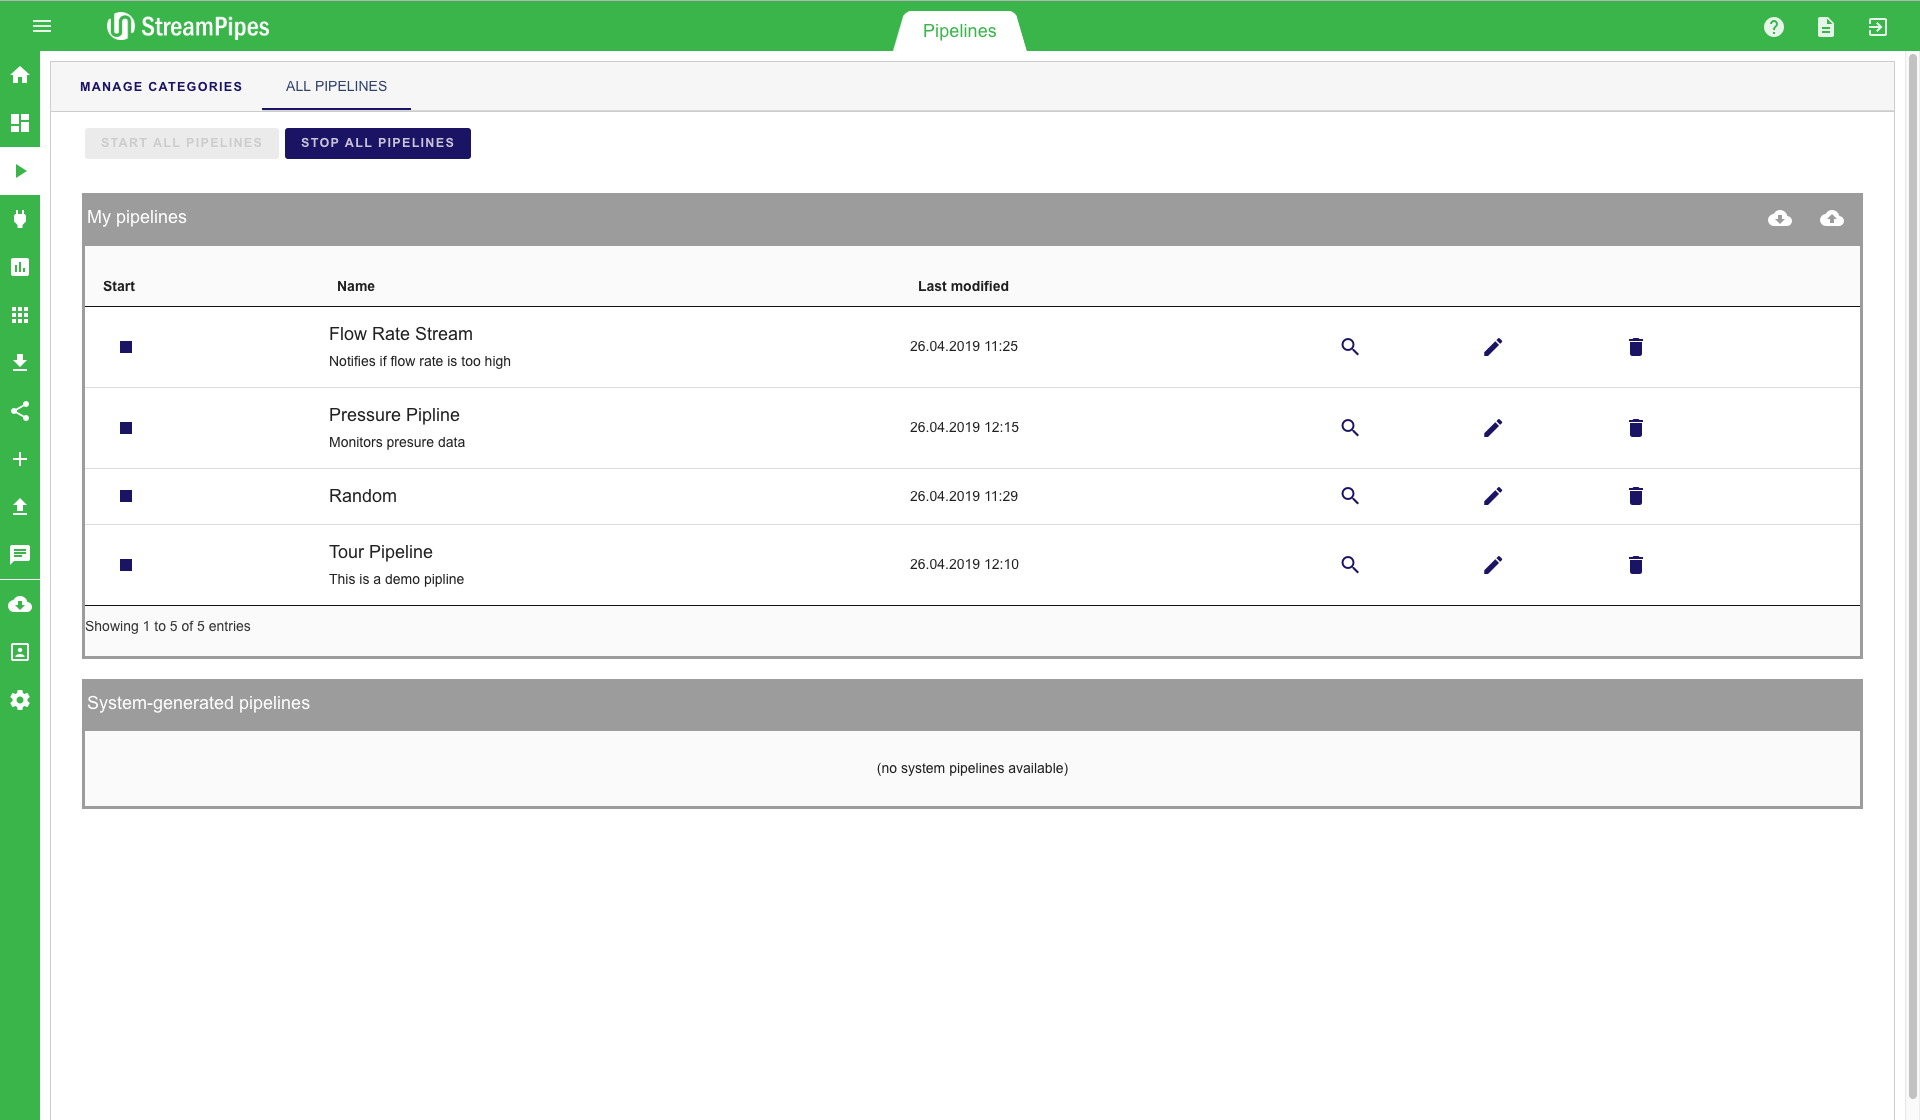
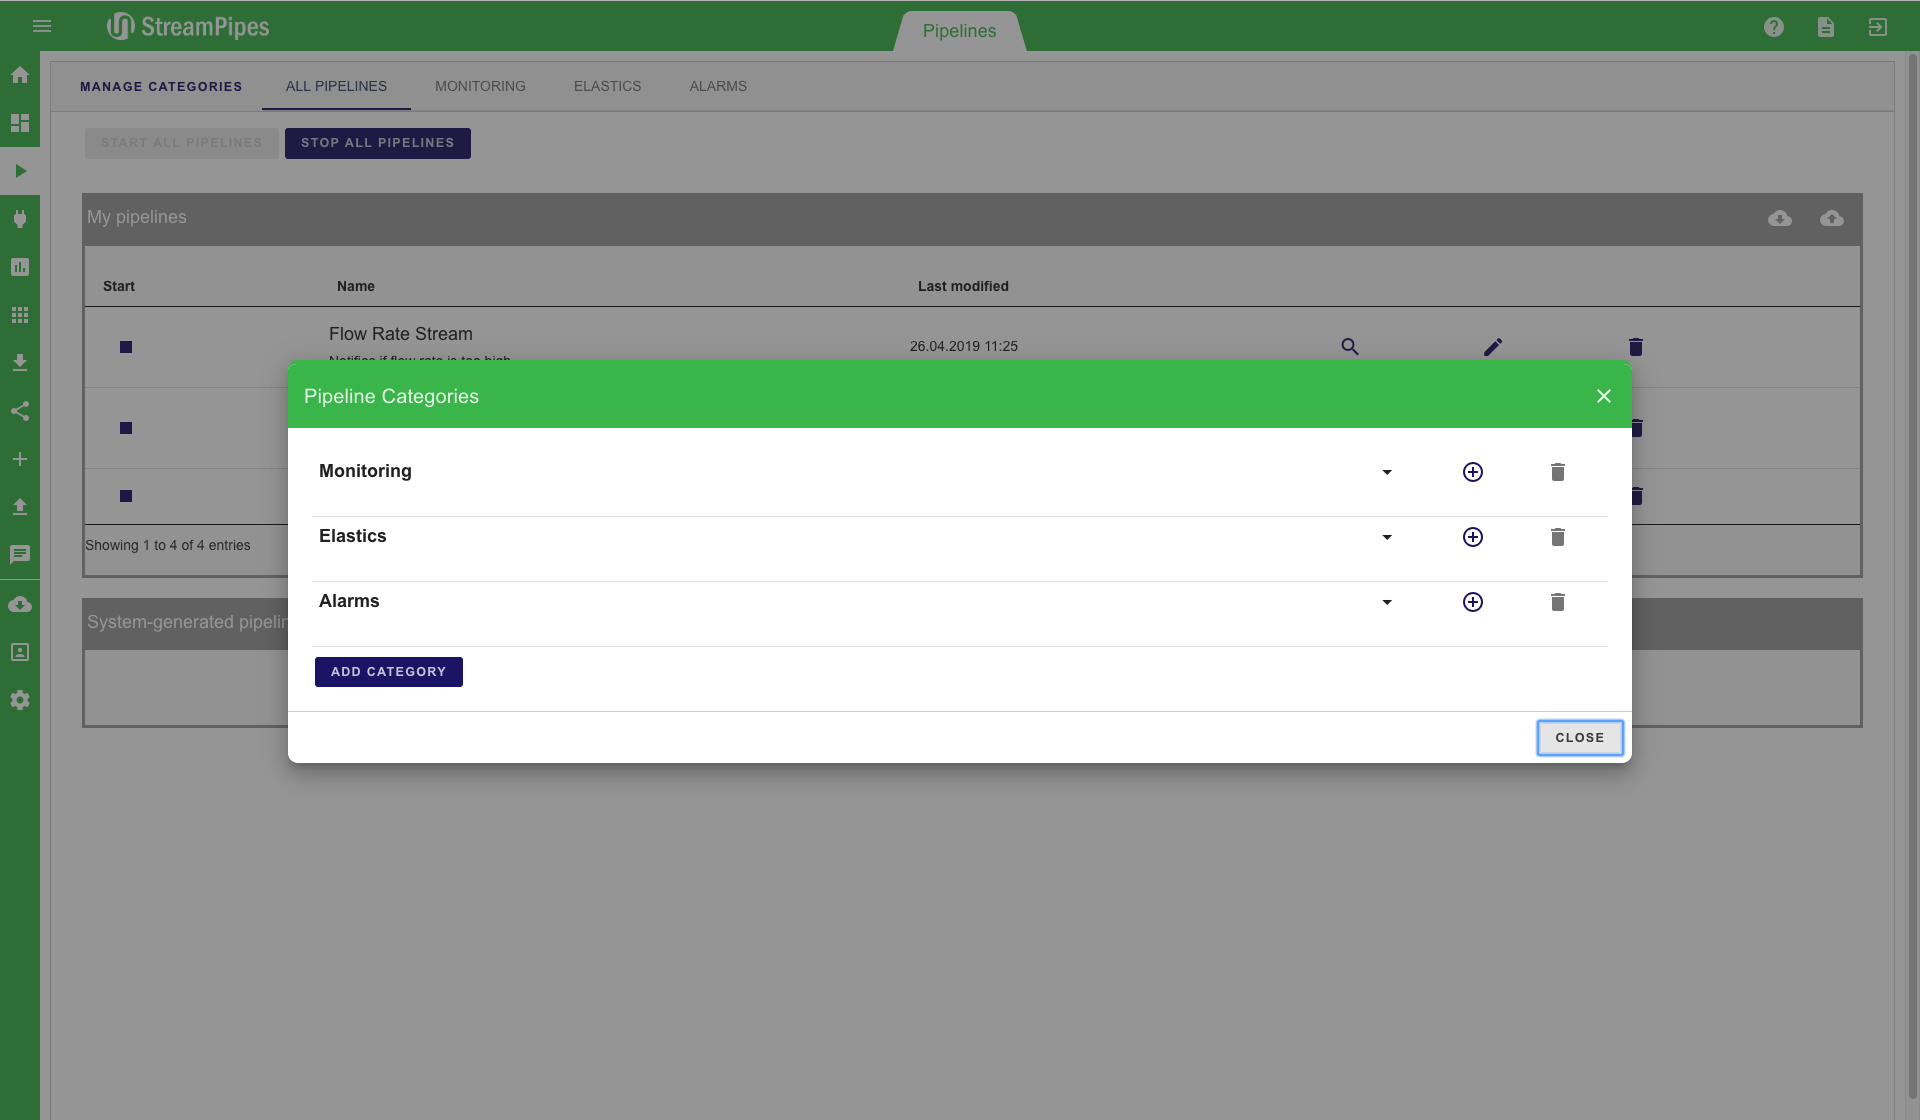
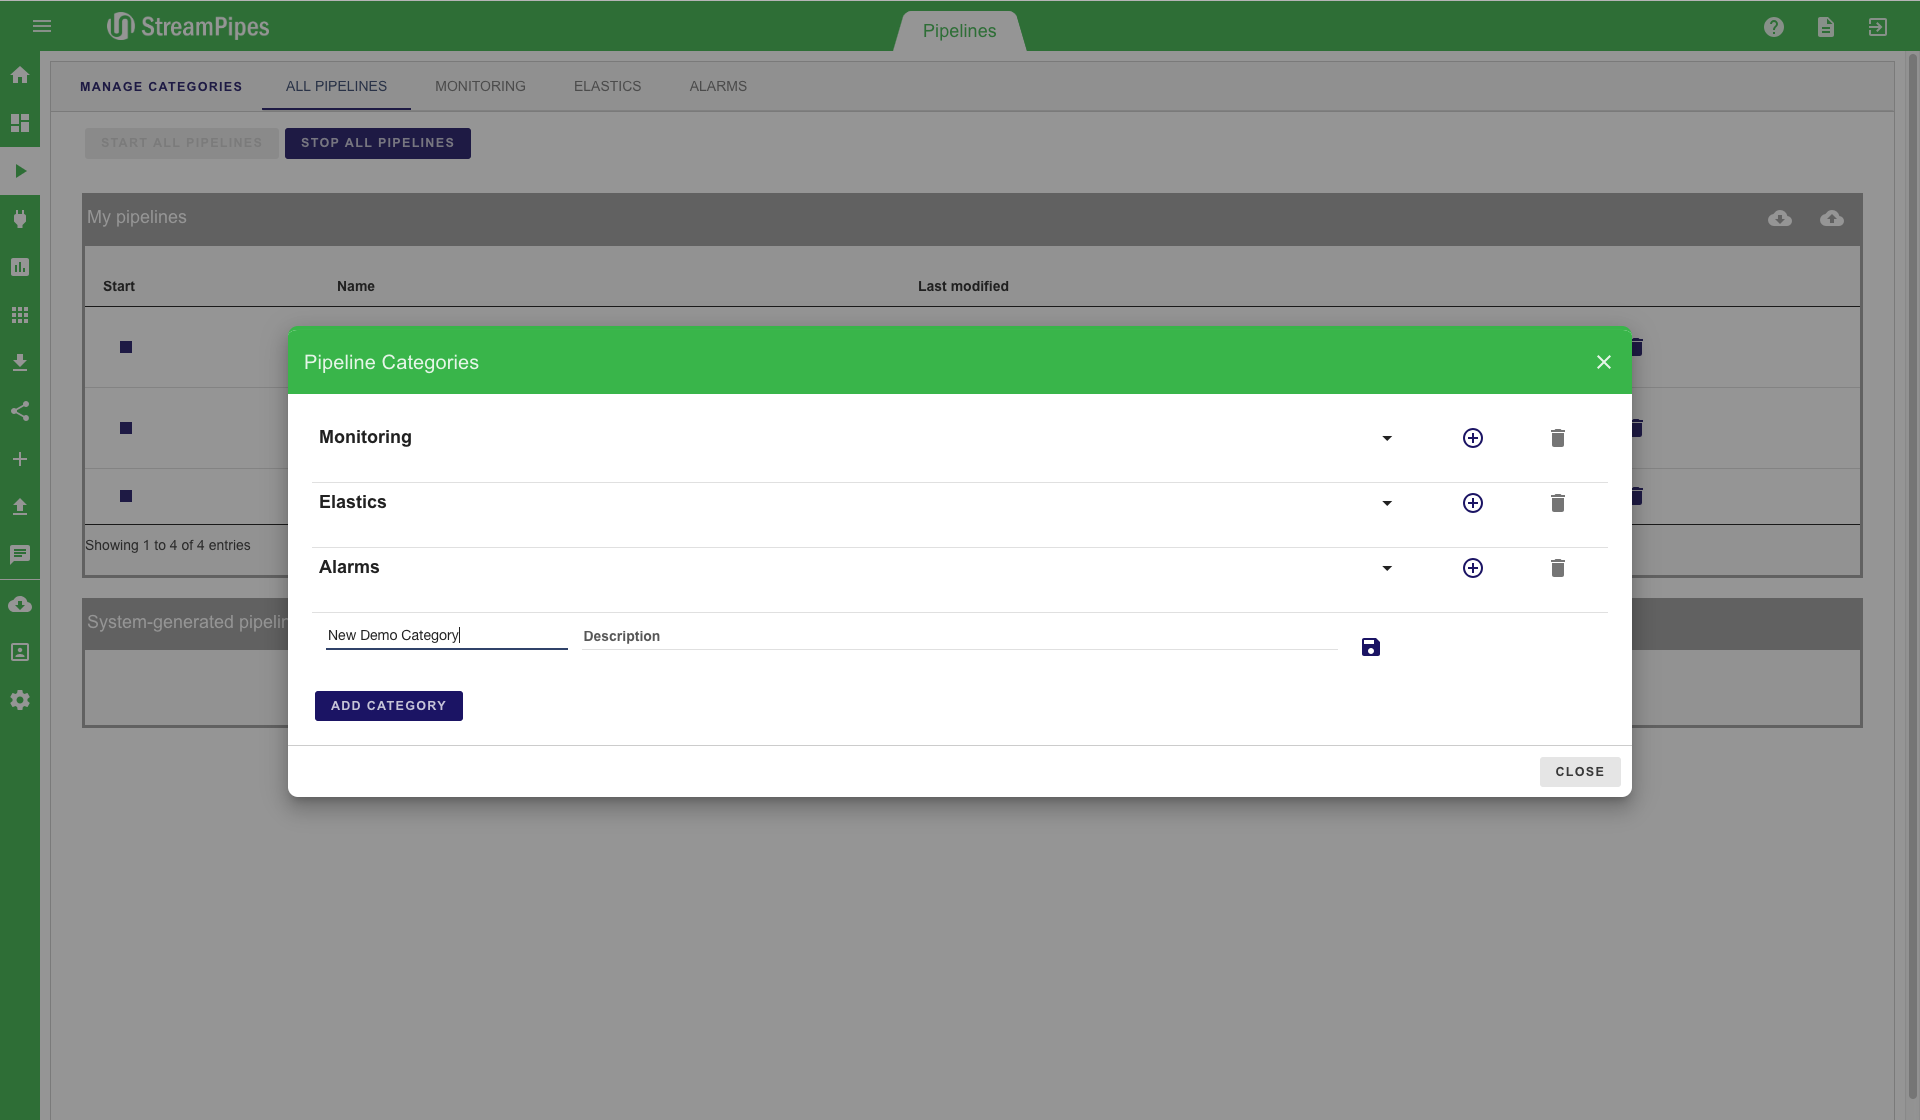
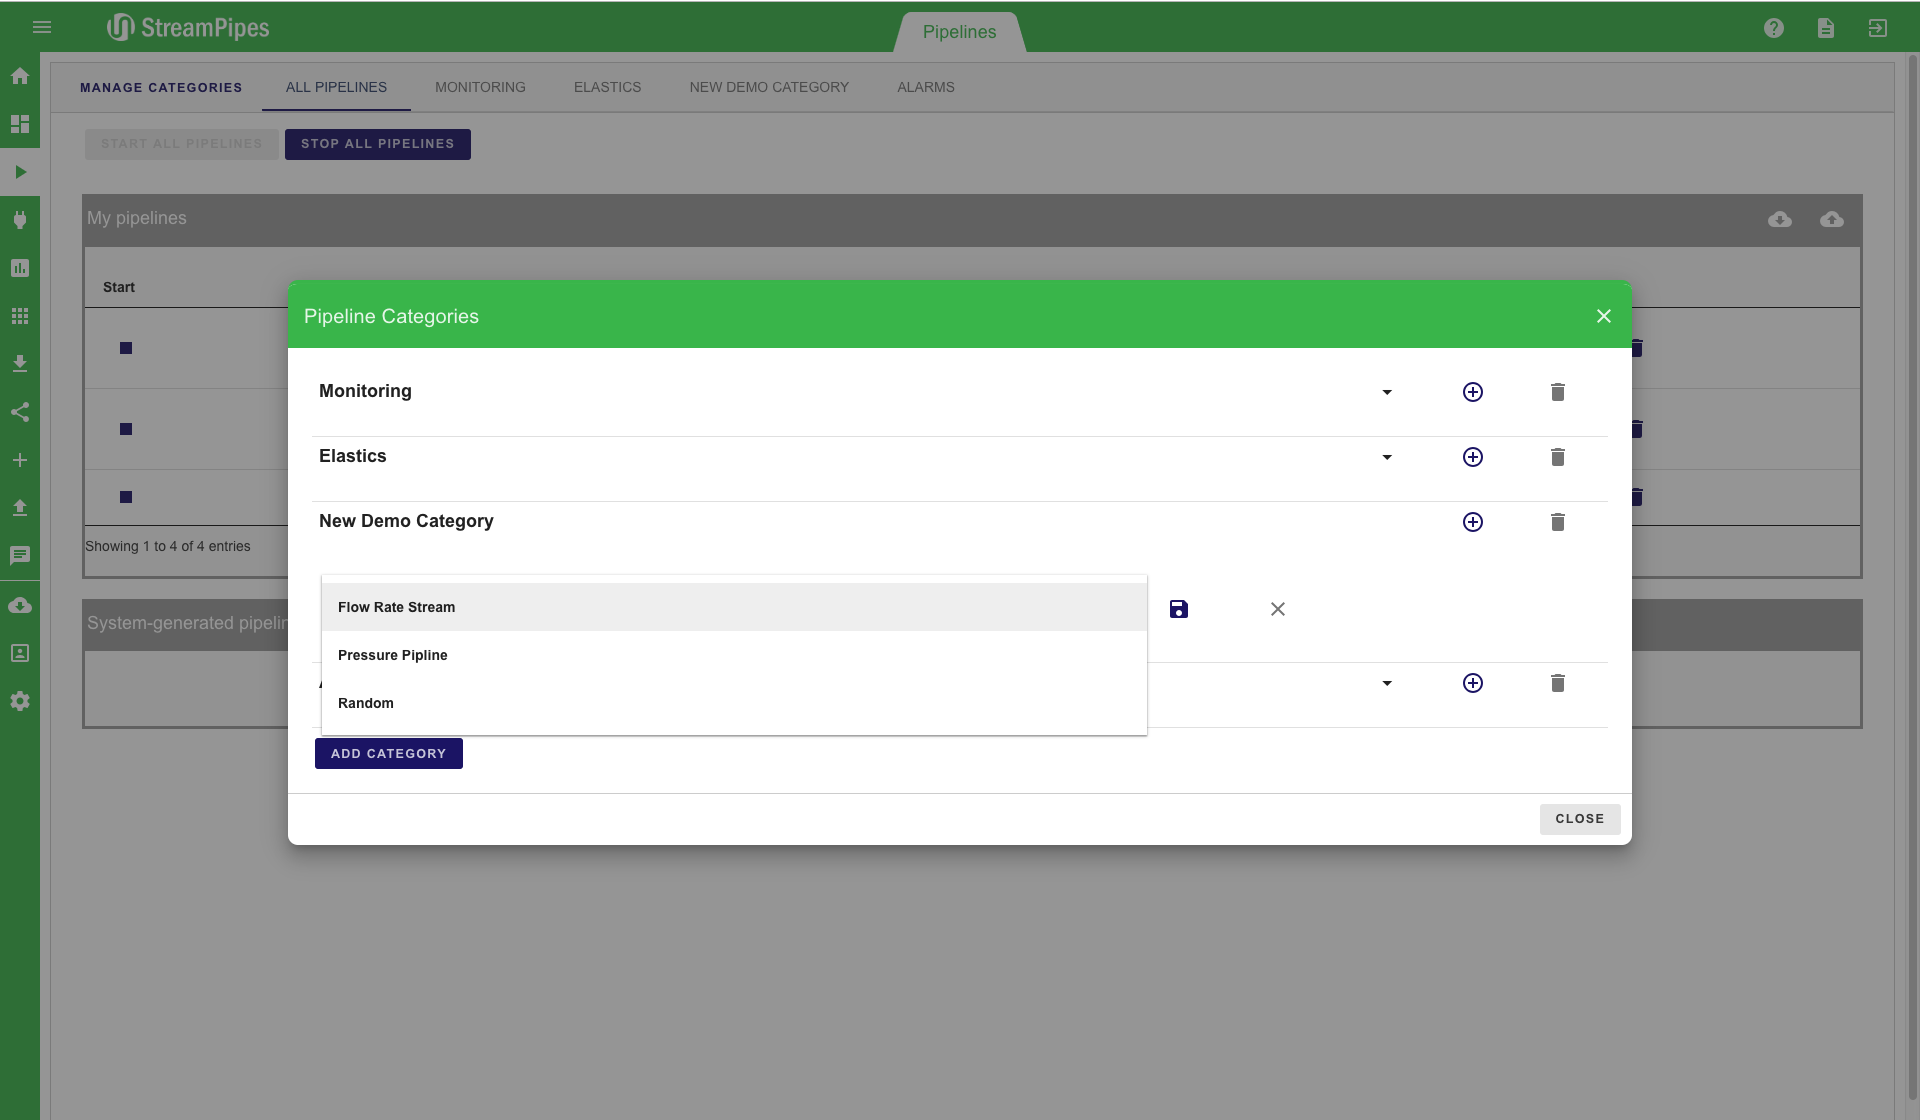
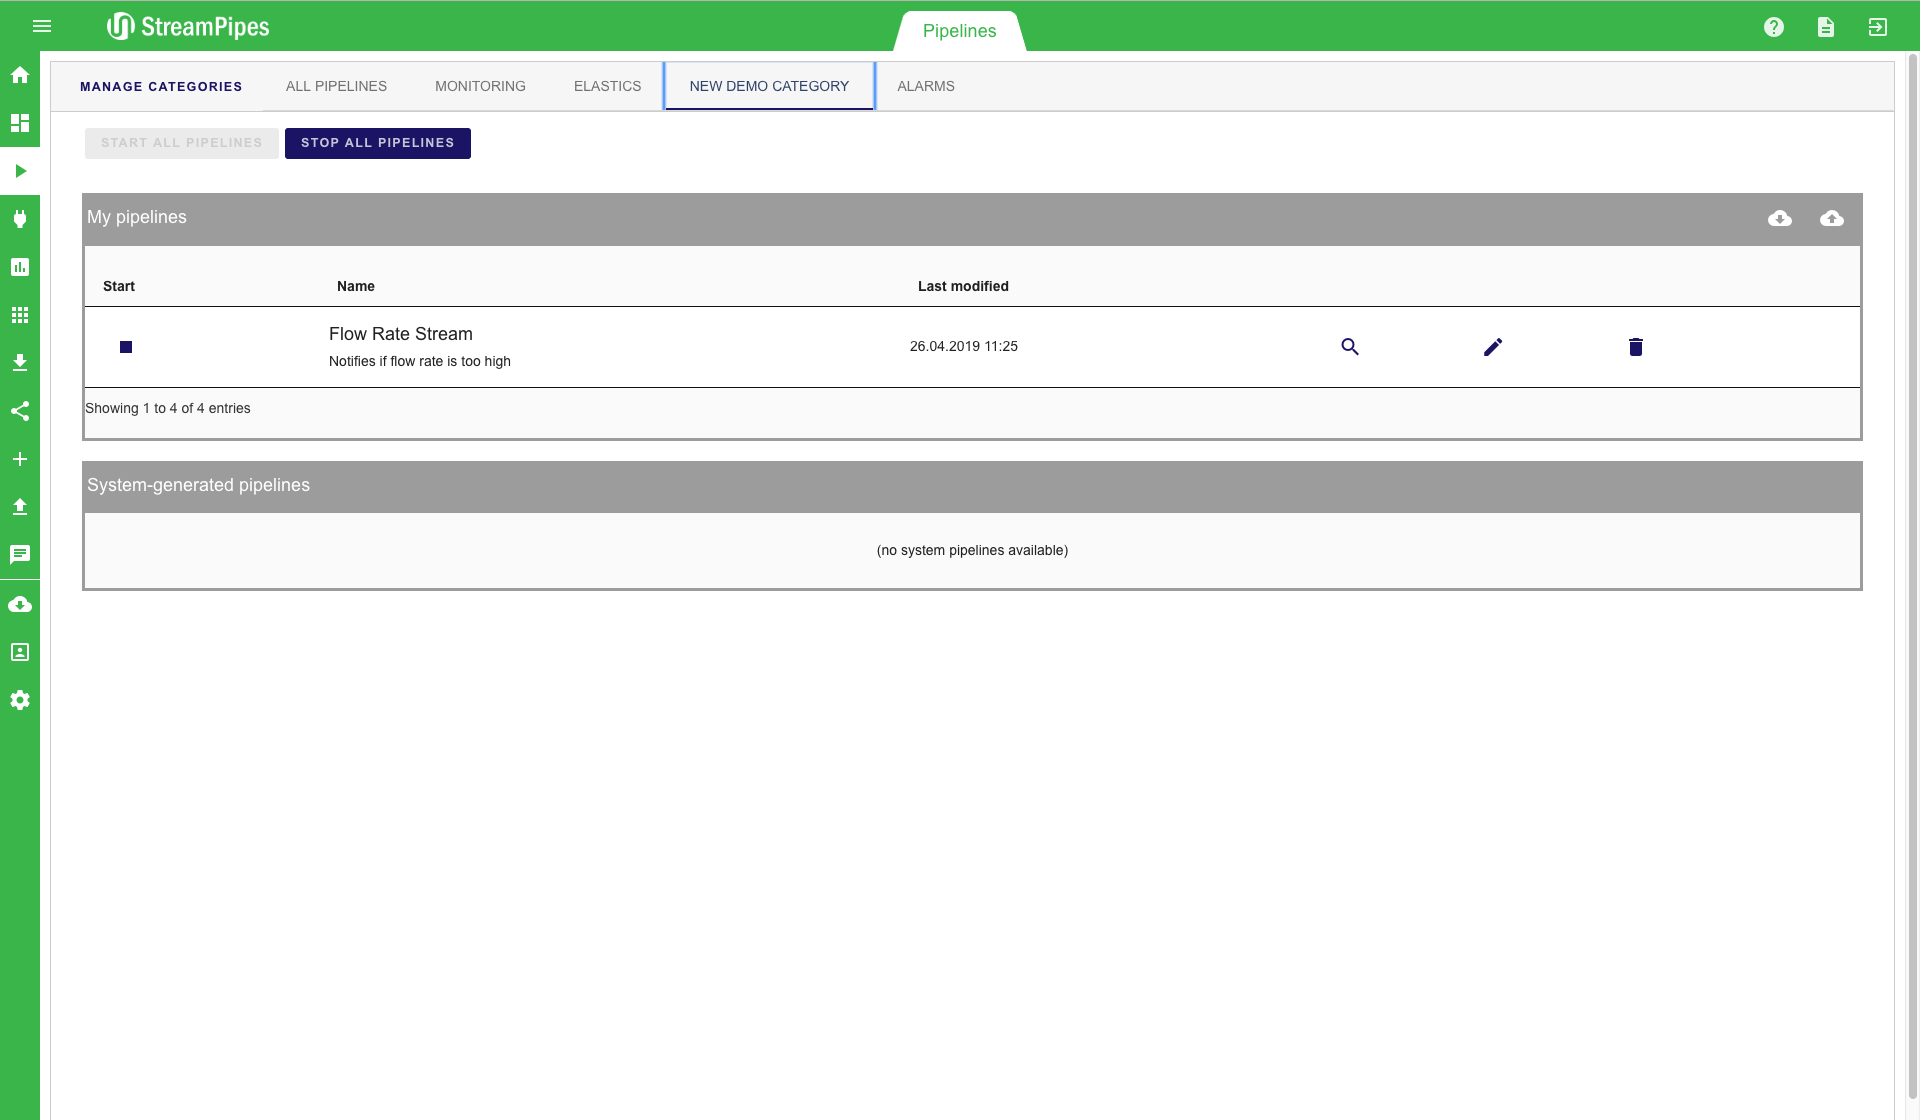
In a setting with many defined pipelines, it can get really hard to keep track of all pipelines. This is why we introduce categories. A category is a set of pipelines that can be defined by users in order to better organize pipelines. By clicking on the "Manage Categories" button on the top left, a new category can be added to StreamPipes. In this example, we create a new category named "New Demo Category". After saving a category, pipelines can be added to the newly created category. The new category is then presented as a tab in the Pipeline Management view. This tab contains all previously defined pipelines.
Live Dashboard
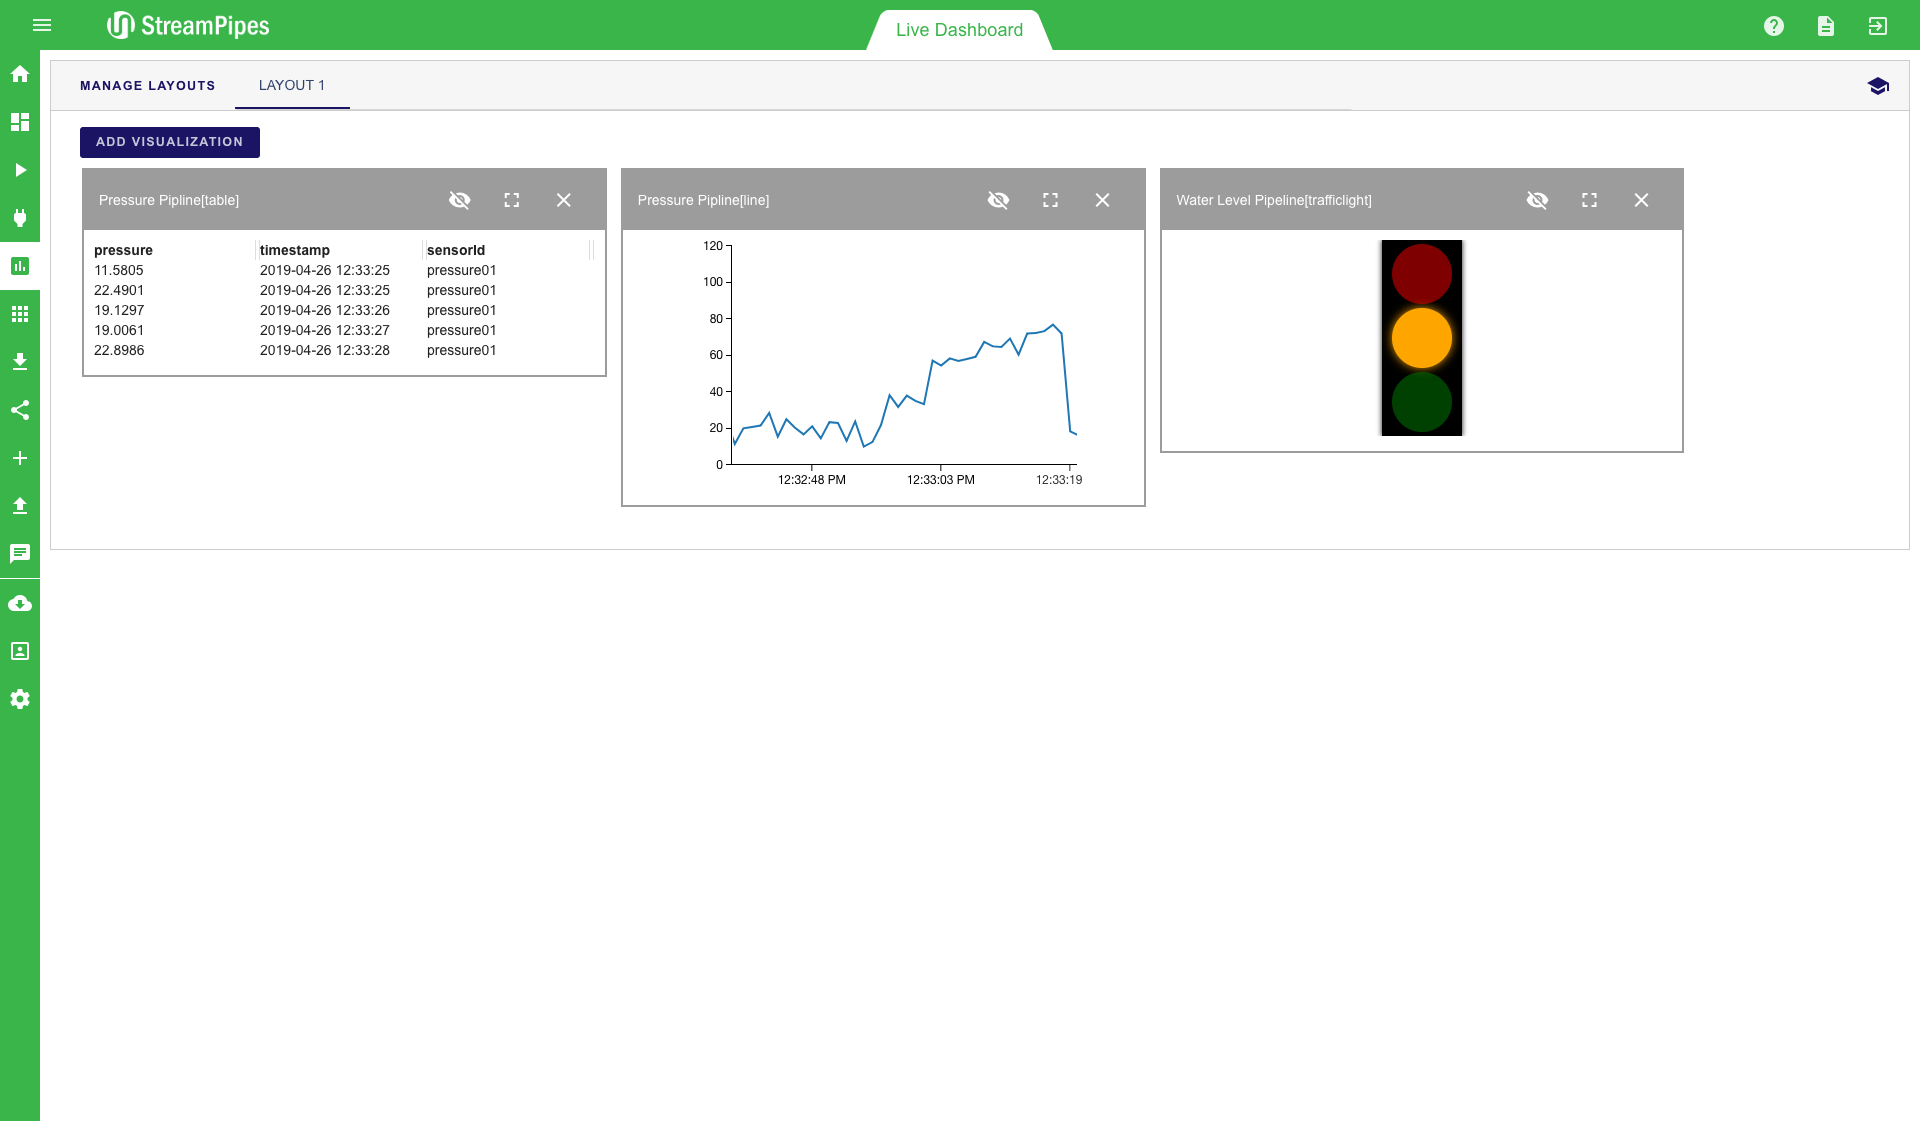
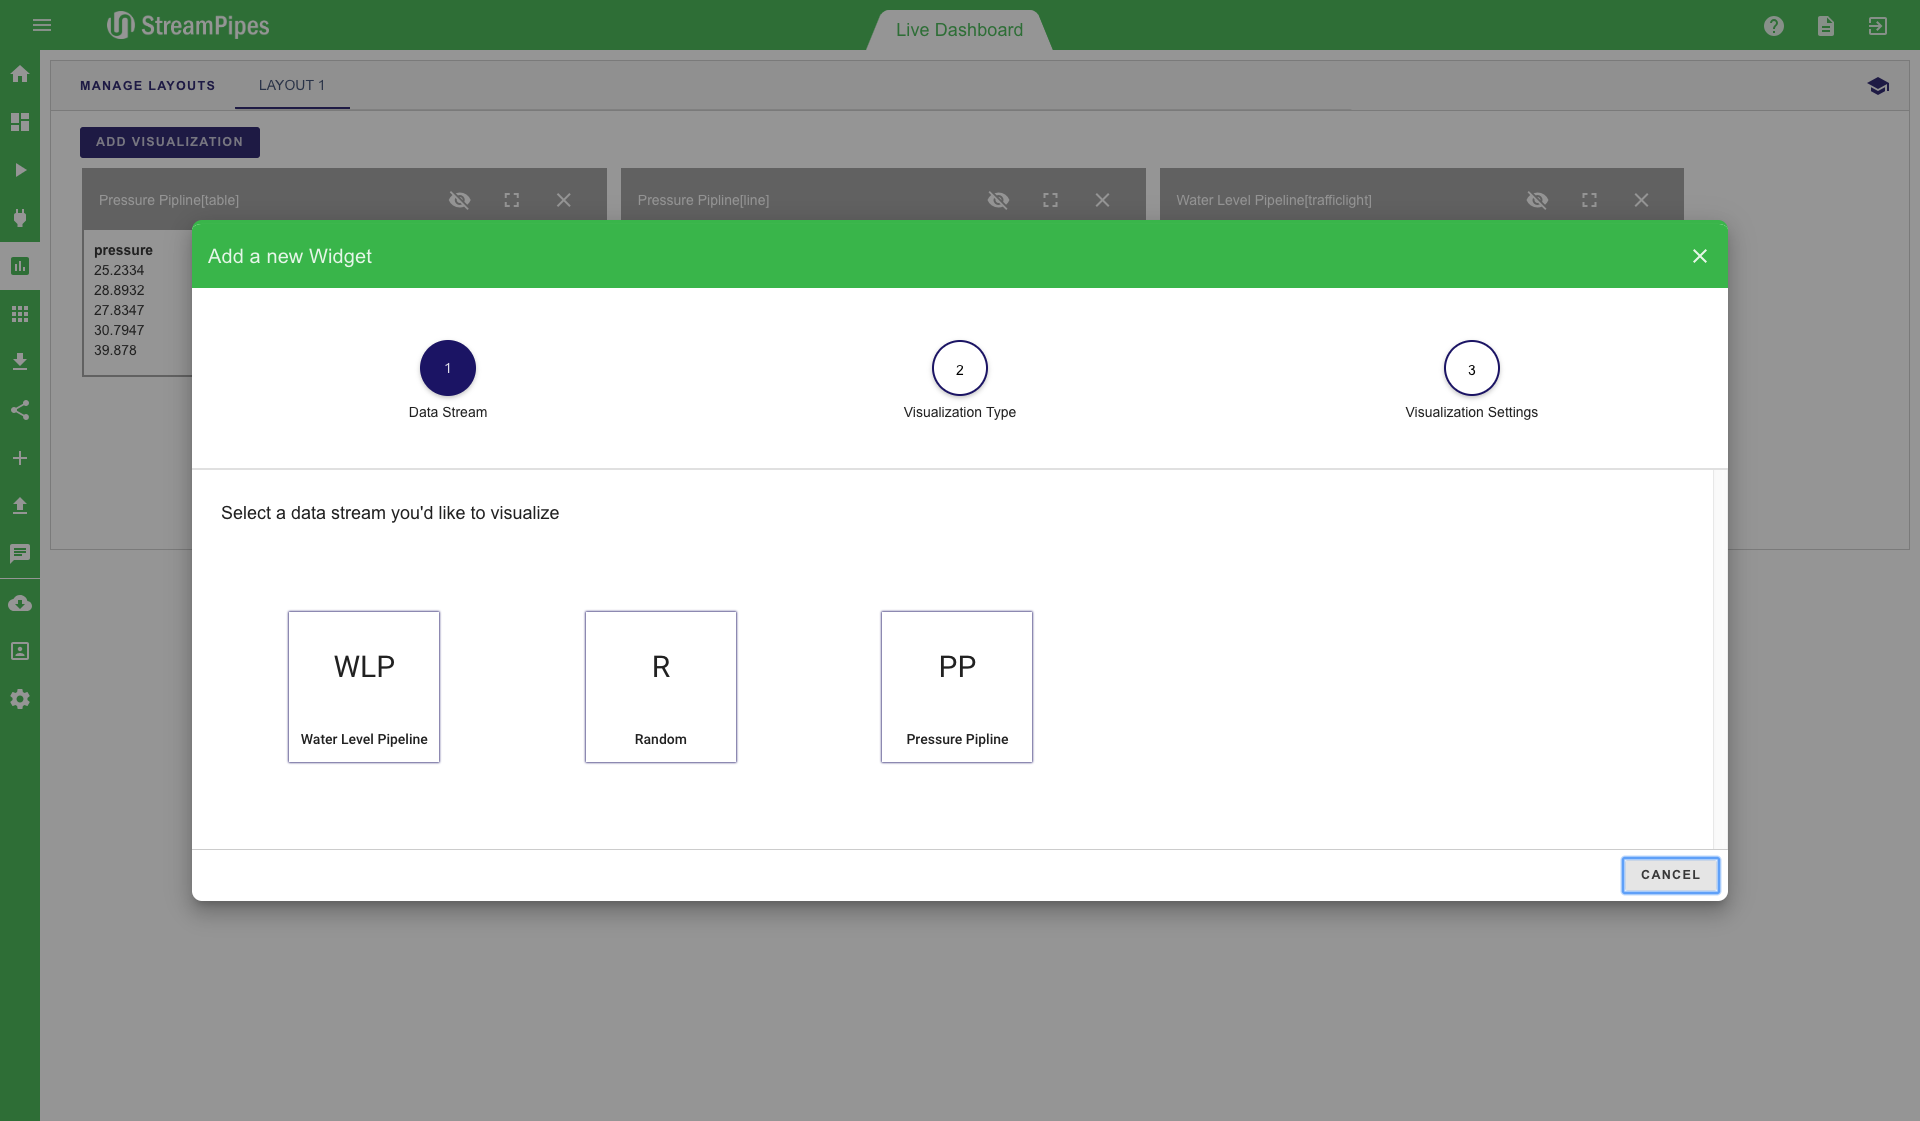
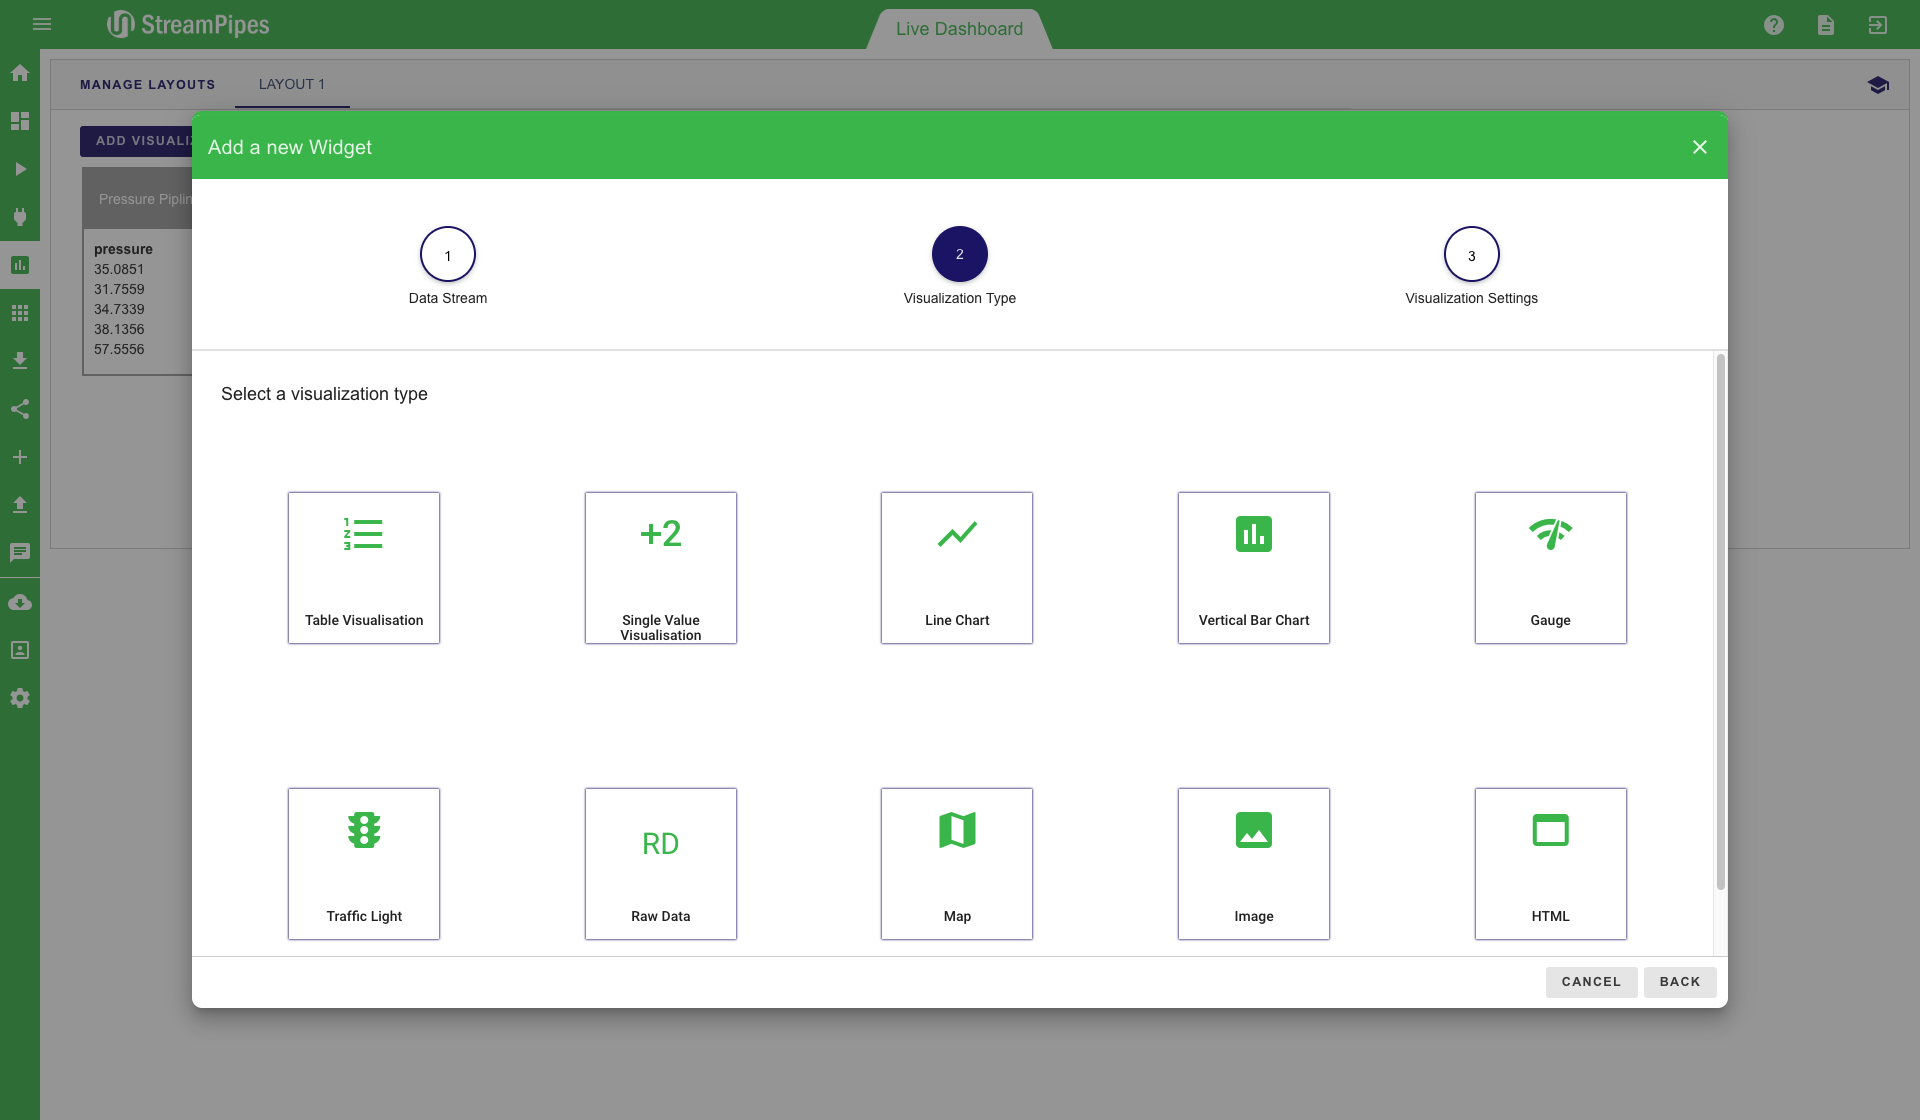
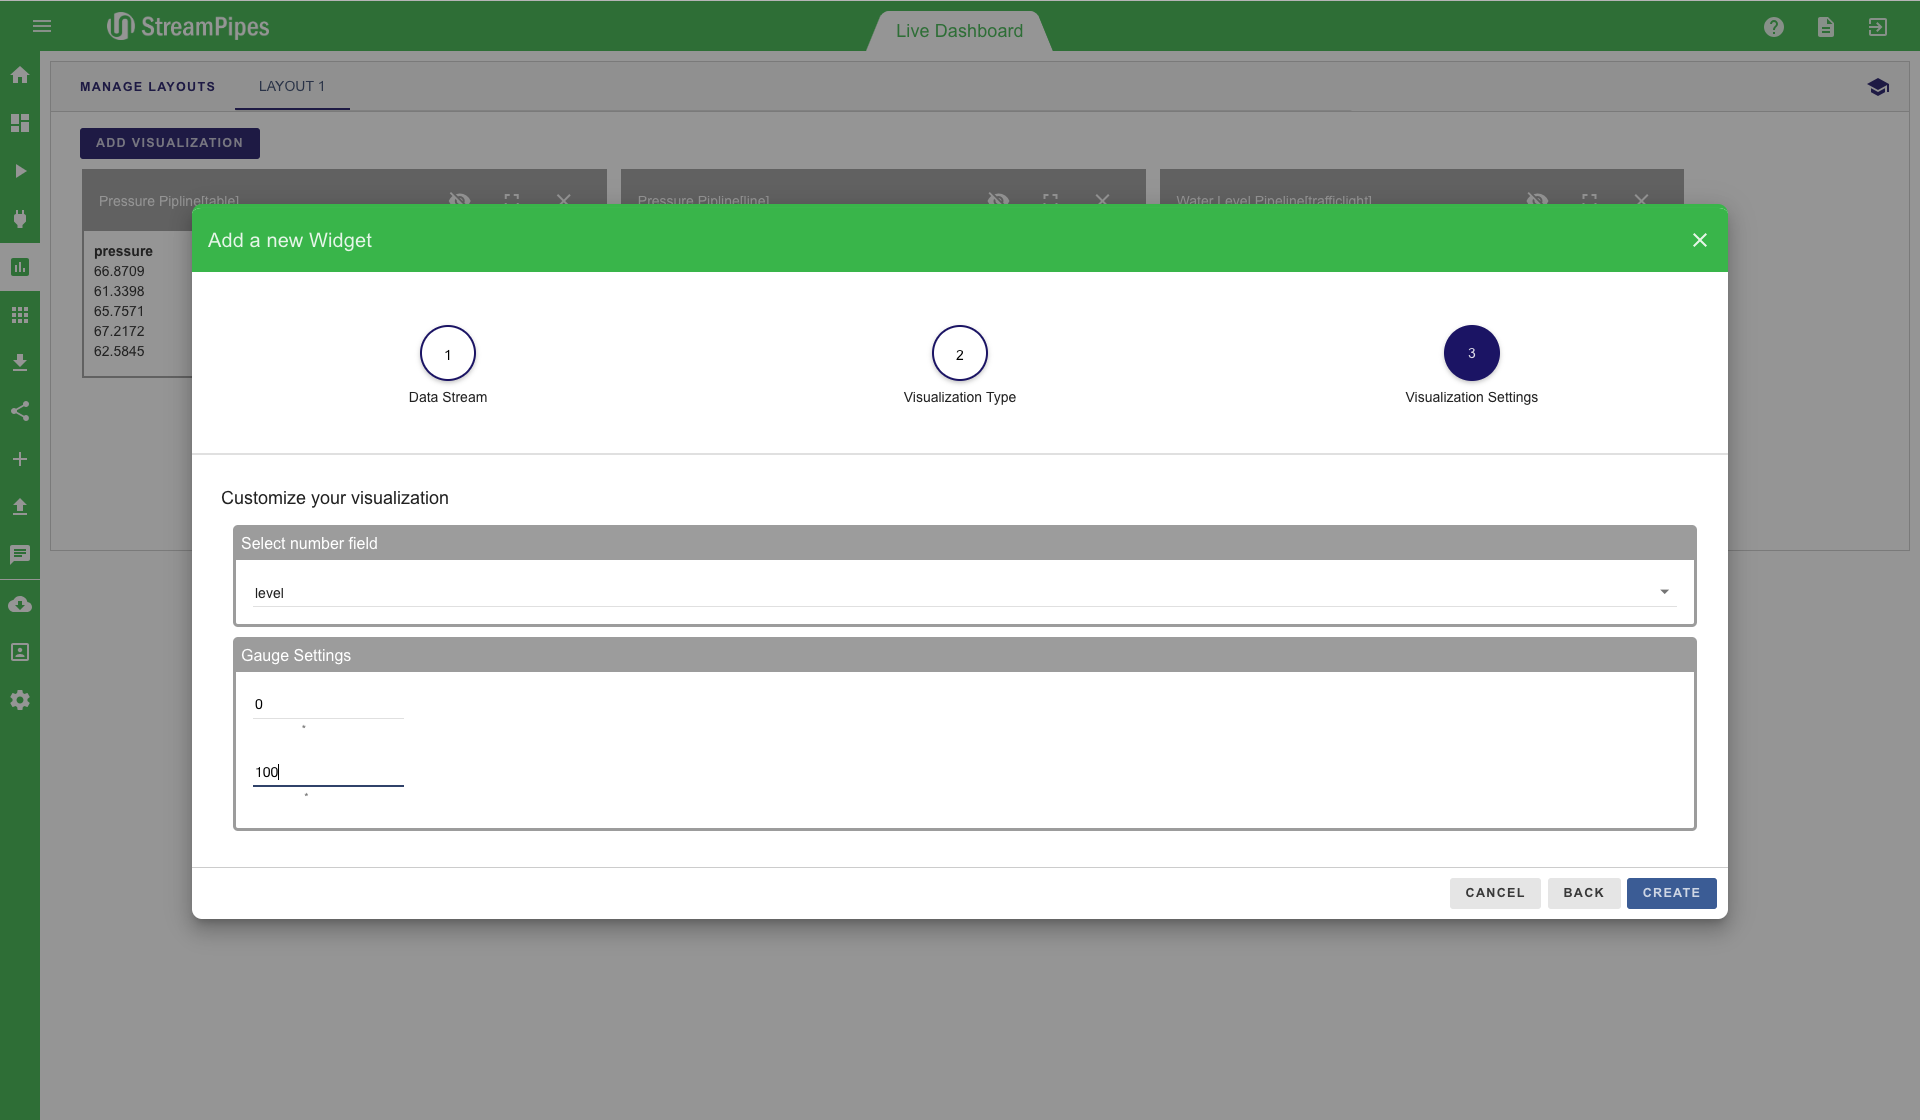
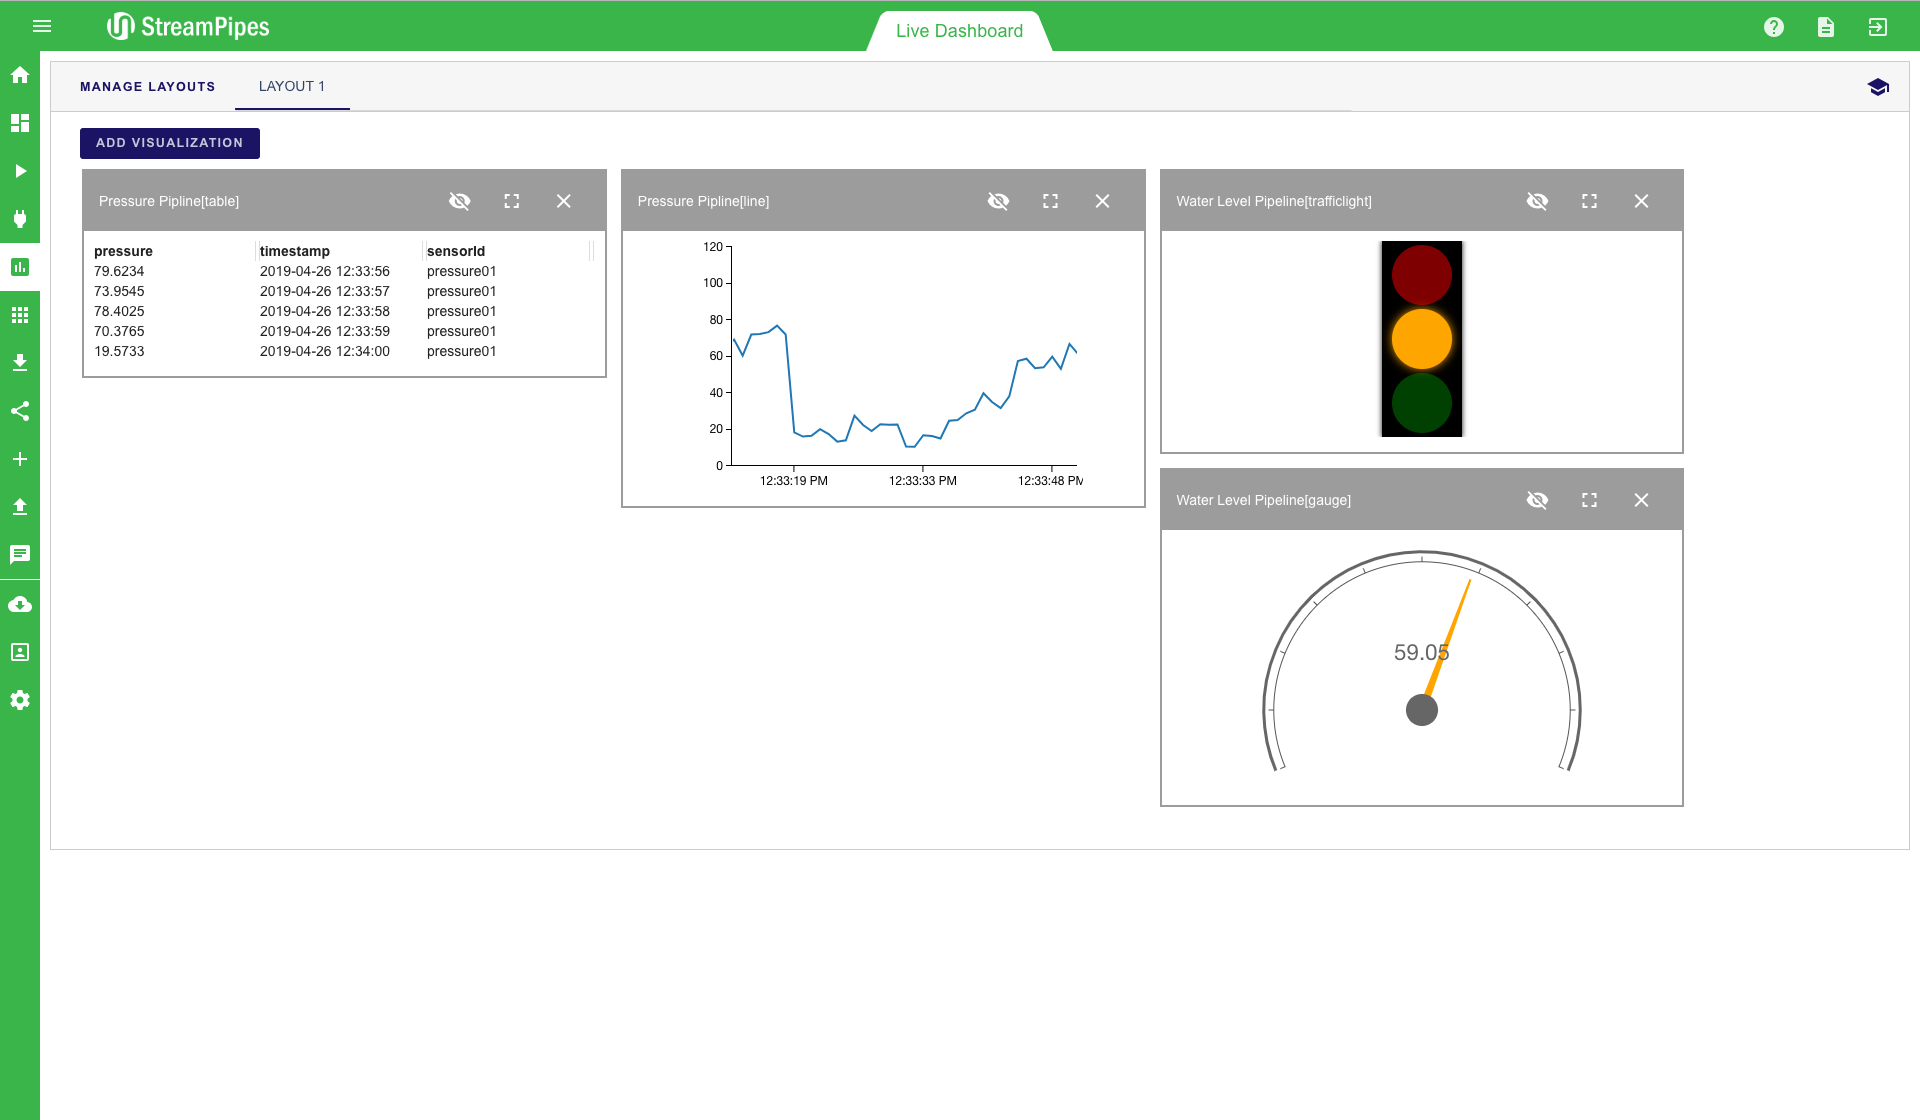
The live dashboard can be used for multiple use cases. It is a good way to live monitor a running system in a dashboard, but it can also be used during the pipeline development to get a fast feedback from newly created pipelines. Below is a screenshot of an example dashboard showing the current value of pressure, which further shows a line chart and a trafficlight for a water level pipeline. All pipelines that contain the "Dashboard Sink" can be visualized in this view. To add a new visualisation, click on the "Add visualisation" button on the top left corner. Afterwards, a three-step configuration menu is shown. The first step is to select the pipeline that should be visualized. In the second step, the type of visualization can be defined. Currently 10 different types are available, including line charts, various map visualizations and data tables. After selecting the type (in our example "Gauge"), you can select the specific measurement values of the data stream that should be displayed. In the example below, the water level value should be monitored and the gauge value should range from 0 to 100. Once all steps are completed, the new visualization is placed on the dashboard and live data is presented as soon as it becomes available.
File Download
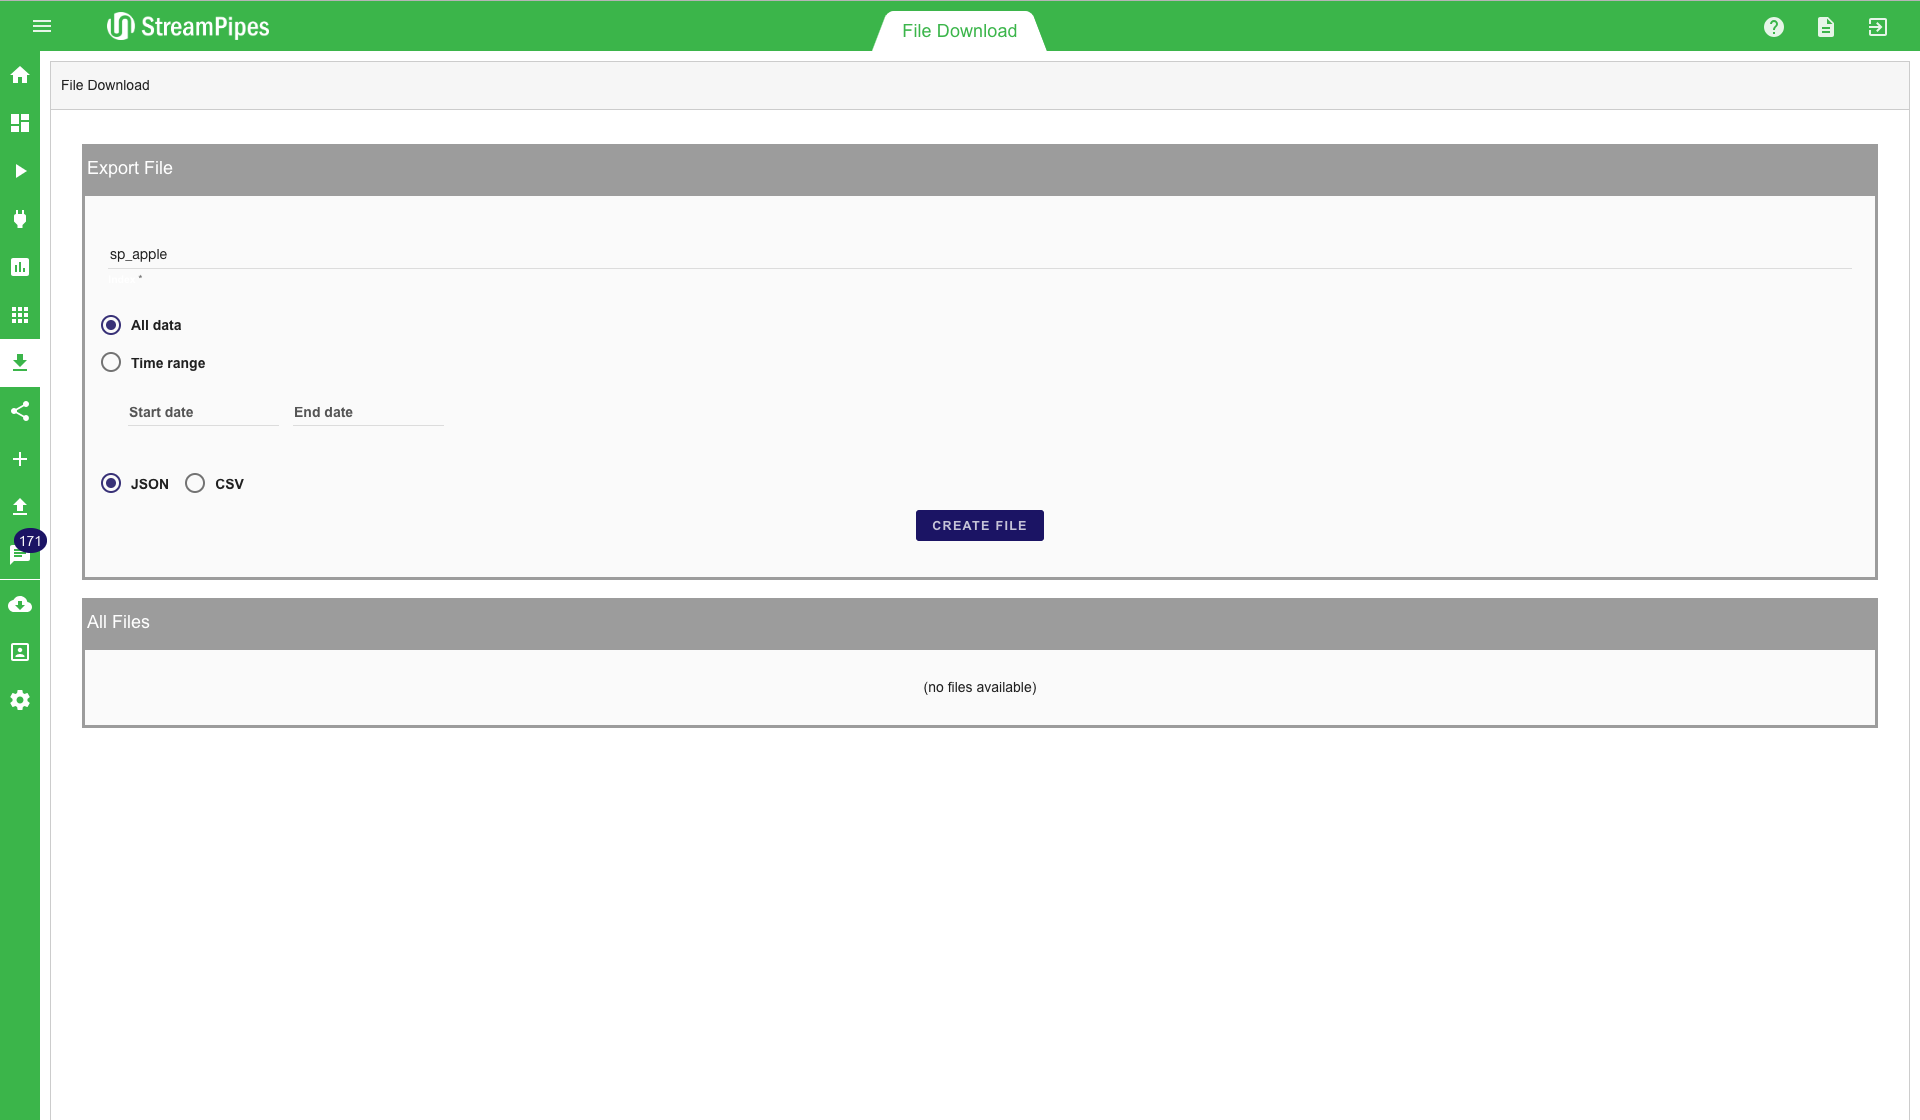
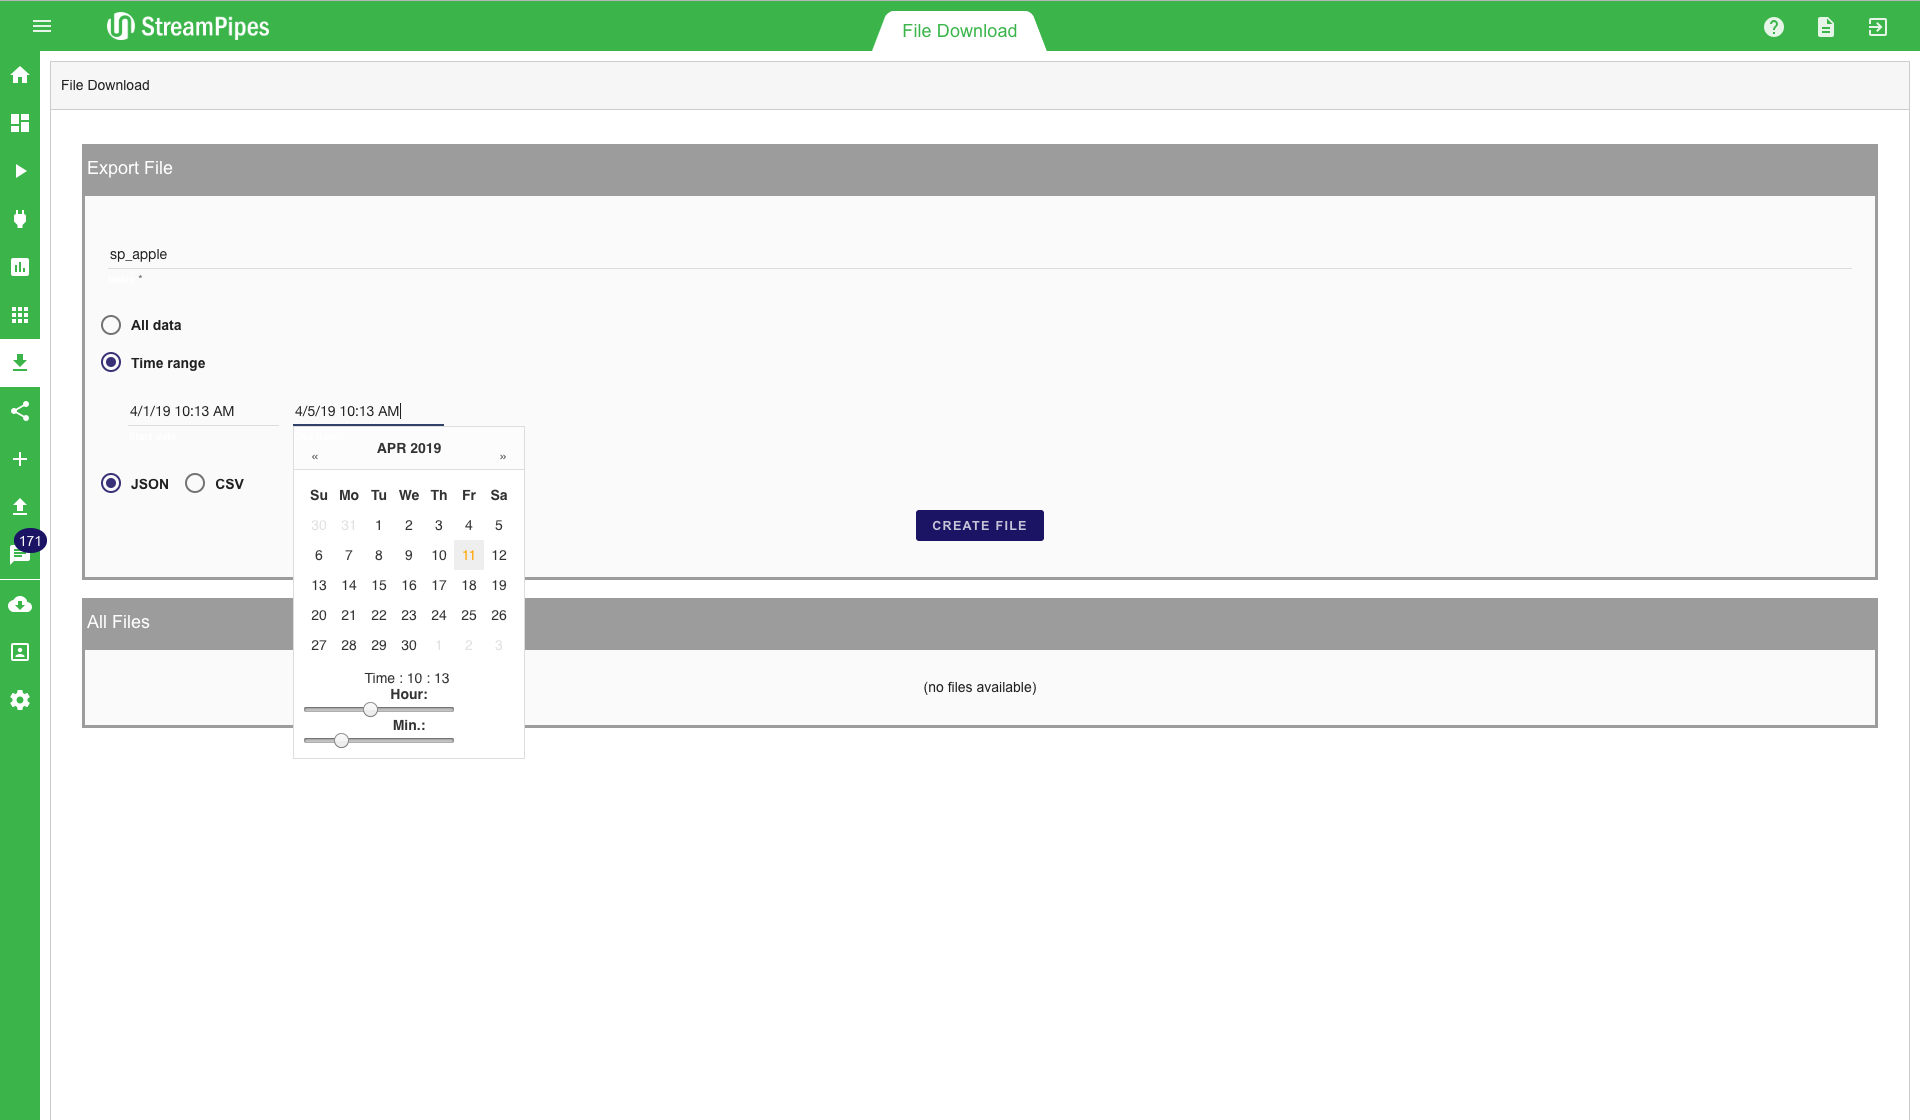
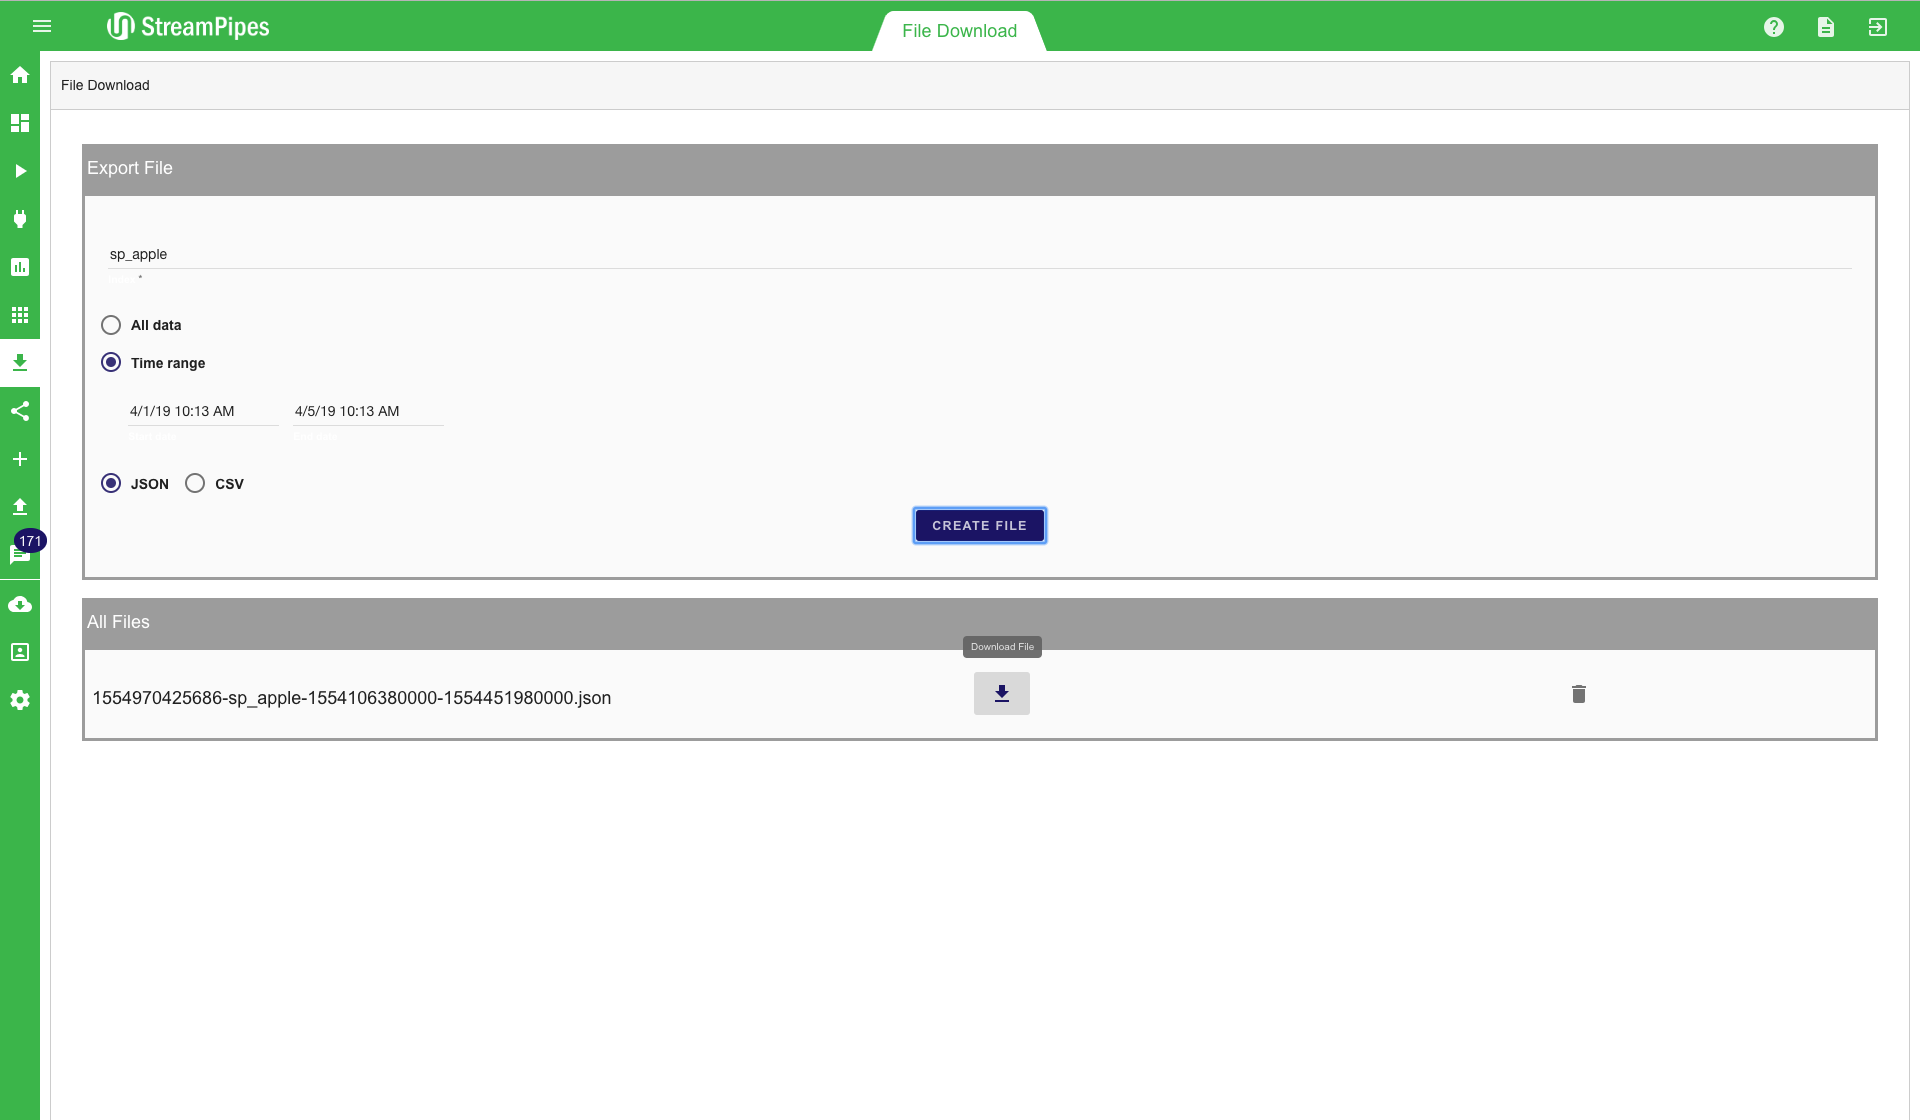
With the file download, it is possible to download stored files directly from Elasticsearch. This can be very useful for example when a data dumb is needed for a specific time range. All data that is written into Elasticsearch using the Elasticsearch Sink can be accessed by the file downloader. A common use case is to download data for offline analysis and to train a machine learning algorithm. First, an index must be defined, afterwards, the time range must be set. A date picker helps users to enter the time range. When a user clicks the "Create File" button the file is created. All files stored on the server can be downloaded via the download button. If the files are not longer needed, they can be deleted by clicking the delete button. This will remove the file from the server. Since data is stored in Elasticsearch anyways. it is recommended not to store the files for a longer period of time on the server. When a file is needed again at a later point in time it is easy to create it again. This way a lot of disk space on the server can be saved, especially when the files are rather large.
Notifications
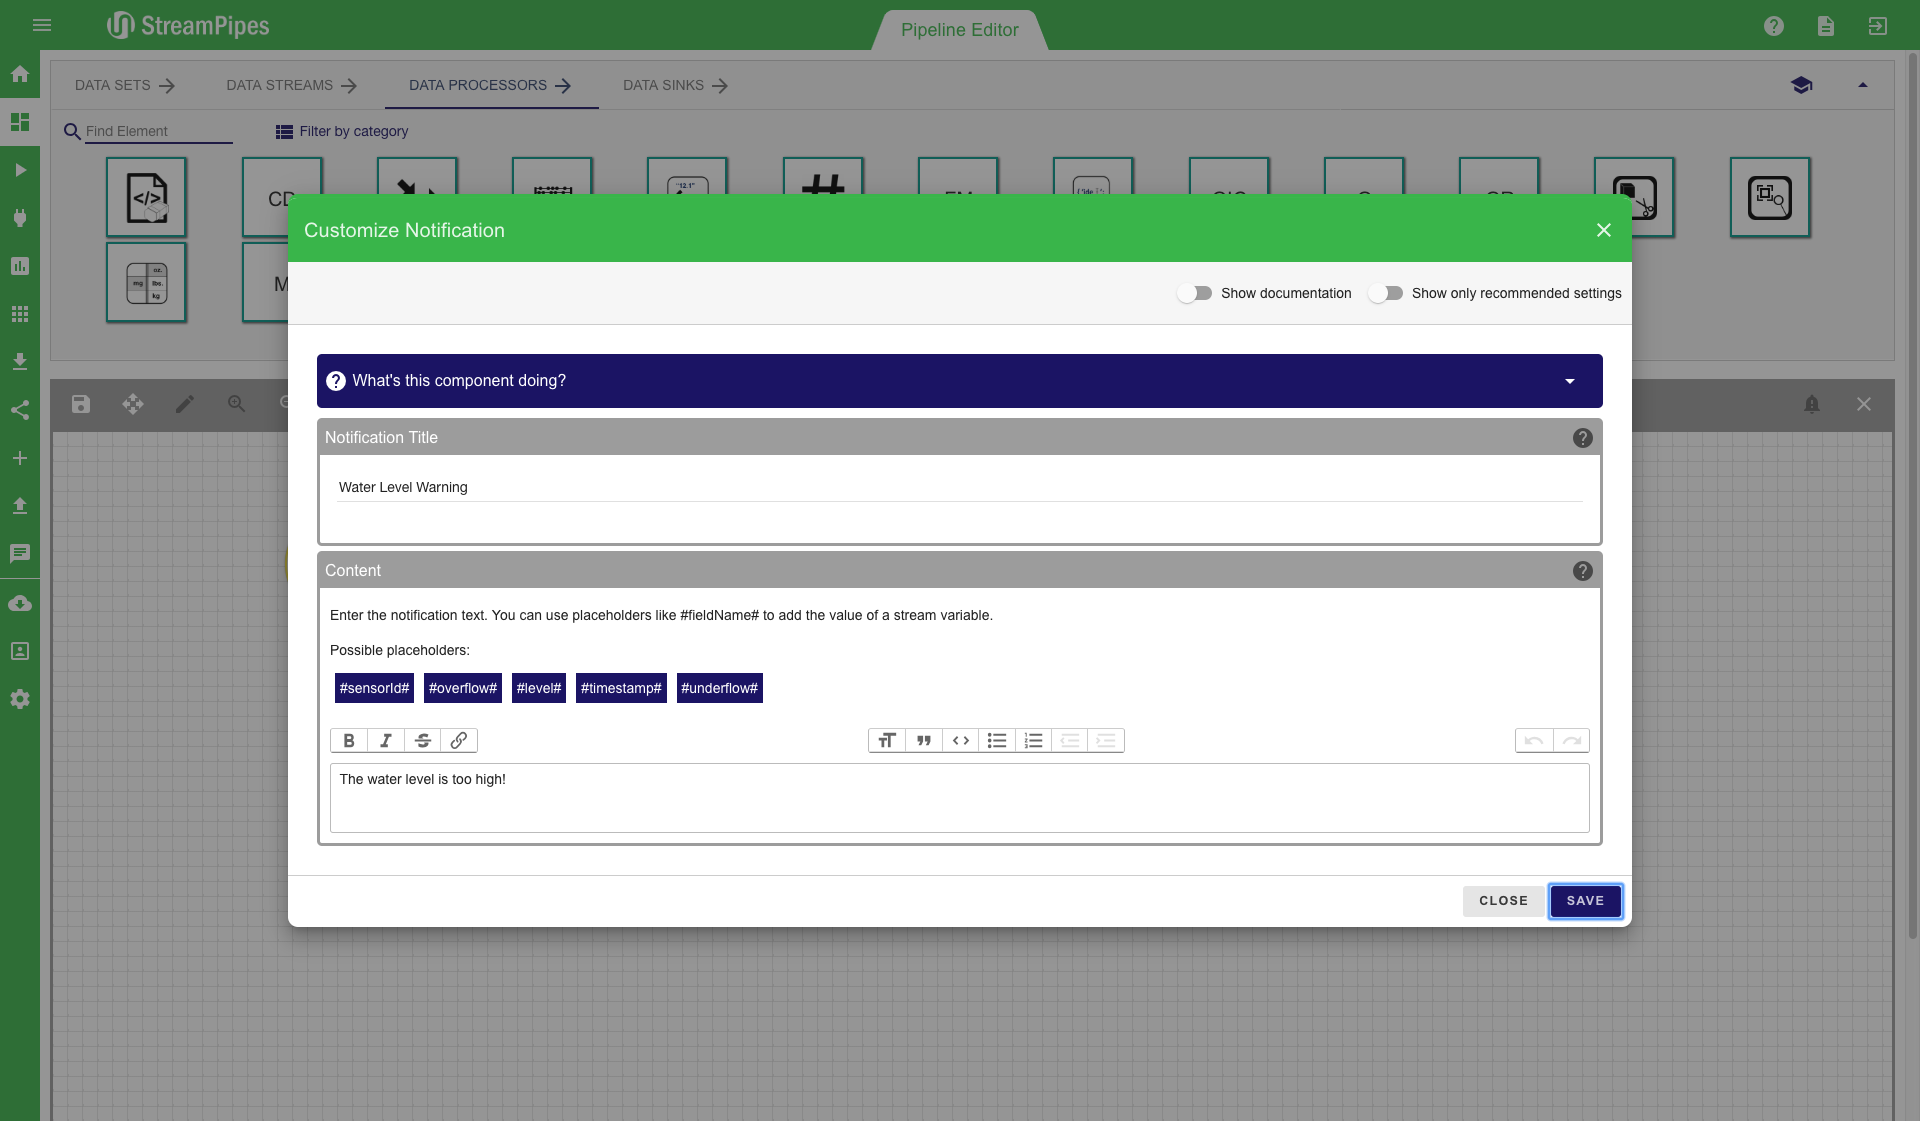
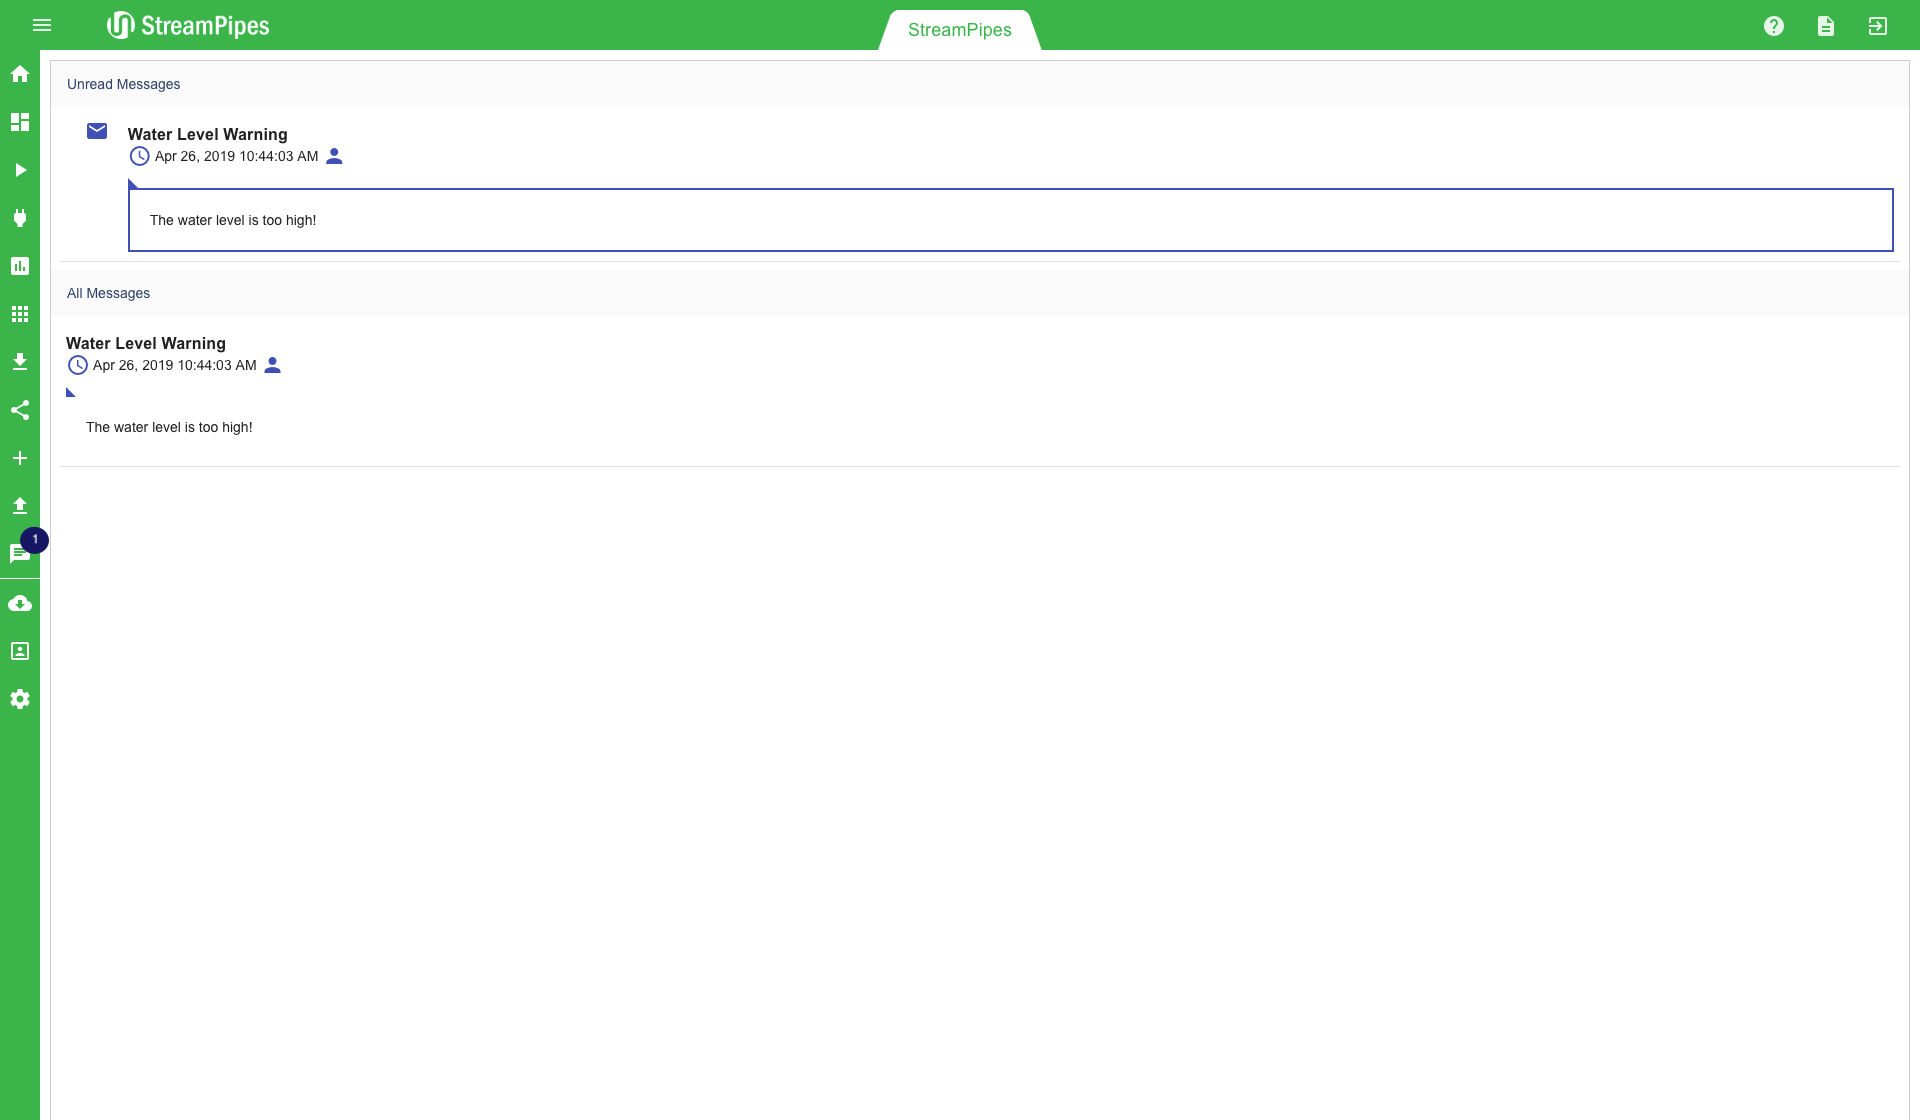
Notifications are a good solution to notify someone when a urgent situation occurs. A notification can be created by using the notification sink in the pipeline editor. When using such a sink a configuration dialogue is presented to the user. In this dialogue the user must provide enough information to resolve the solution when it occurs. The message can be nicely configured in the message editor. It is also possible to embed values of the event that triggered the notification. This can be done with the #property# notation. All available properties are presented in the notification configurator. When the notification is triggered the #property# template is replaced with the actual value of the property.
A pop up icon on the notification tab in the menu shows the user how many unread notifications currently are in the system. This icon also alerts users when new notifications occur. In the notification overview all notifications are listed. On the top are the new notifications that are not read yet. A user can mark them as read by clicking on the little envelope icon. Those notifications are then no longer in the unread section, but they remain in the "All Messages" view. This way it is possible to keep track of all notifications and have a look at them at a later point in time.
Install Pipeline Elements
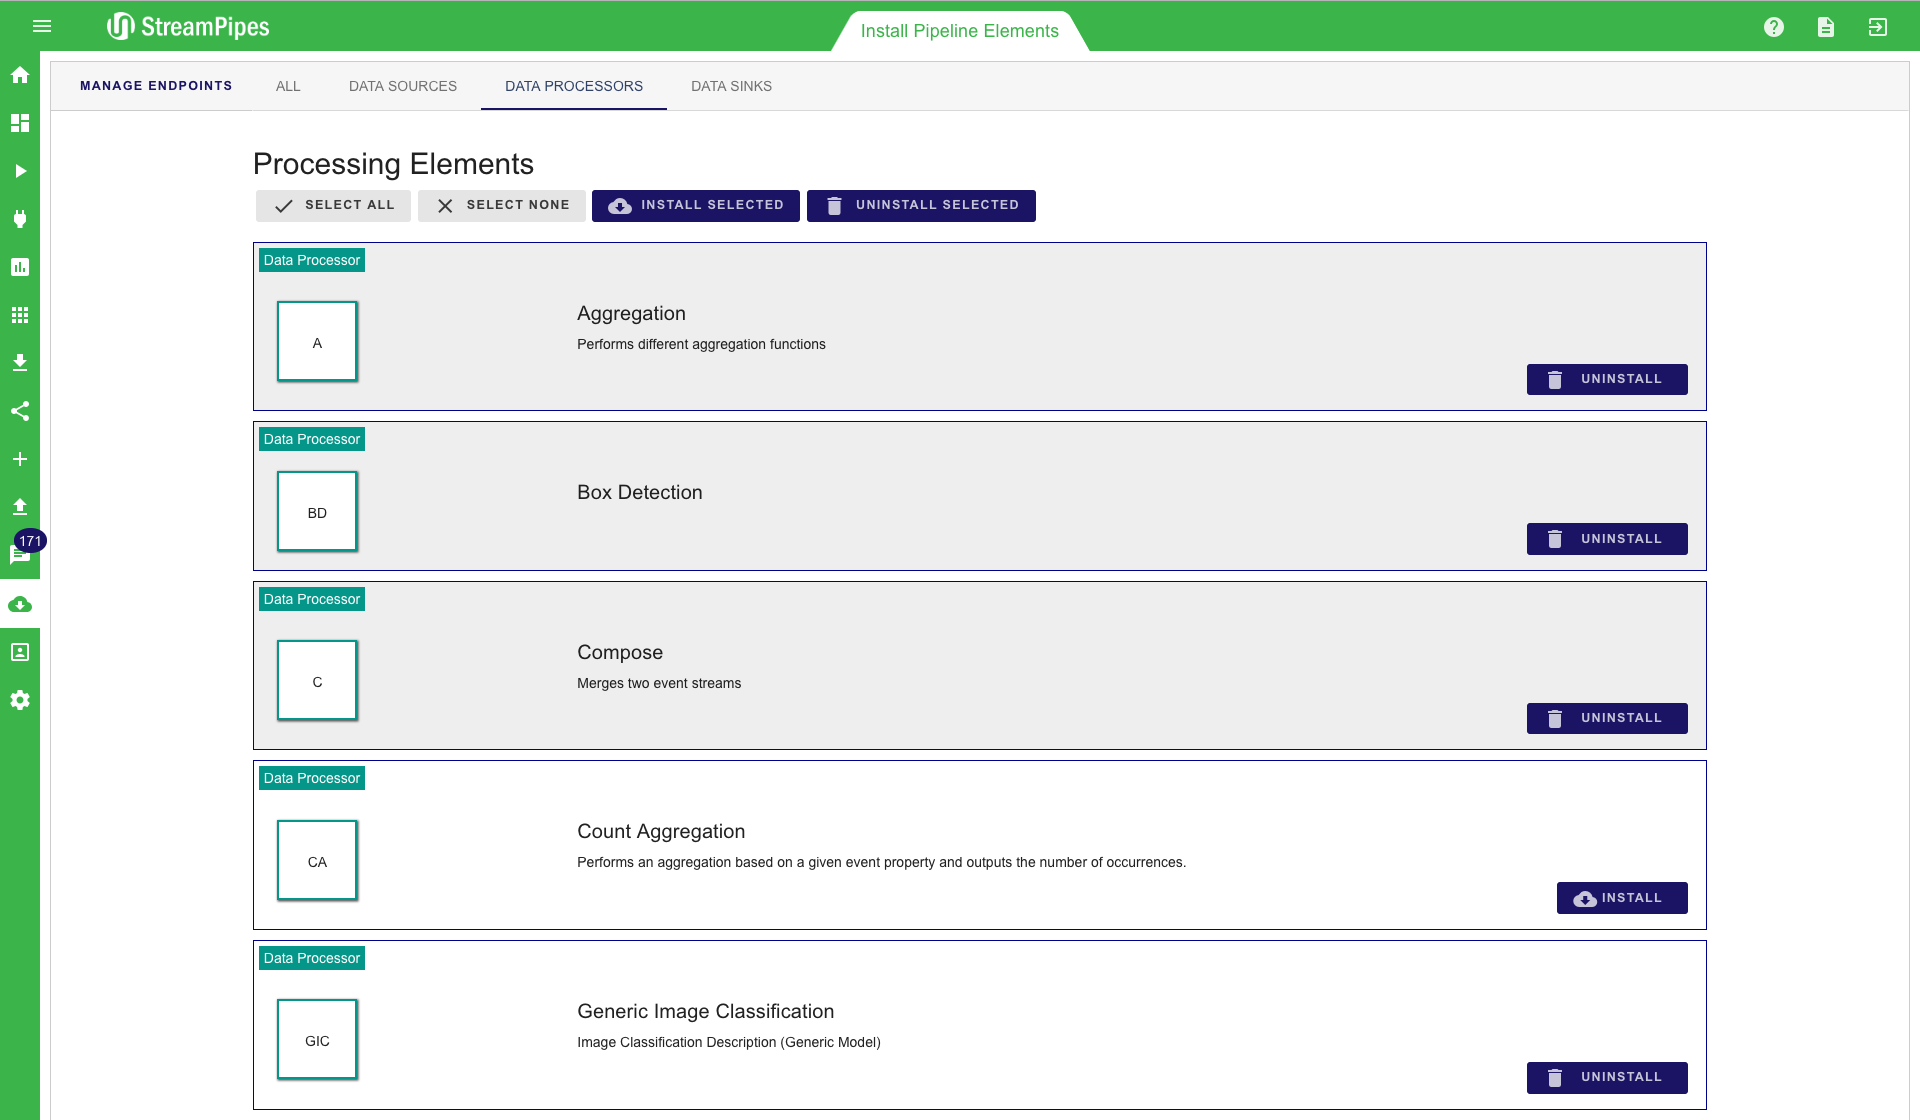
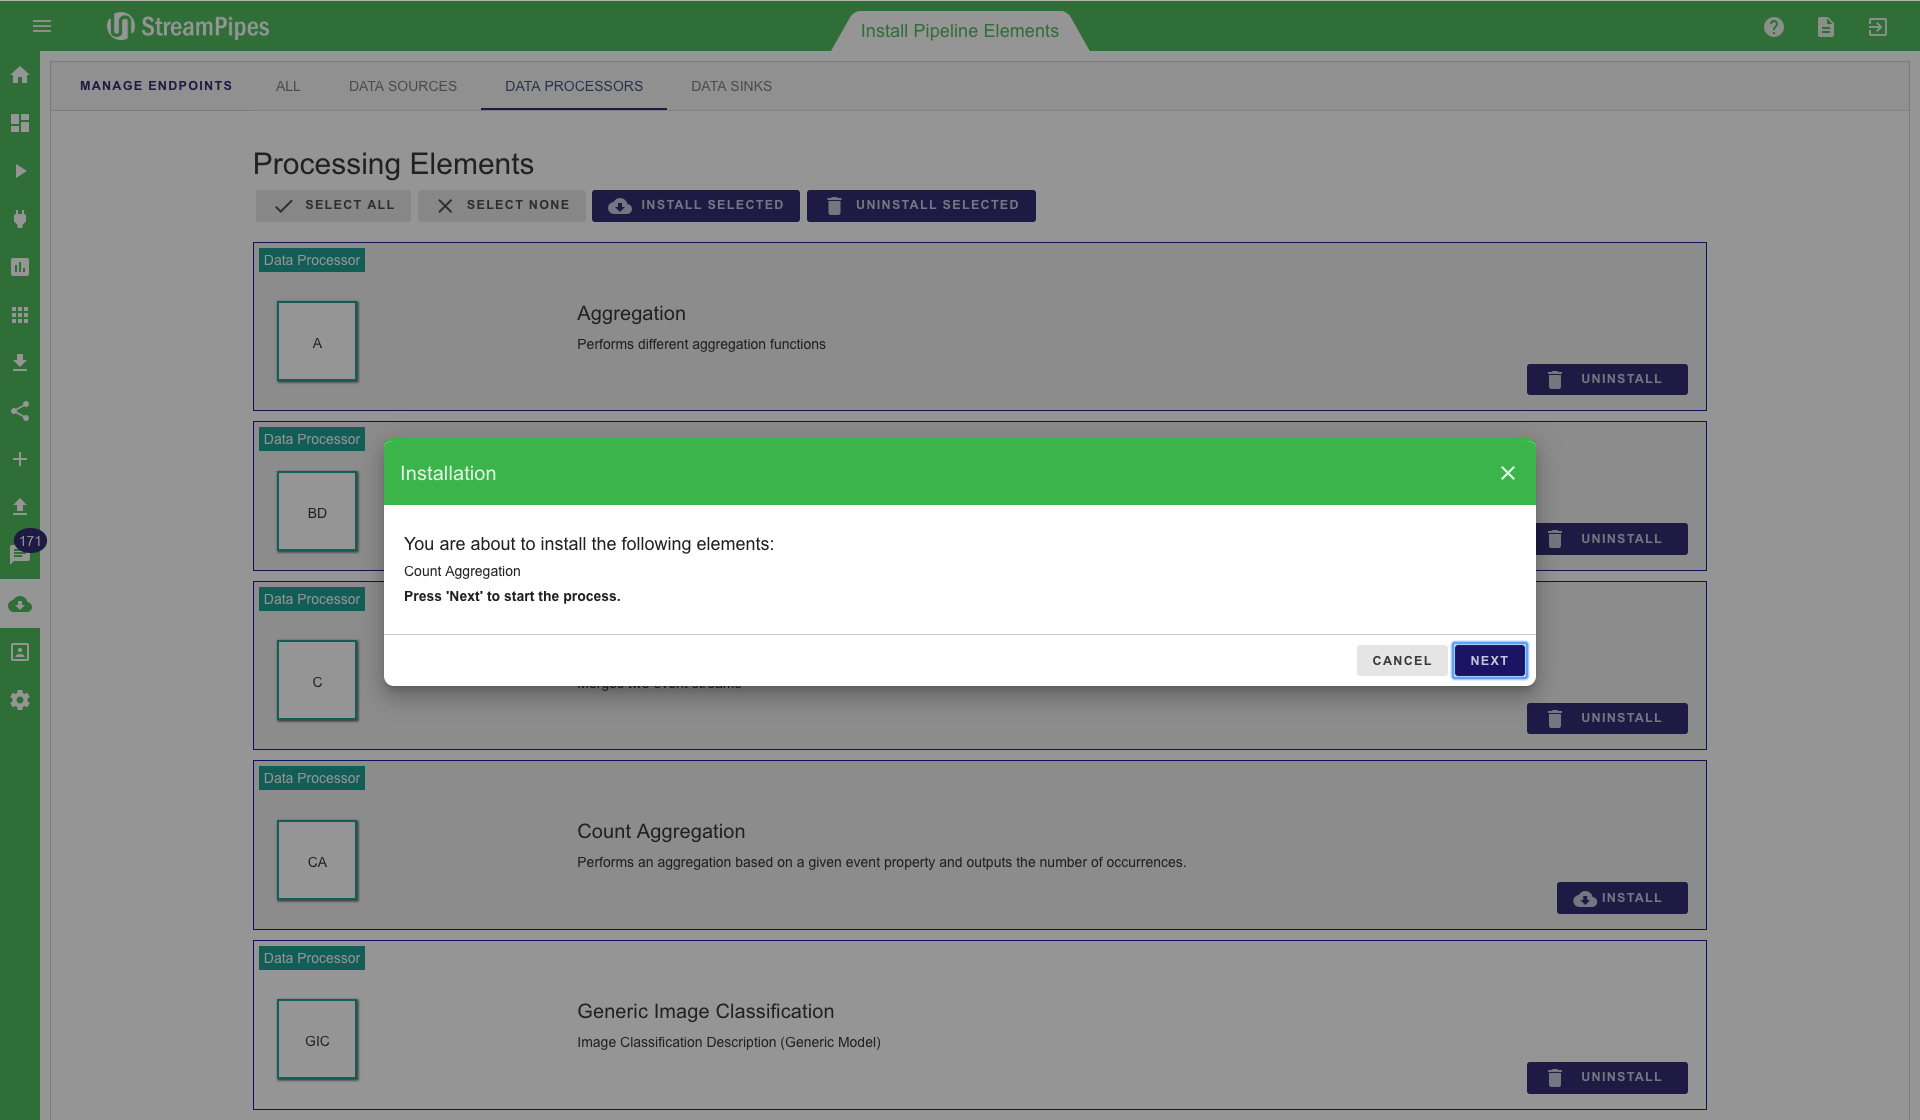
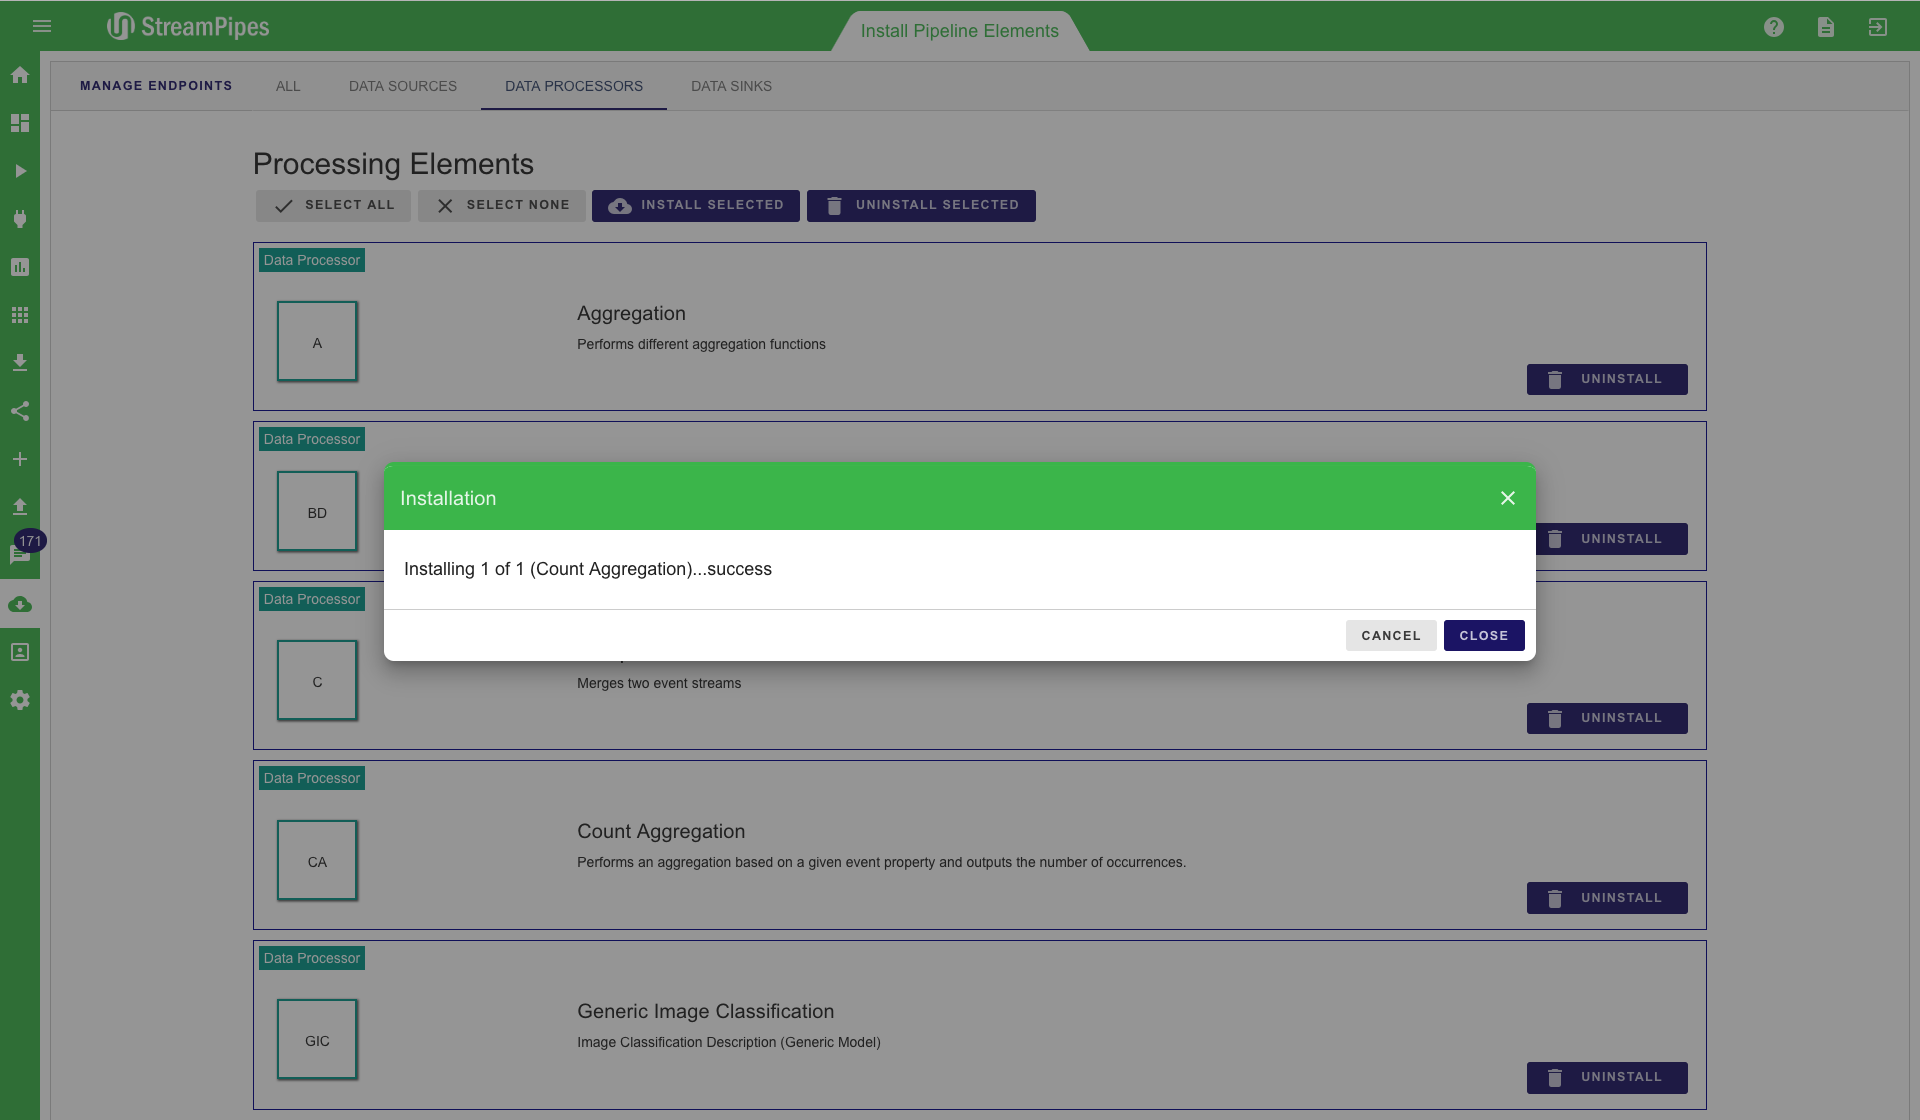
StreamPipes is highly configurable and extensible. Pipeline elements can be added and removed during runtime. This can be done in the "Install Pipeline Elements" view. All available pipeline elements are shown here and can be selected to install or uninstall. It is also possible to select multiple or all of them and then install them all together. When a new element is installed by the user it is automatically available in the "Pipeline Editor" and can be used for pipelines. Elements that are uninstalled are removed from the system. They can not longer be used within pipelines.
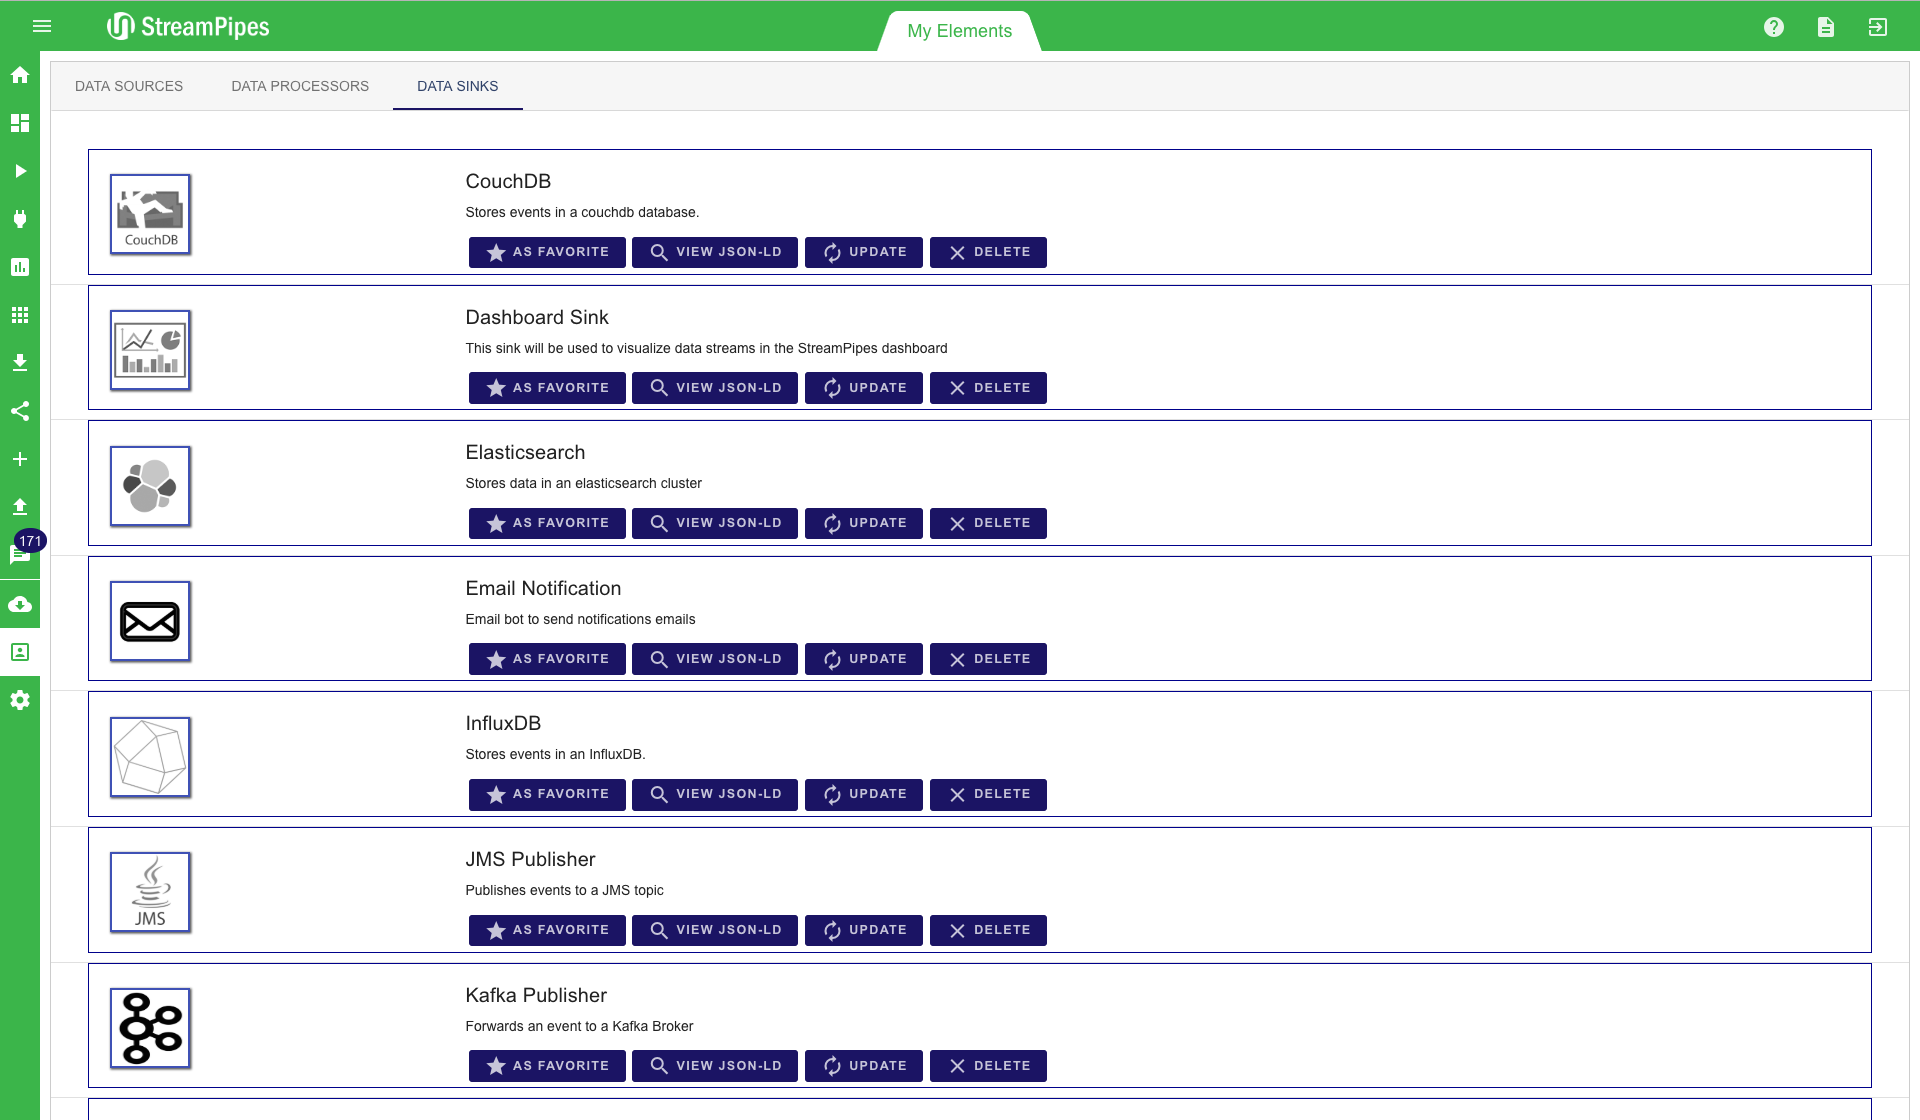
My Elements
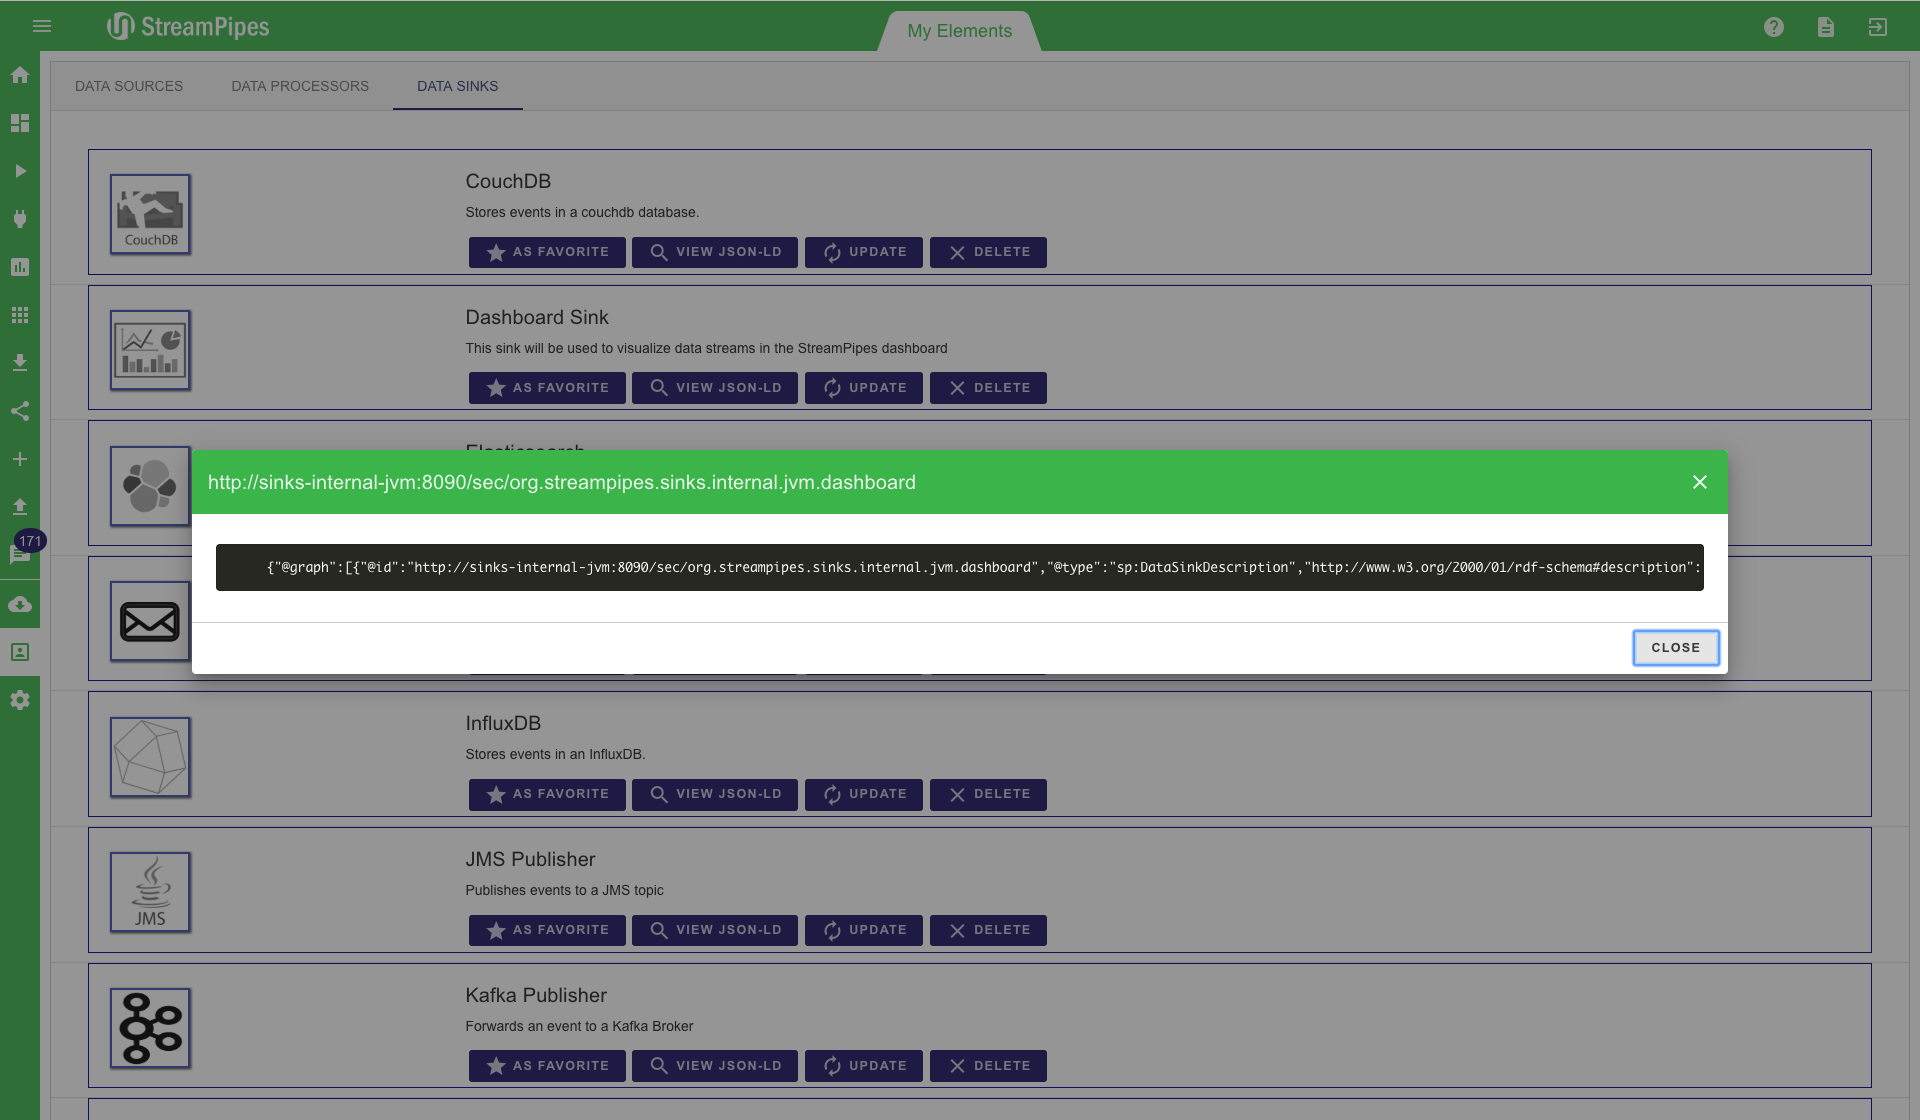
The "My Elements" view gives a quick overview over all installed pipeline elements. Here they can be inspected and the description can be re-imported. In this view it is also possible to have a look at the JSON-LD representation of each element. This is not important for a user, but it is worth noting that the system uses this machine understandable format to support the user. For example all the information of the sources, like data schema or unit information is in the JSON-LD meta data.
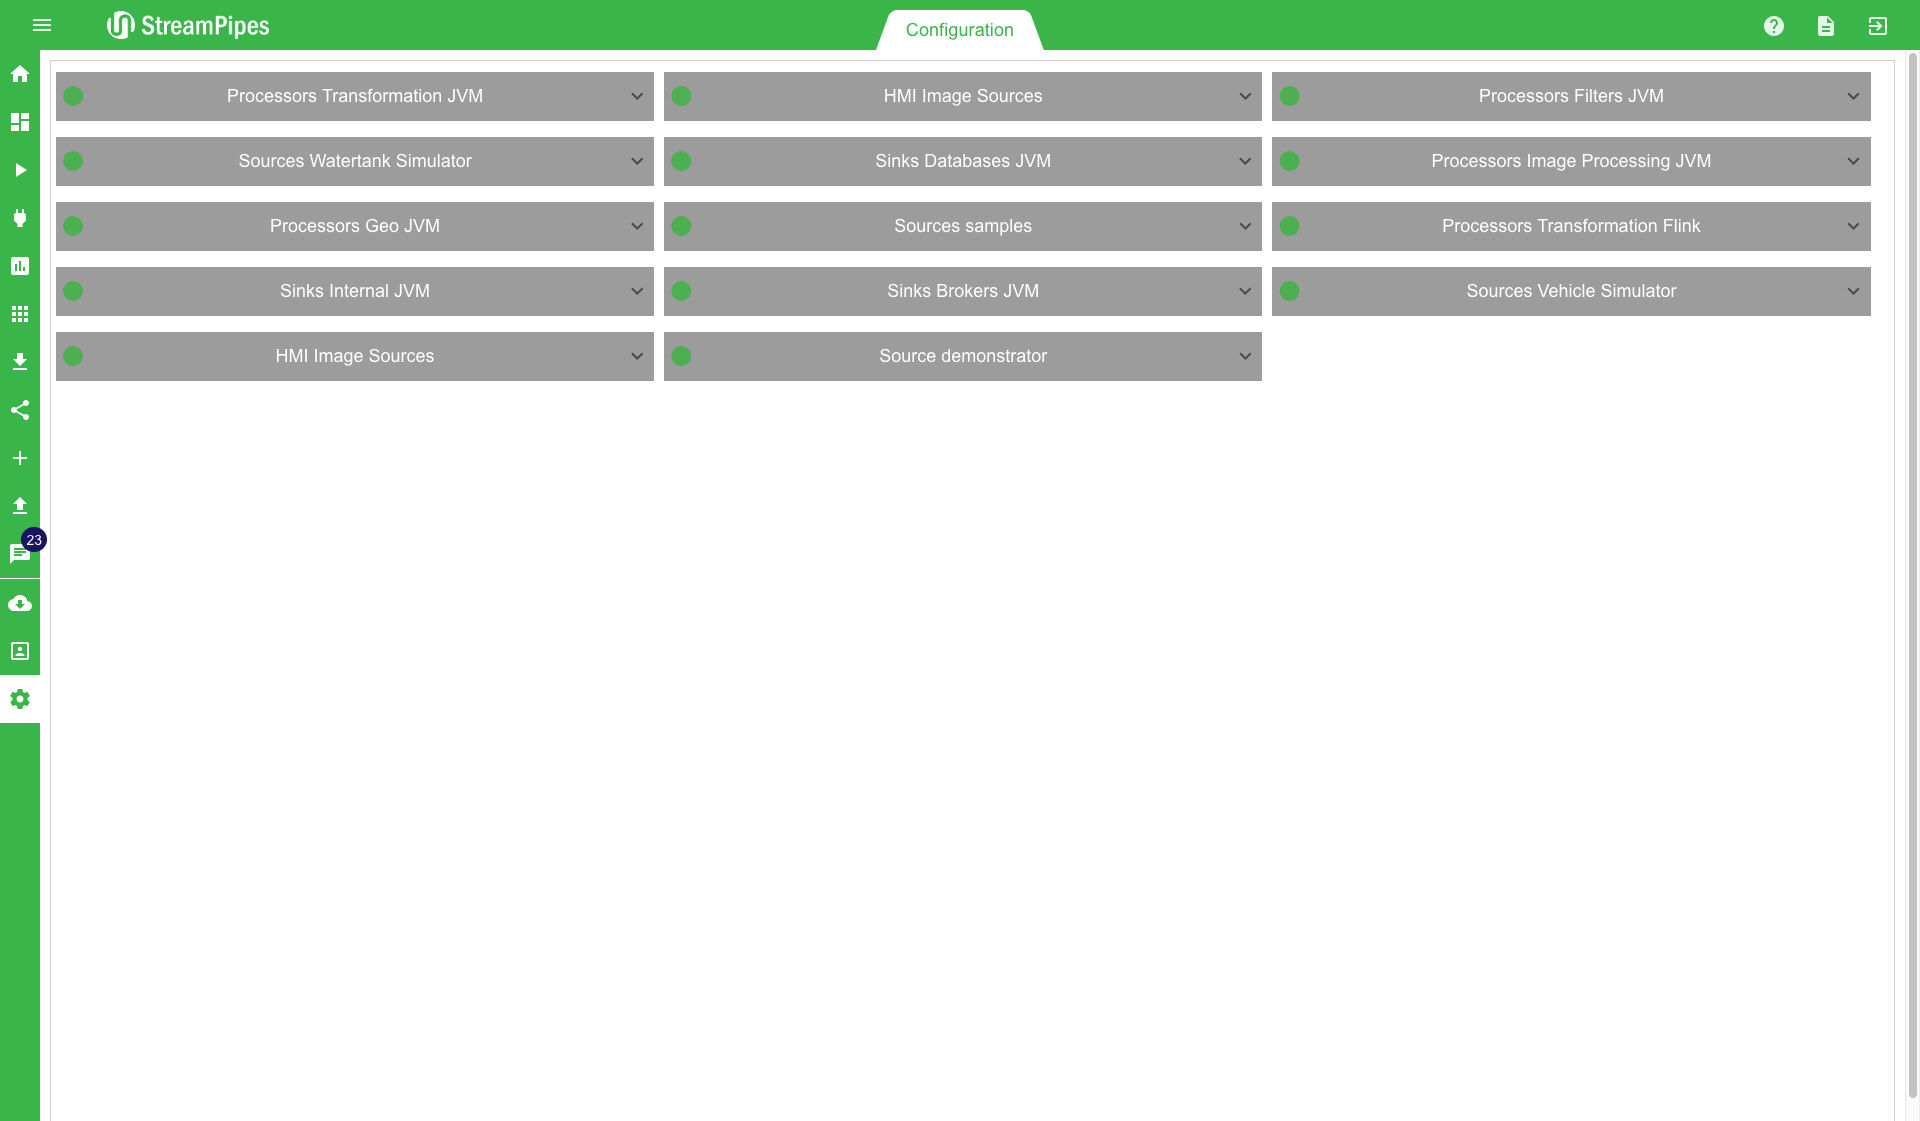
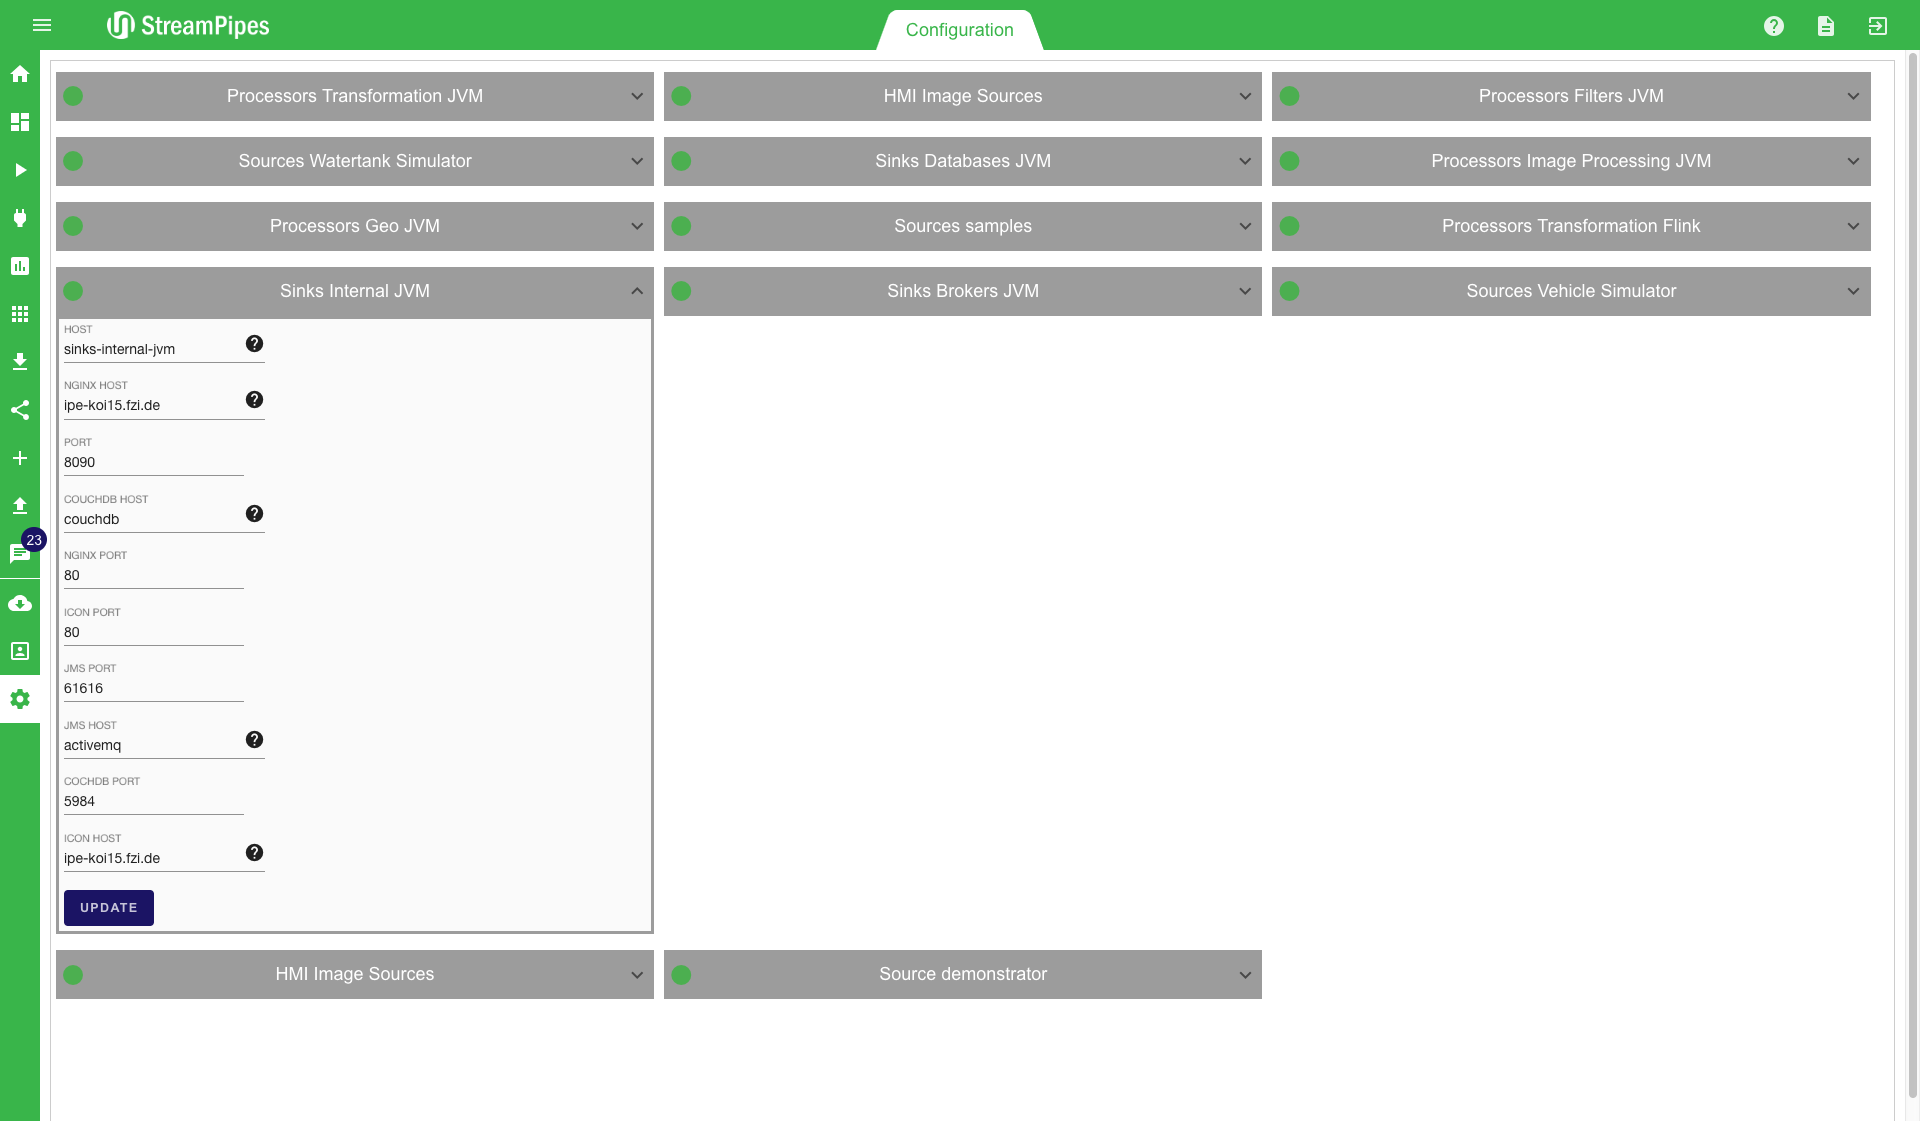
Configuration
The last feature is the configuration view. Here, it is possible to change the configuration parameters of installed components. All components containing processing elements automatically register in StreamPipes when they are started in the same network as the backend component. Once a container is registered it is represented in the configuration view. The green dot on the top left indicates that tha container is running properly. When there is a problem with a container the green dot changes to red and the user knows there is a problem. To configure the parameters the top right arrow of a configuration box must be clicked. Then the configuration menu pops up. Within there it is possible to change the parameters of a service. To make the changes persistent the "Update" button must be clicked. A user should keep in mind that sometimes it is necessary to restart a container when the parameters are changed. Sometimes it is also necessary to re-import the pipeline element description, either by uninstalling and re-installing them after the container restart or be reloading the description in the "My elements" view.
Congratulations! You've just finished your first tour of StreamPipes. Although there's still more to learn, we introduced most of the currently available features. On the next page, the different processing elements that come with the installation are explained.