First steps
In this section, you'll learn how to create and run pipelines in StreamPipes. Before starting with this guide, all steps from the installation guide must be finished successfully and StreamPipes must be up and running.
This guide consists of three steps: First, you'll learn how to create your first pipeline using the interactive tutorial. Afterwards, this section contains two examples on how to create pipelines based on the built-in data simulator.
Interactive Tutorial
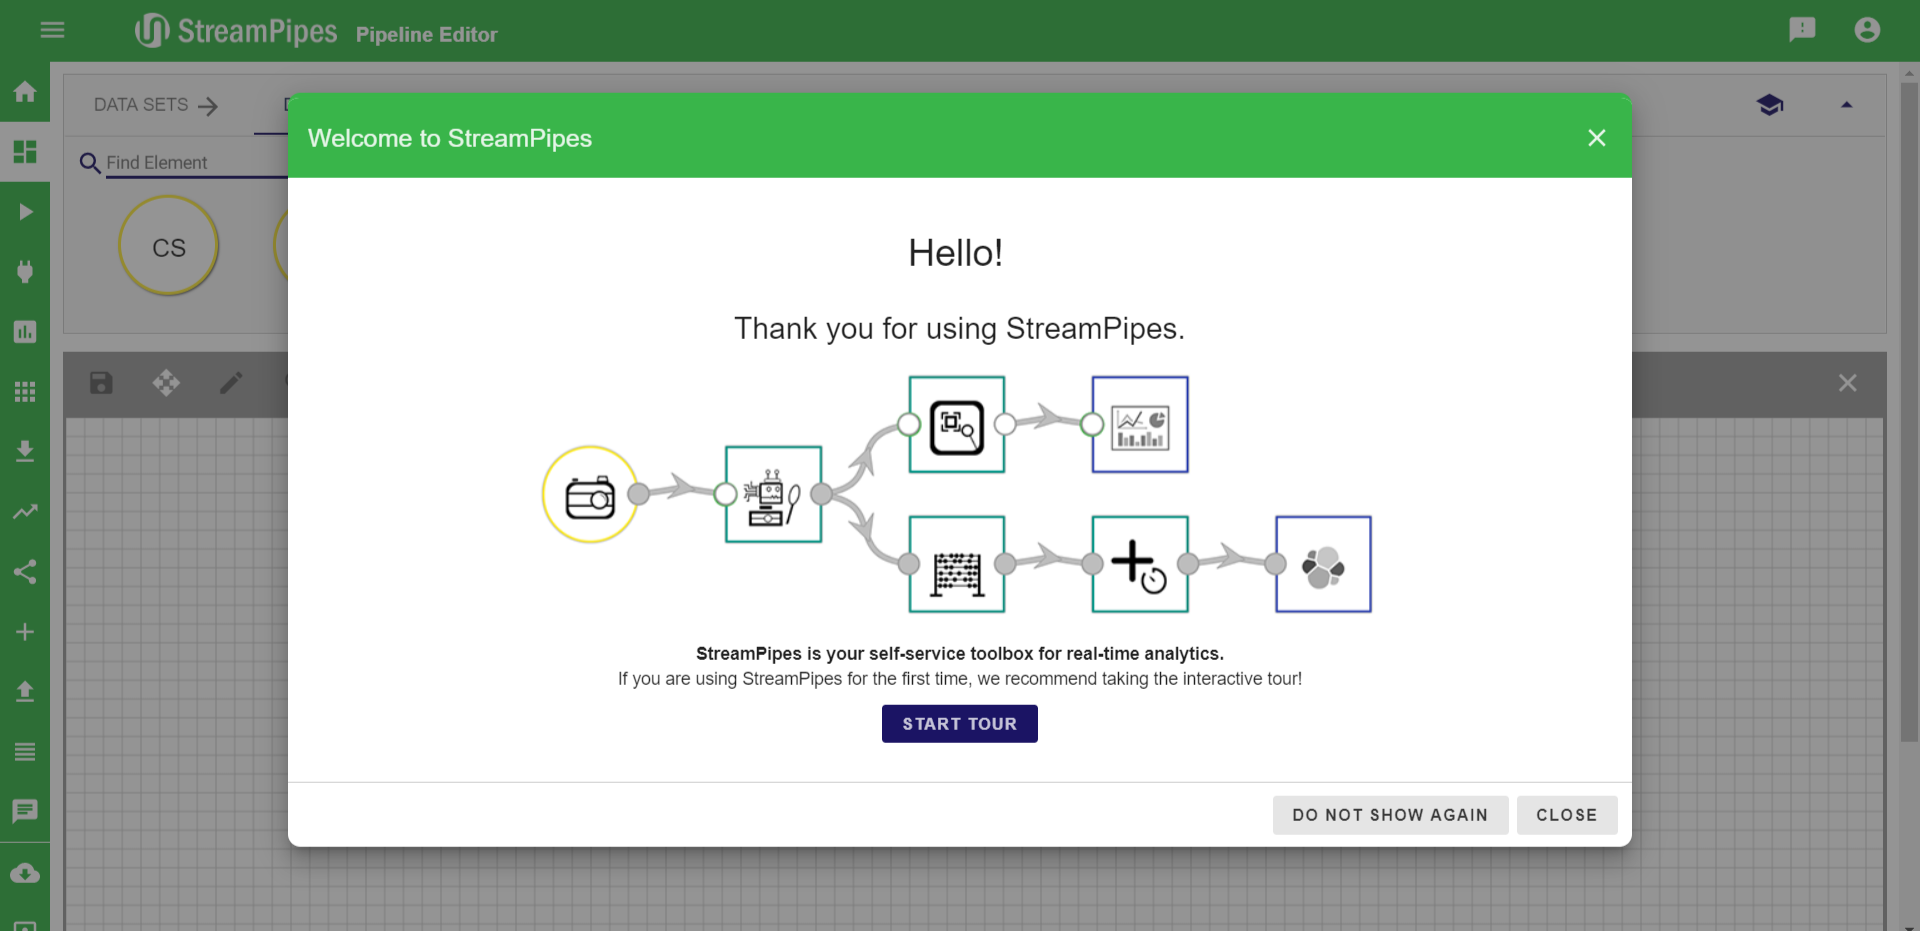
The easiest way to get started with StreamPipes is the interactive tutorial. Once you open the pipeline editor for the first time, you'll see a splash screen as shown below. Click Start tour to start the interactive tutorial, which will guide you through your first steps with StreamPipes.
If the splash screen does not show up, make sure you've installed the following pipeline elements:
- Flow rate (data stream)
- Numerical Filter (processing element)
- Dashboard (data sink)
After you've finished this very first tour, try the following tours to learn more about other features of StreamPipes:
- Open the Live Dashboard and start the dashboard tour (by clicking the school icon in the top menu bar) to learn how to create real-time visualizations
- Open StreamPipes Connect and start the tour to learn how to connect new data sources with StreamPipes.
First Examples
In this tutorial, you will create two simple pipelines that demonstrate the basic functionality of StreamPipes. The first example deals with monitoring a flow rate sensor. This pipeline ensures that everything works properly and data is sent through the whole system. In the second example we model a more complex situation detection pipeline that triggers a notification. Let's start with our first pipeline. If you have problems with any of the examples, please send us an email. We are happy to help you.
Data Simulation
All the data sources that we have integrated in the StreamPipes demonstrator are simulated according to real world sensors. For example a flow rate sensor in a water pipe, which measures how much water flows in that pipe or a water level sensor in a water tank, that reports how high the water level is in the tank. In the next section you will use the flow rate sensor to build your first pipeline.
Flow Rate Visualization
In the first example, we create a live line chart to monitor the value of the mass flow from a flow rate sensor.
Create Pipeline
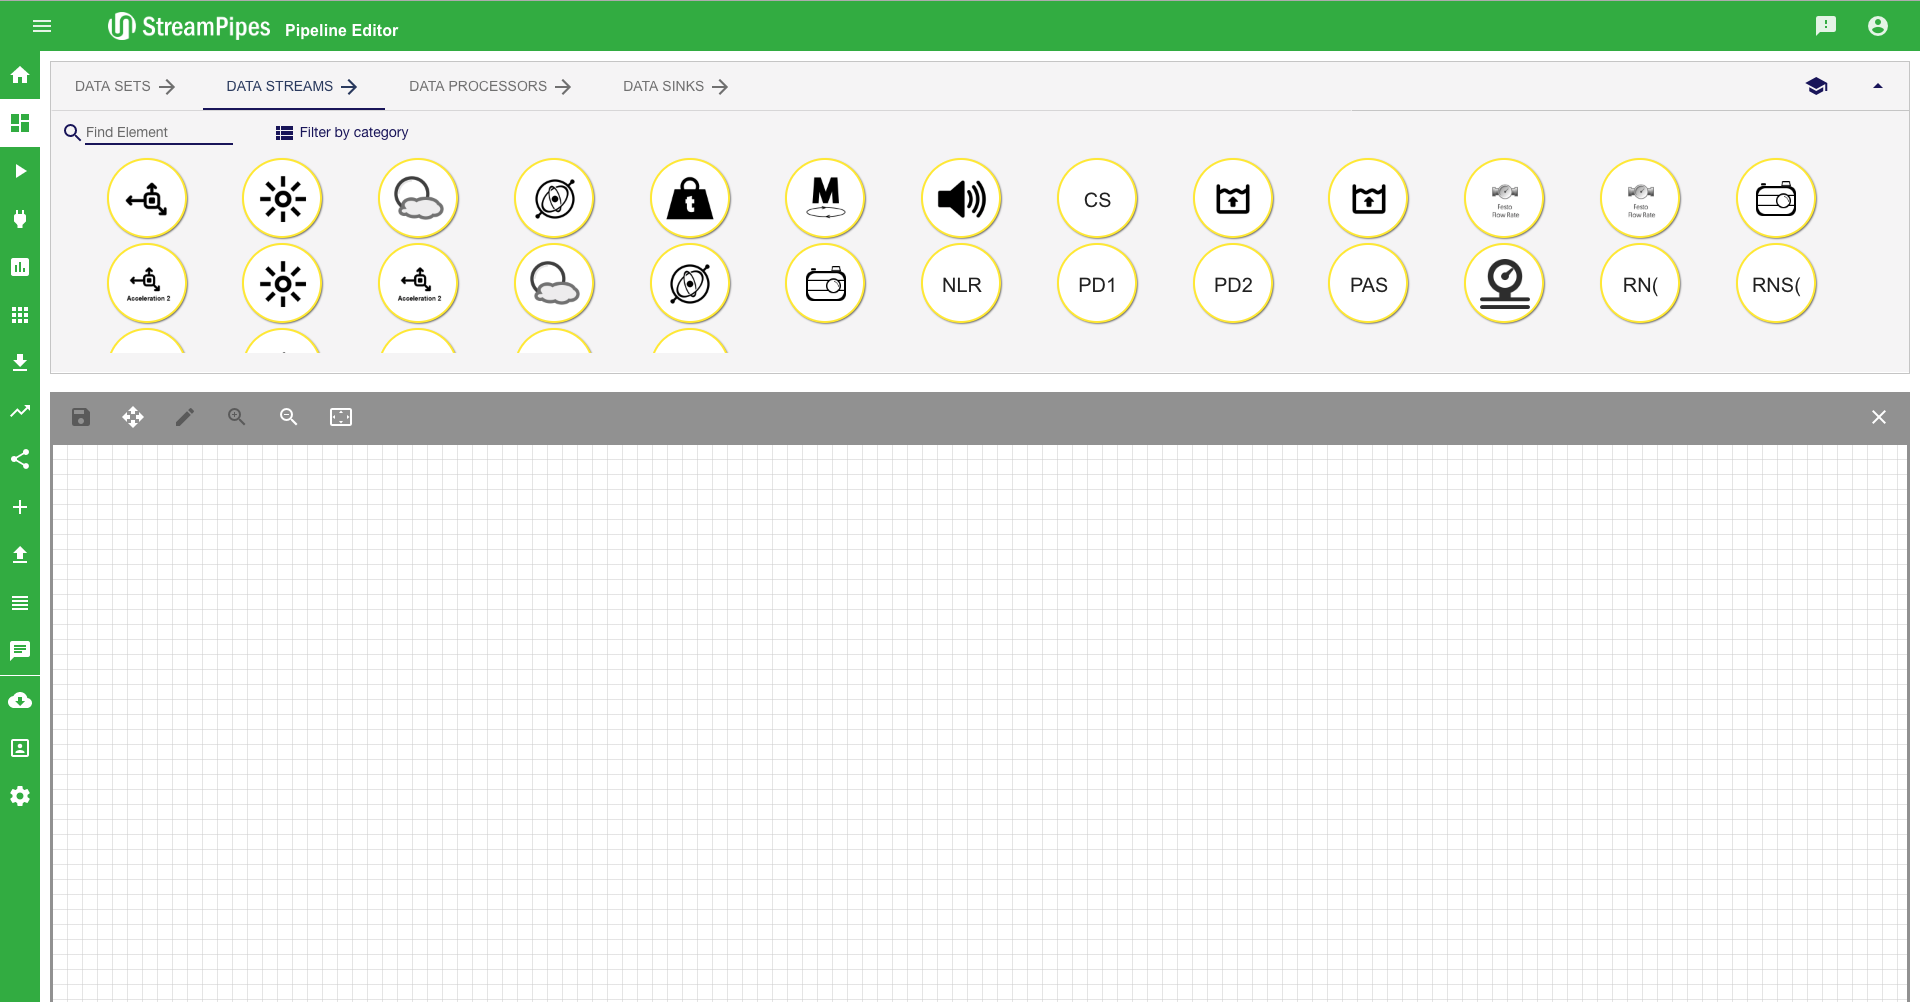
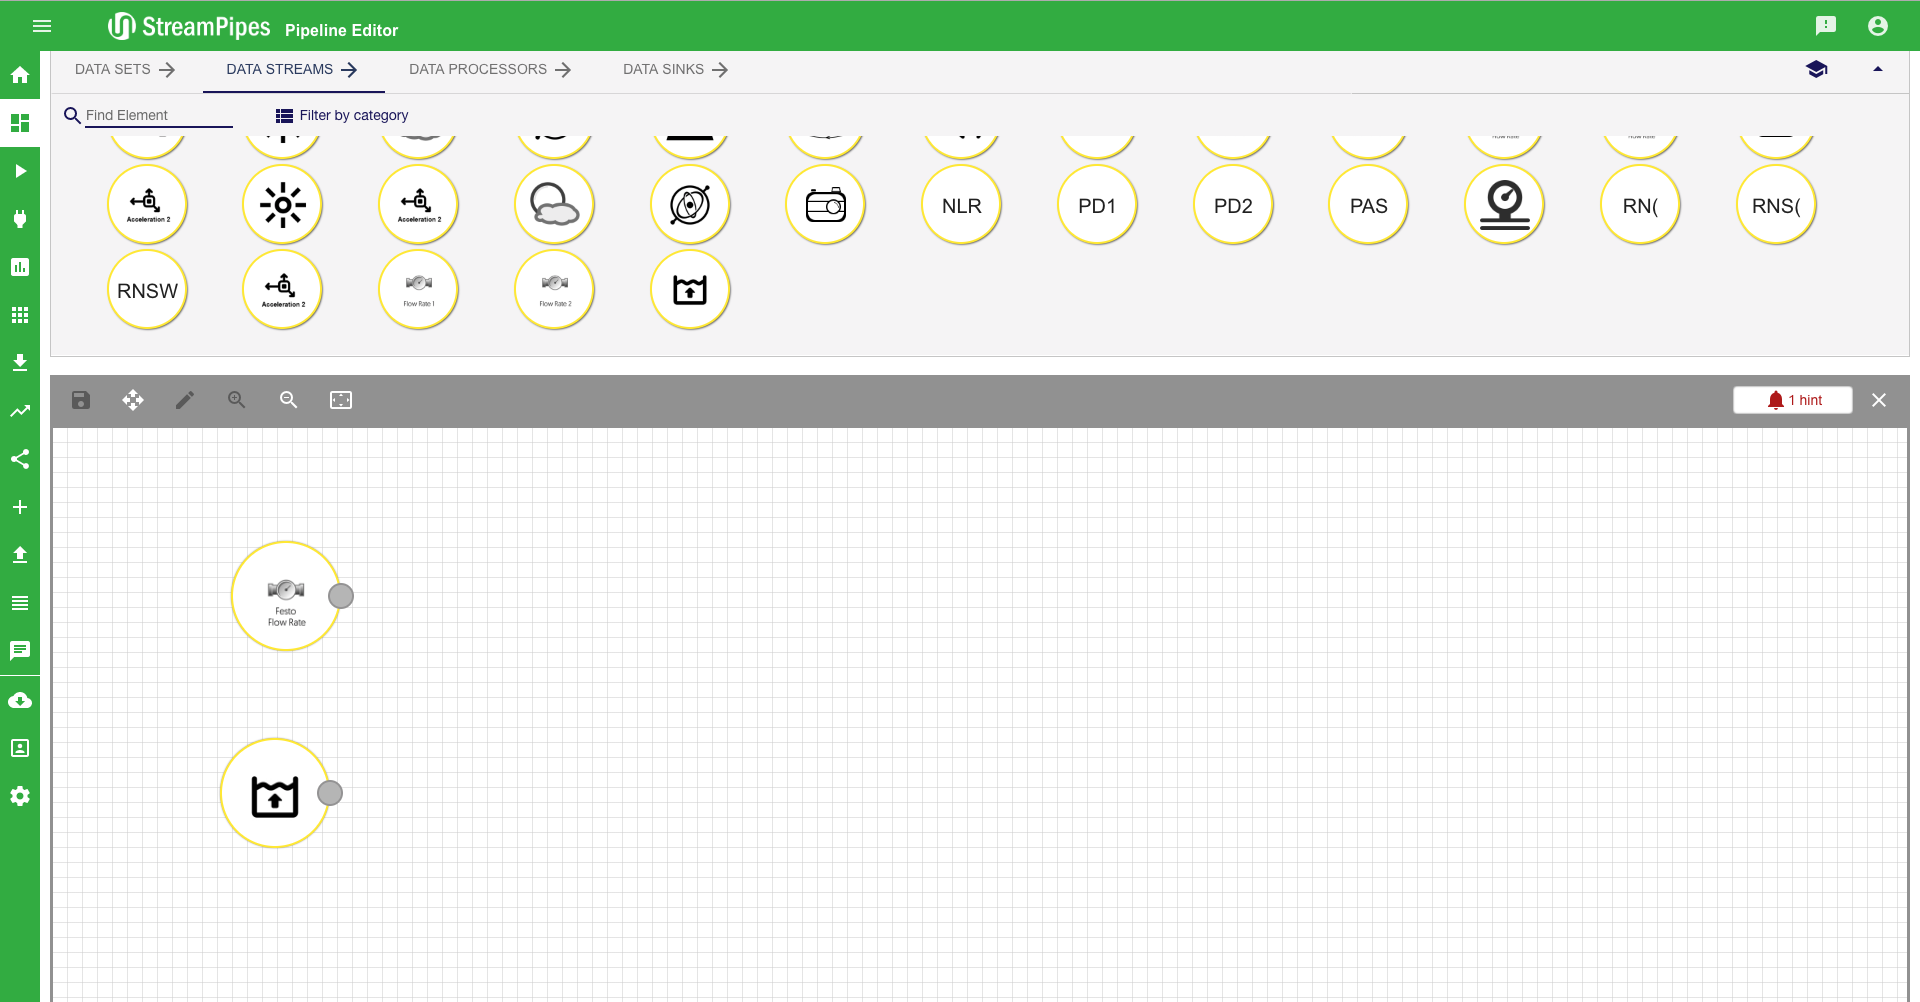
- As a first step go to the pipeline editor
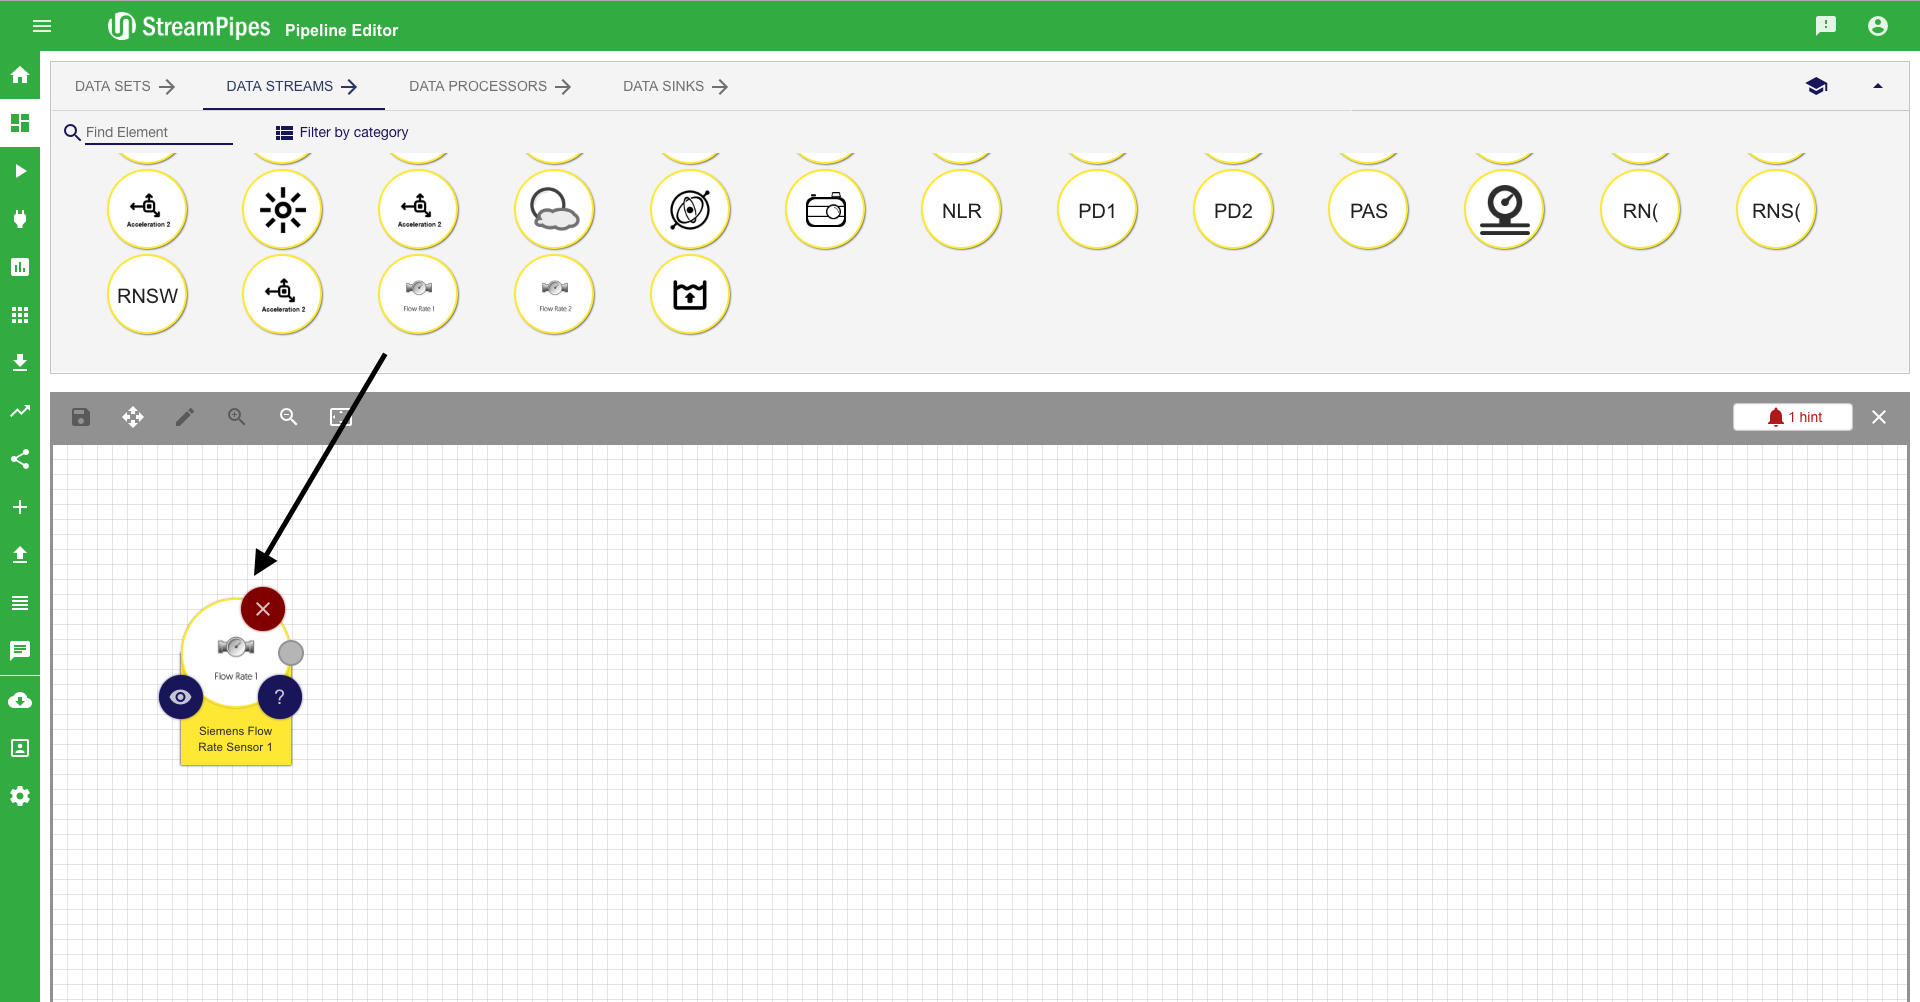
- Select the FRS1 (Flow Rate Source 1)source
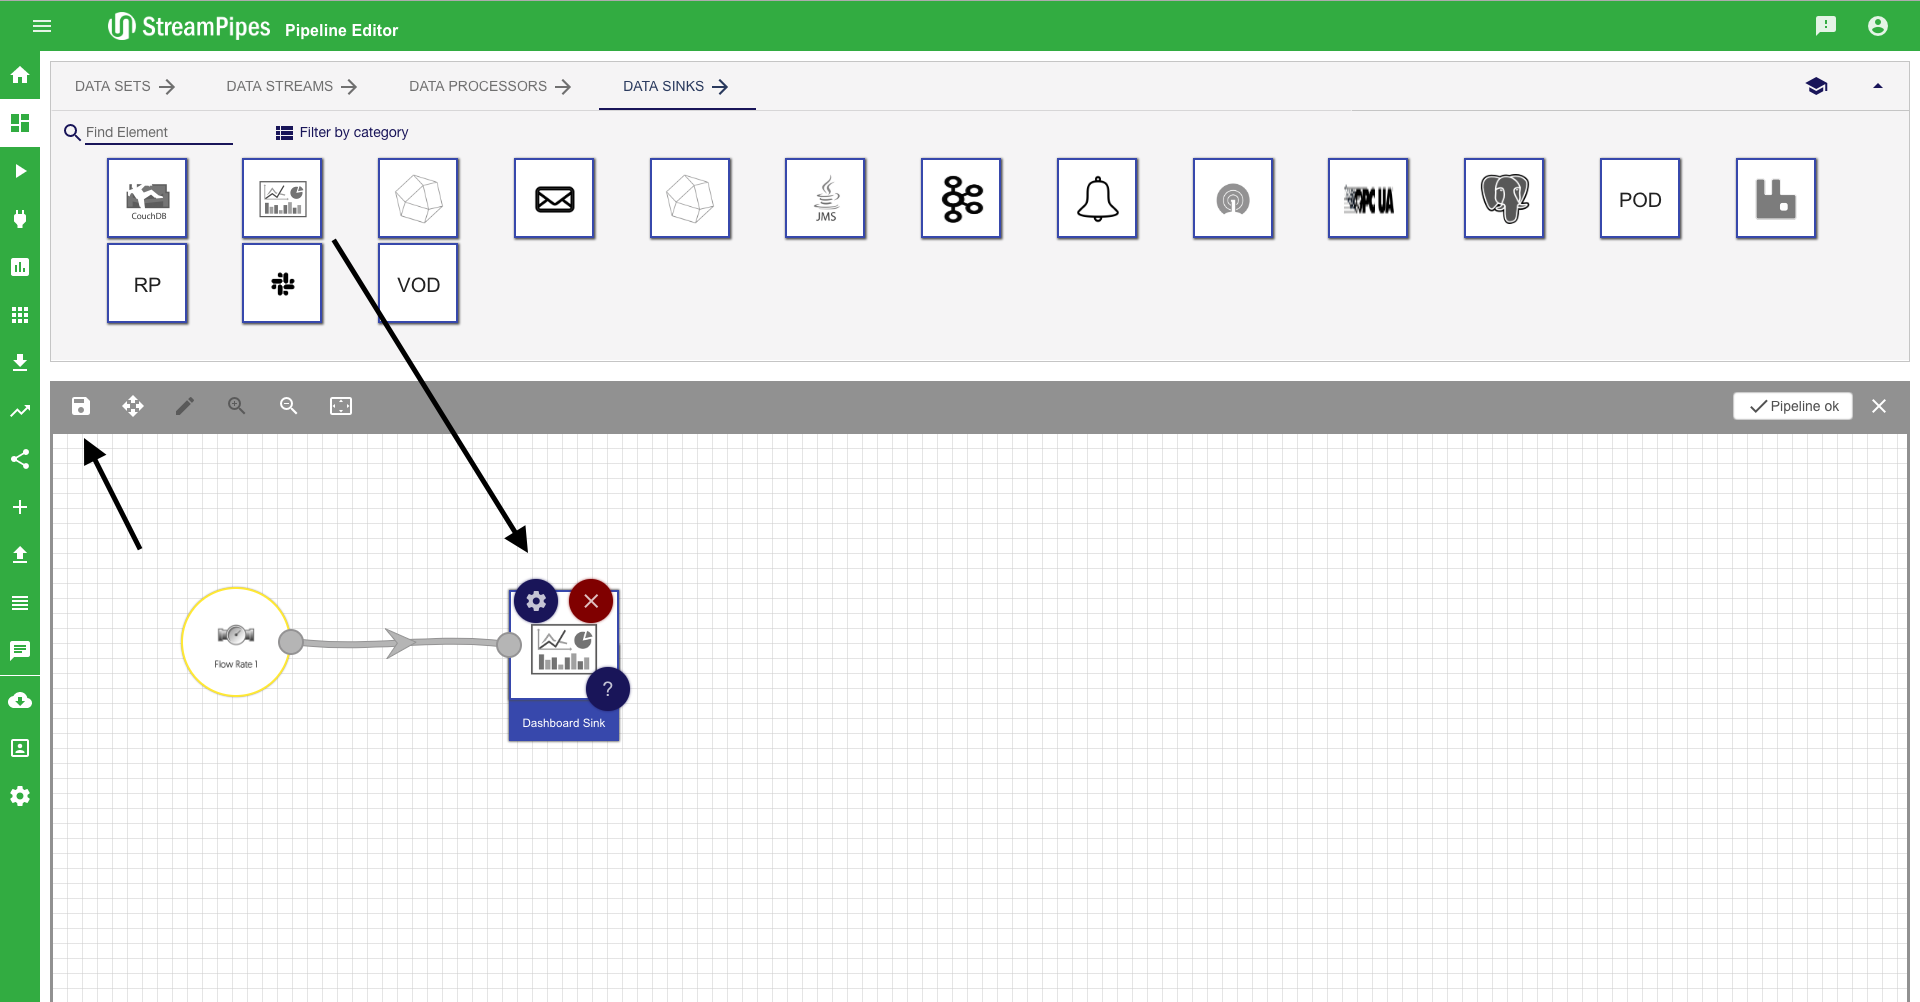
- Then navigate to the Data Sink tab
- Select the DS (Dashboard Sink) and connect the source with the sink
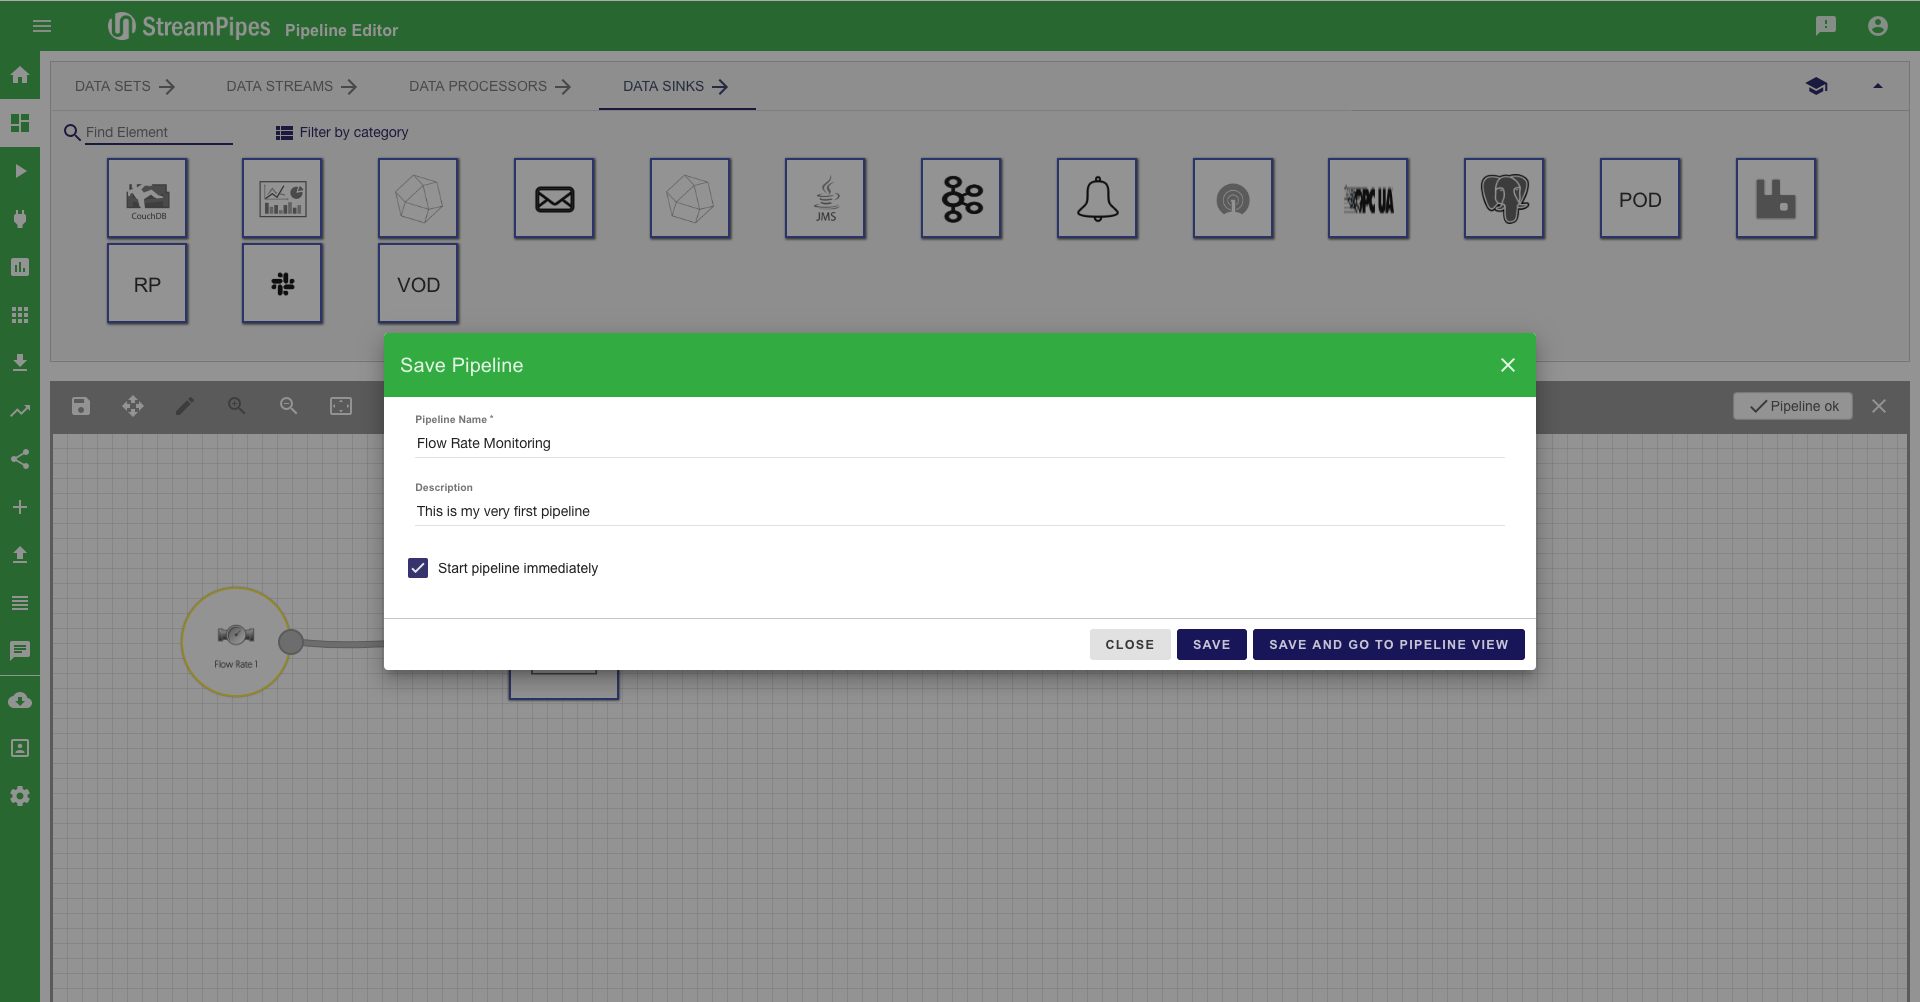
- After connecting the elements save the pipeline by clicking on the save button on the top left corner
- In the save menu add a name Flow Rate Monitoring and a description This is my very first pipeline!
- Also select the Start pipeline immediatly checkbox
- Then click the button Save and go to pipeline view
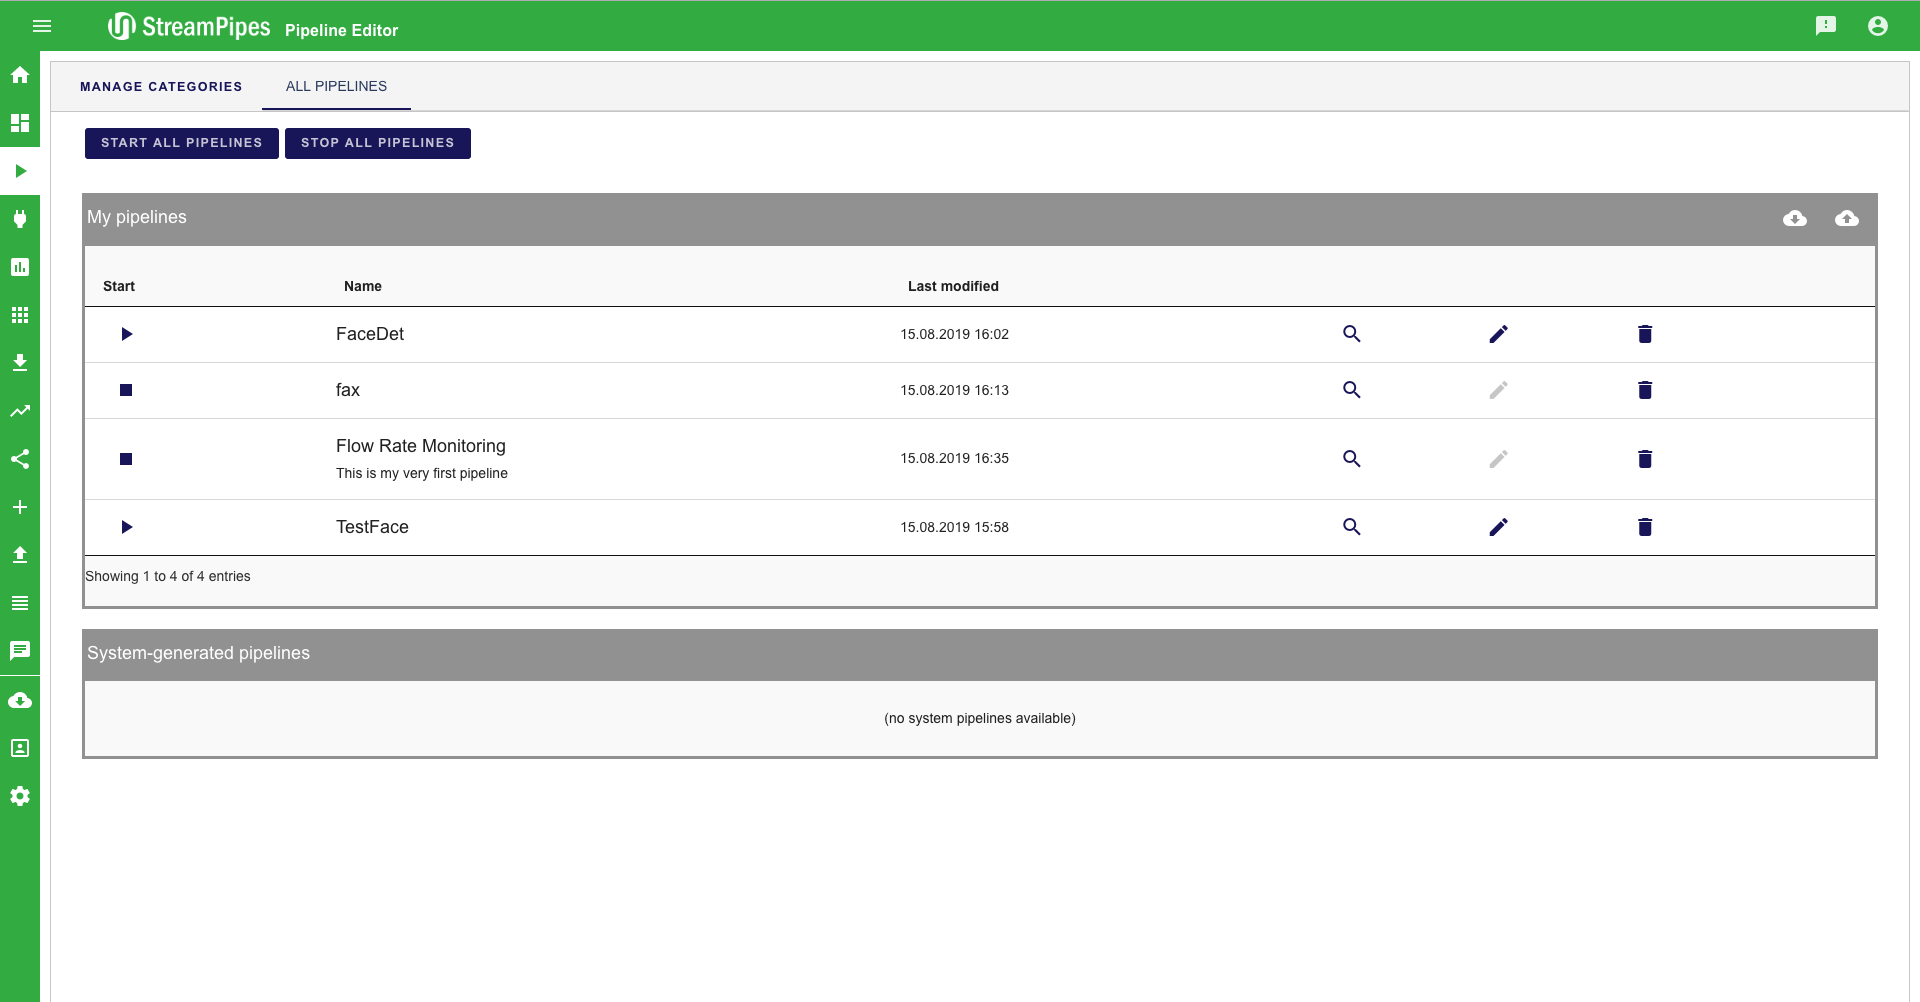
- You are navigated to the pipeline view and a confirmation that the pipeline was started successfully should be shown
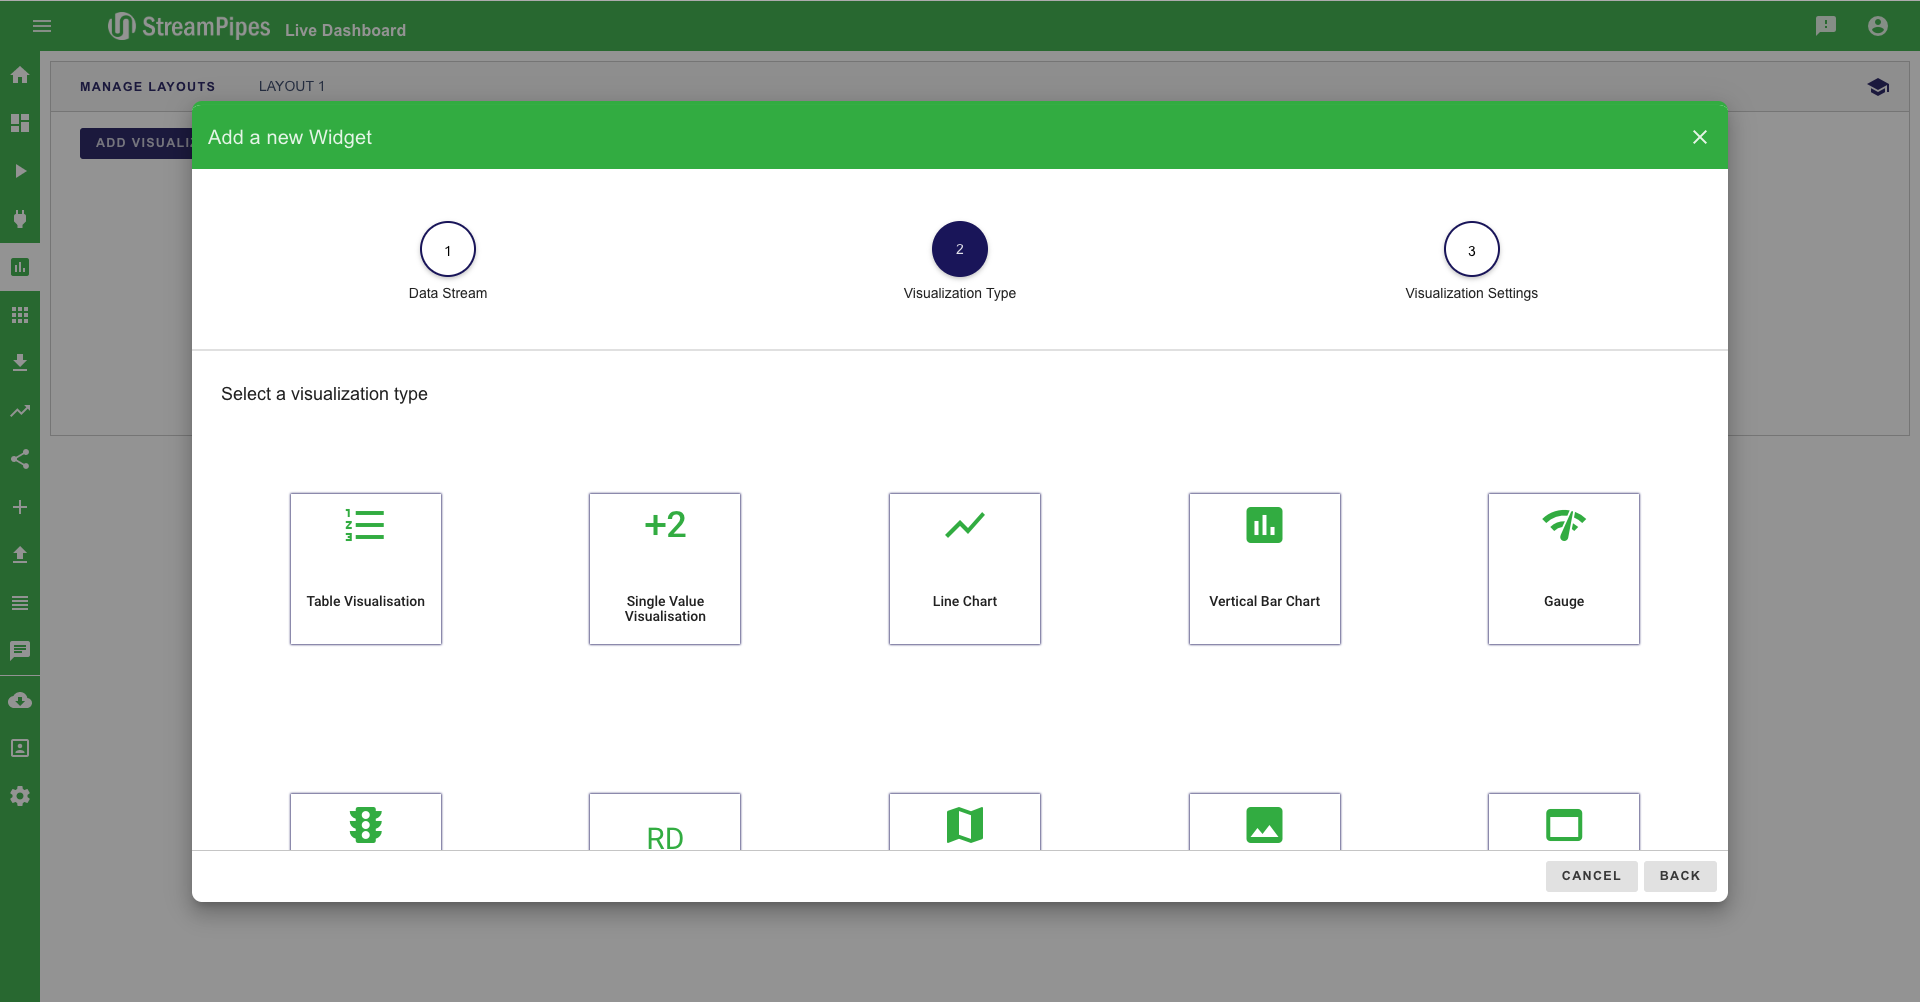
Create Visualization
- After we have created the pipeline we must create the line chart
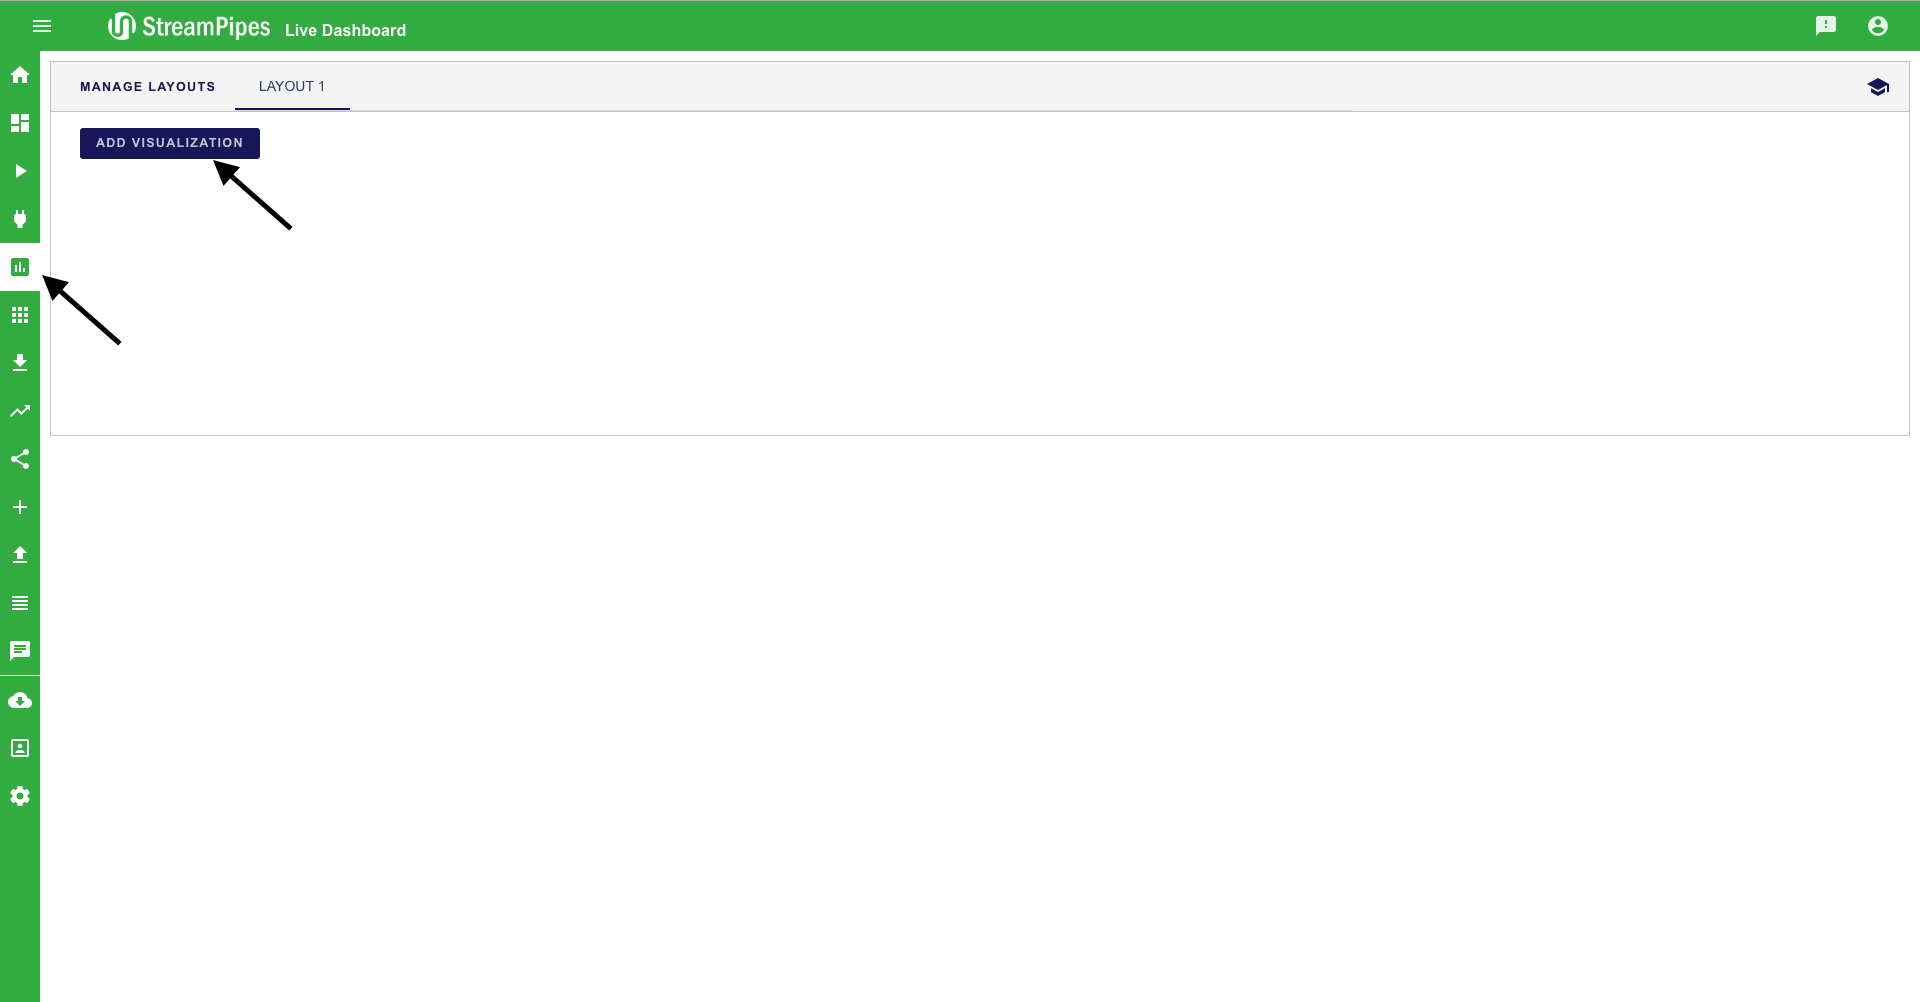
- Navigate to the Live Dashboard of StreamPipes
- Click on the Add visualization button
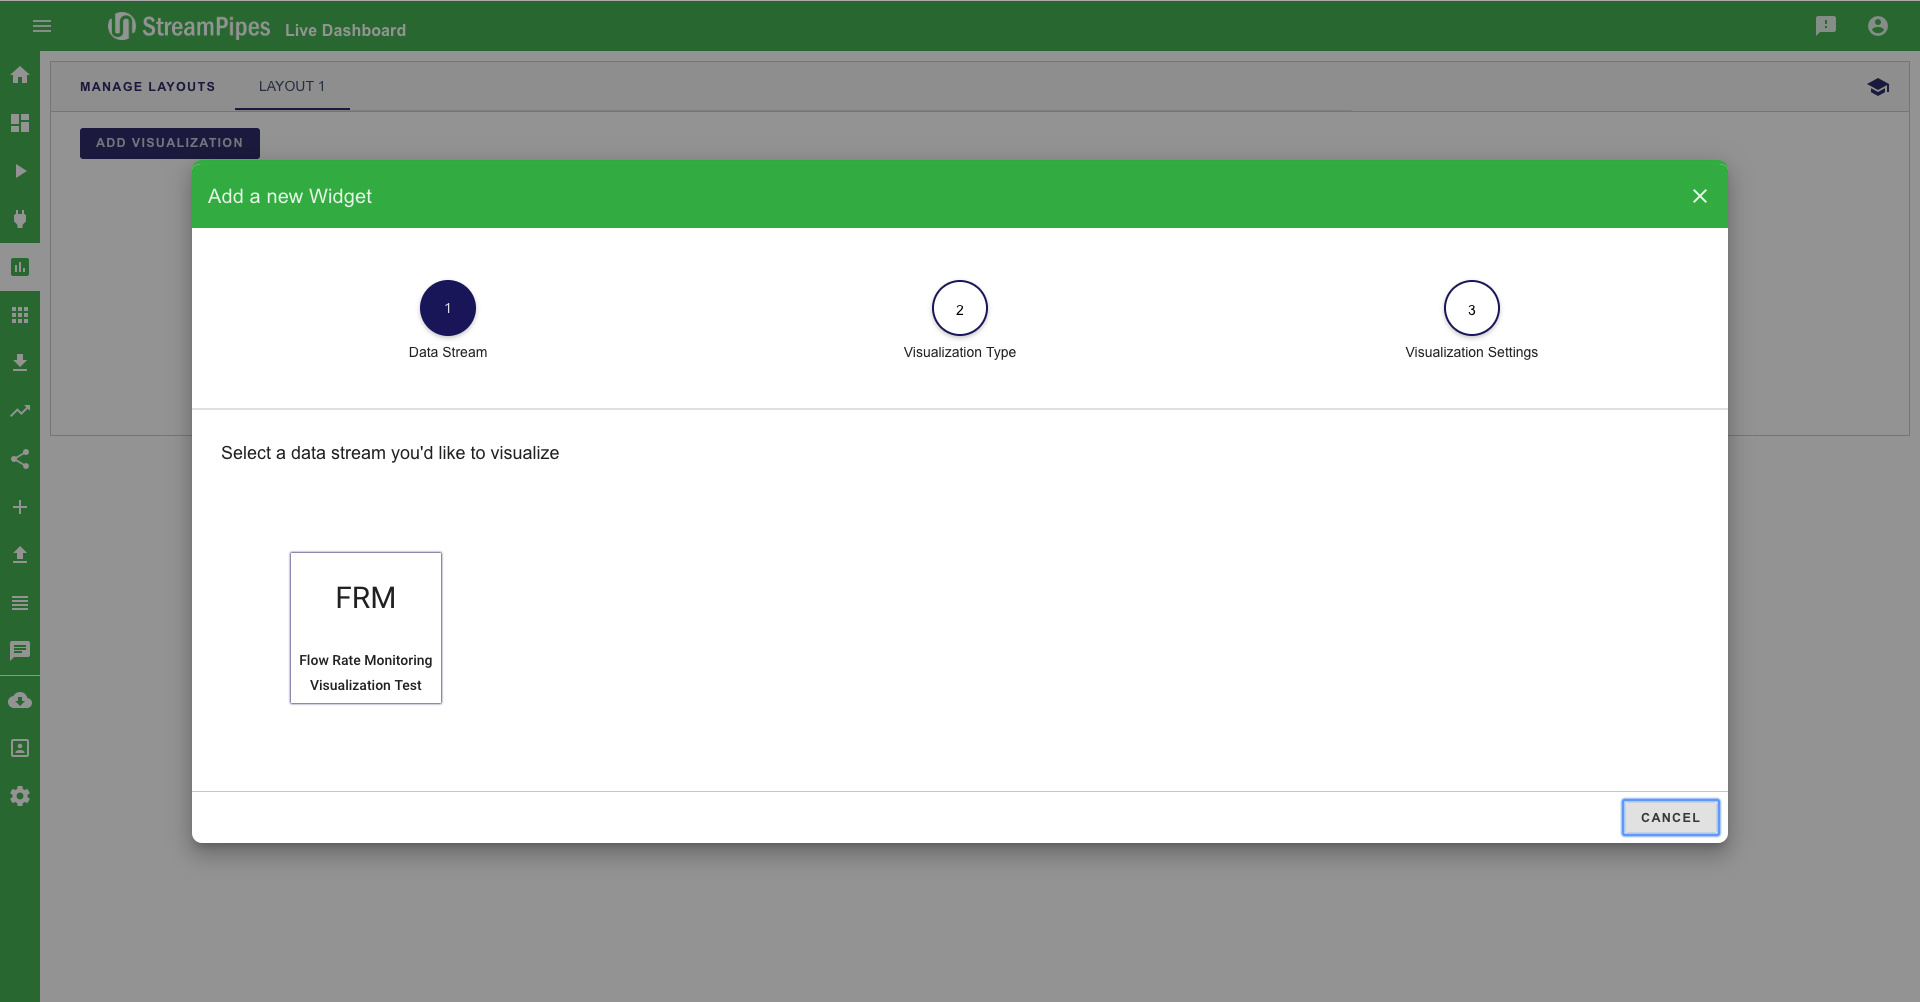
- Select the just created pipeline Flow Rate Monitoring and click the next button
- For the visualization select the Line Chart and click next again
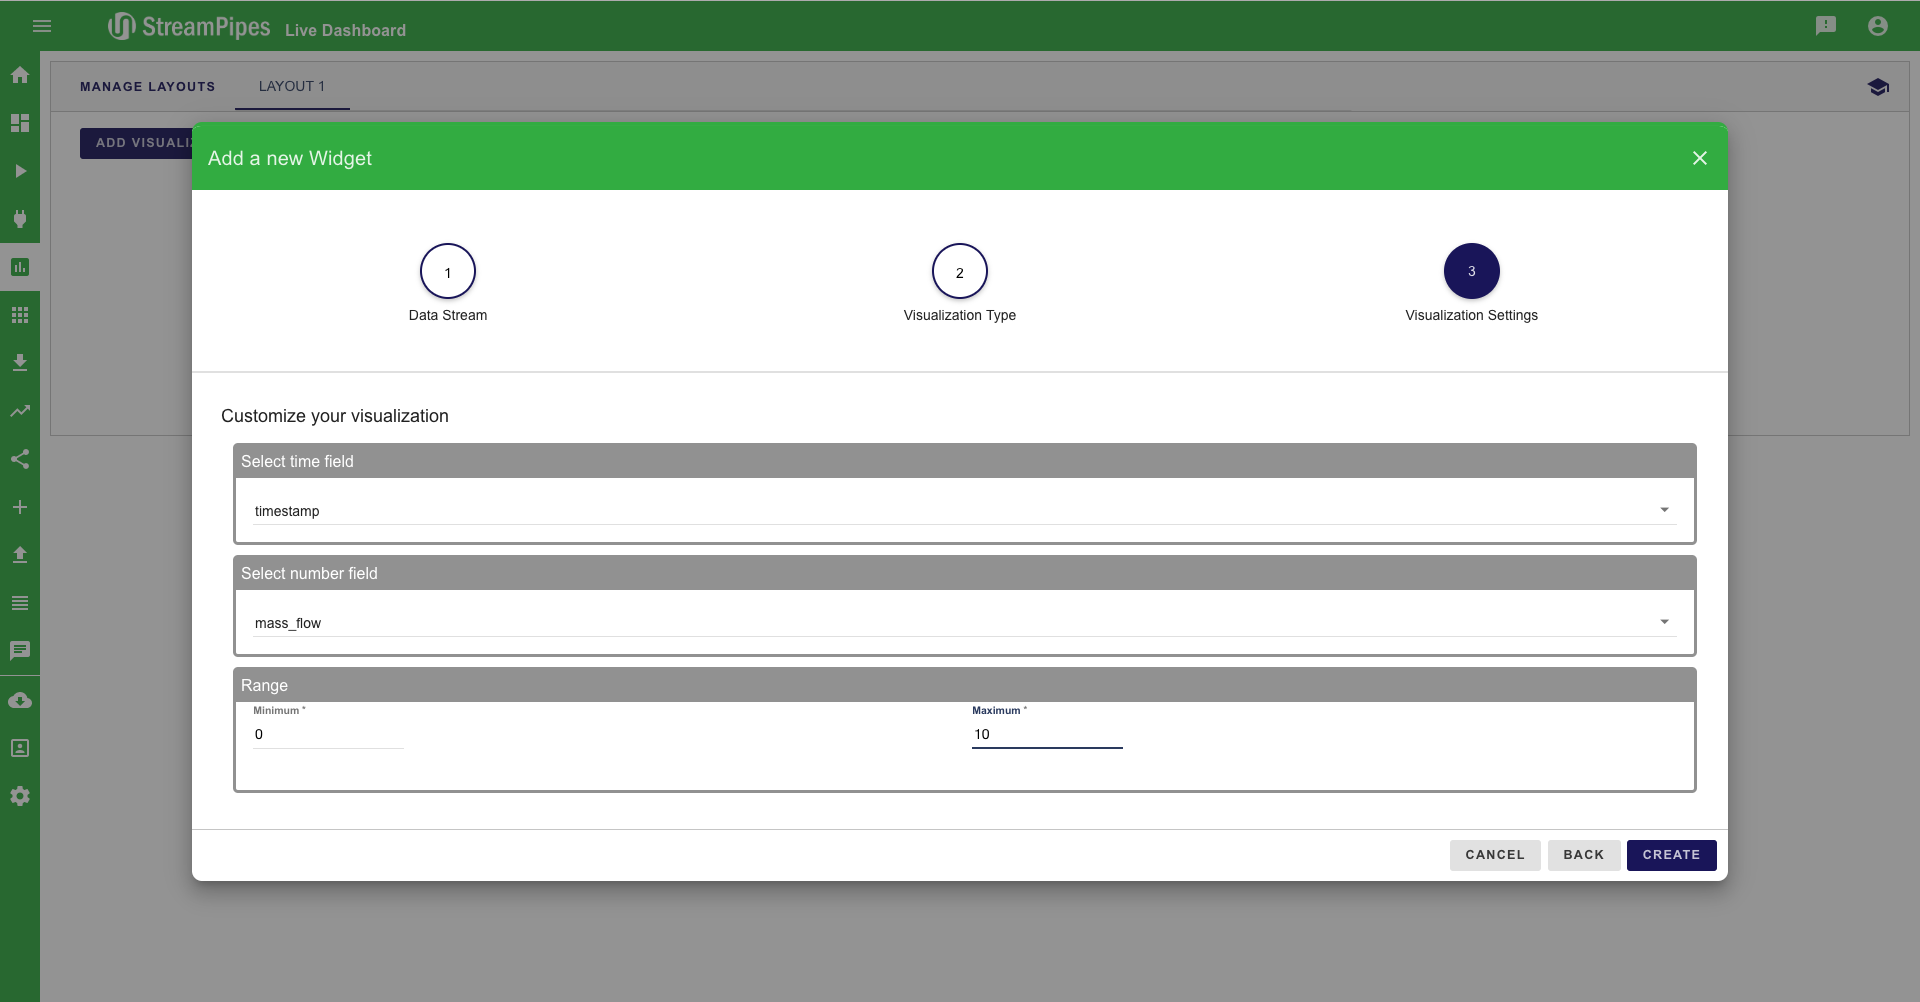
- Now you have to enter the configuration for the line chart
- Select time mapping: timestamp
- Select number mapping: mass_flow
- Range Minimum: 0
- Range Maximum: 10
- When all parameters are set correctly click the next button again.
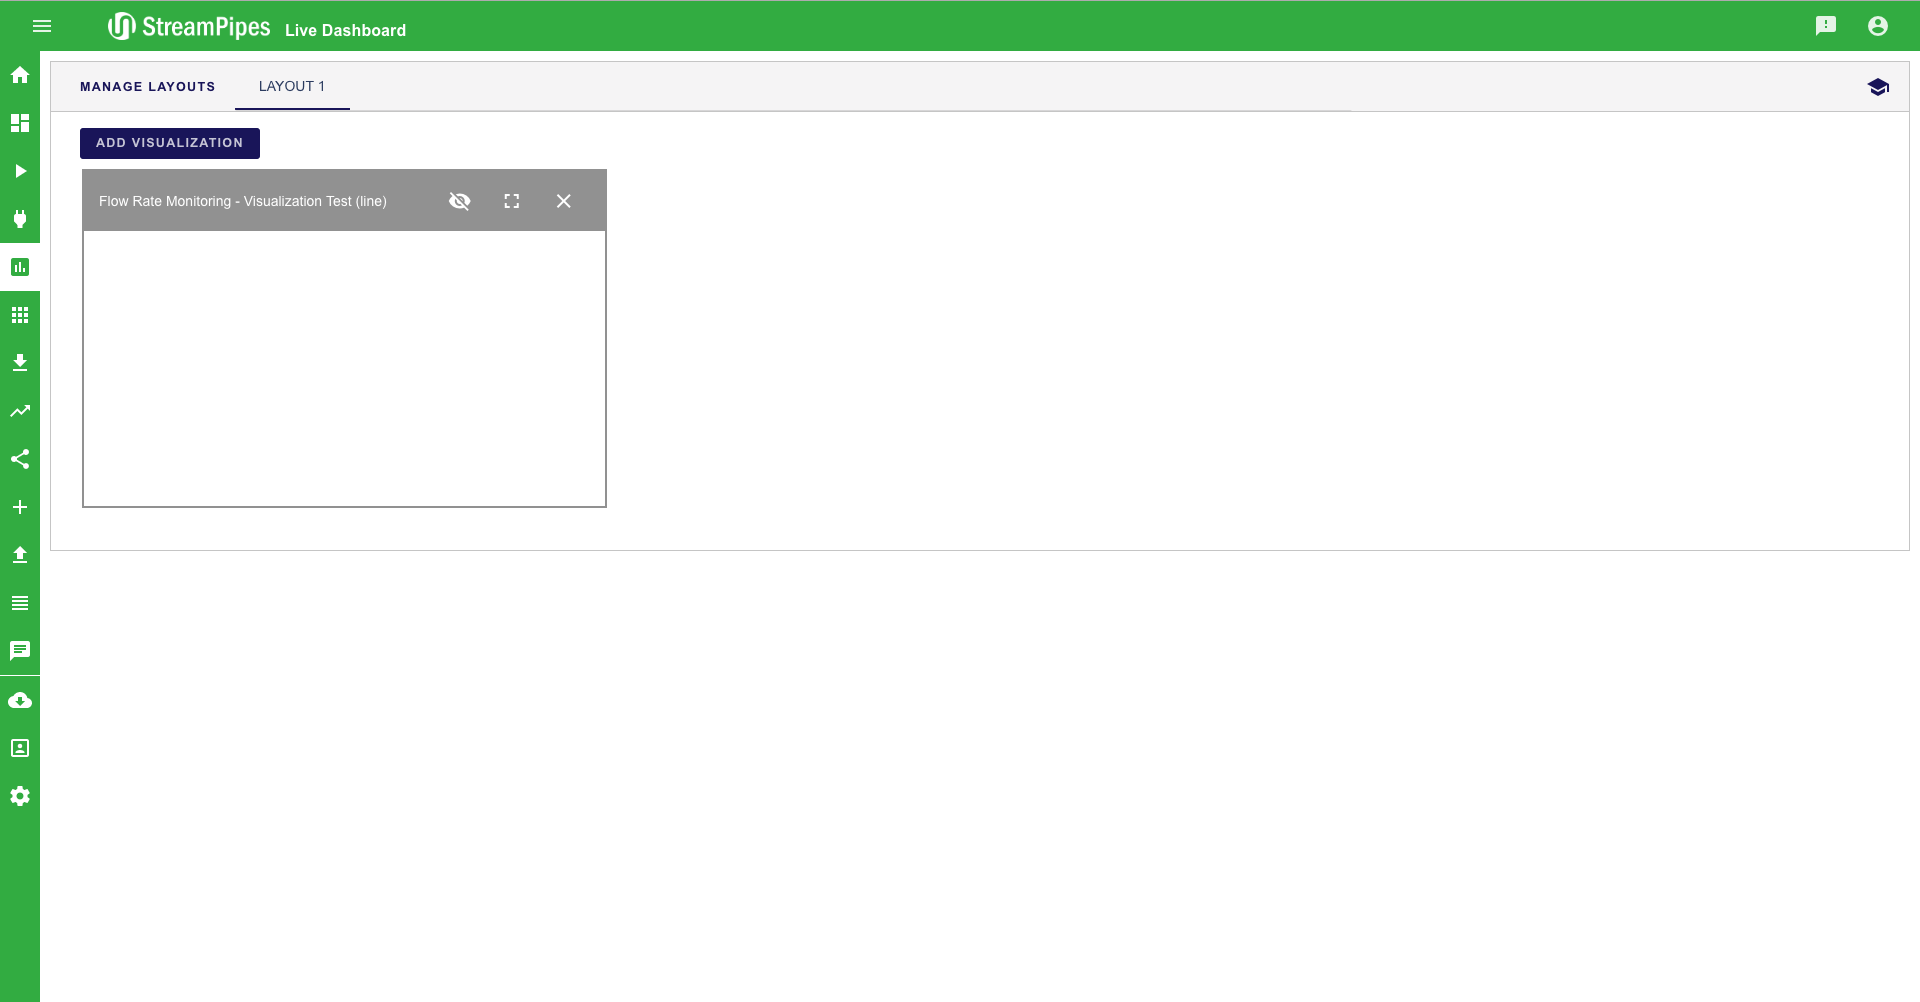
- Congratulation you created the first pipeline and should now see the line chart
Condition monitoring of a water tank
In our second example we are going to create a more complex pipeline. This pipeline has two sources, the flow rate sensor from the previous example and a source measuring the water level in a tank. Our goal is to send a notification when the flow rate stops and the water level in the water tank sinks too fast. In this case a service technician should check the system as soon as possible. This example should just illustrate how the individual components work. Since the system currently uses simulated data each time the situation occurs a notification is triggered.
Now lets start!
Build the pipeline
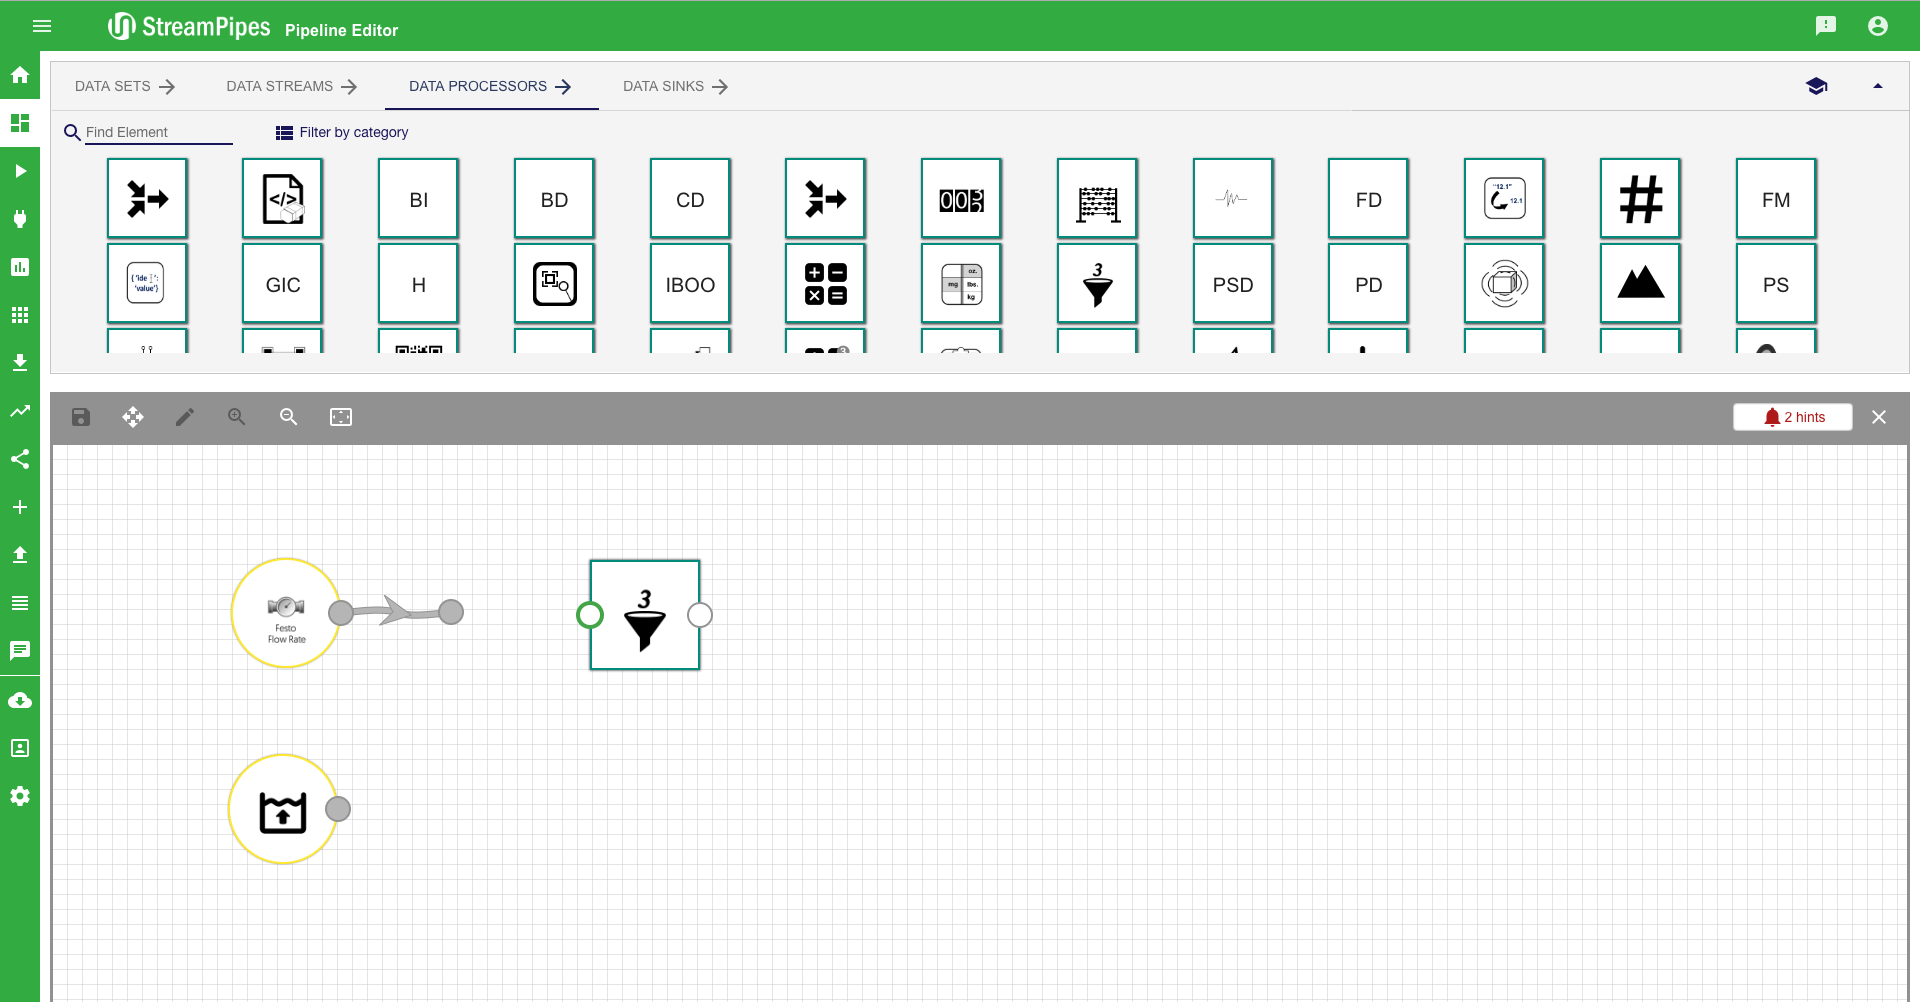
- First we have to select the FRS1 (Flow Rate Sensor 1) and WL1 (Water Level) form the sources tab
- In a first step we want to detect when the flow rate stops
- Use the NF (Numerical Filter) from the processing elements tab and connect it to the FRS1 source
- Configure the Numerical Filter:
- Field name for filter operator: mass_flow
- Filter Operation: <
- Threshold value: 1

- As a next step we add an aggregation to the water level. This reduces the inaccuracies we have because the water moves in the tank.
- Select the A (Aggregation) processing element
- Connect the WL1 with A
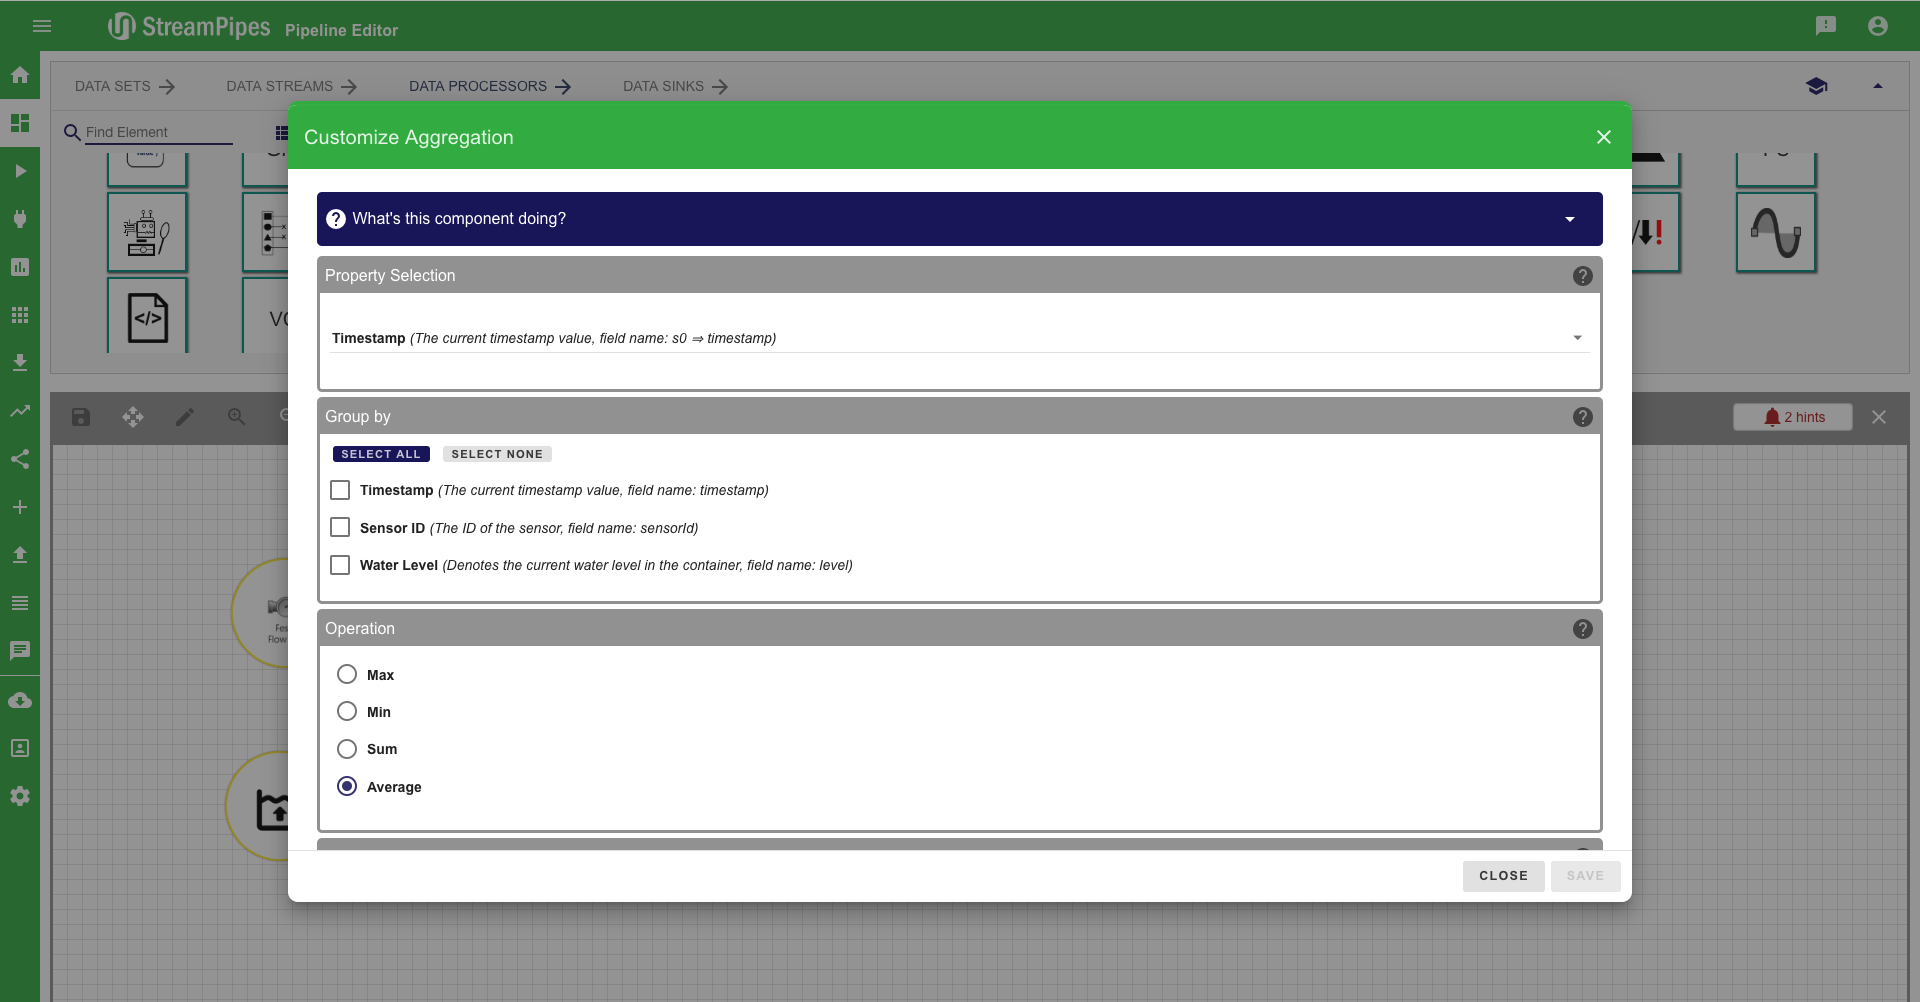
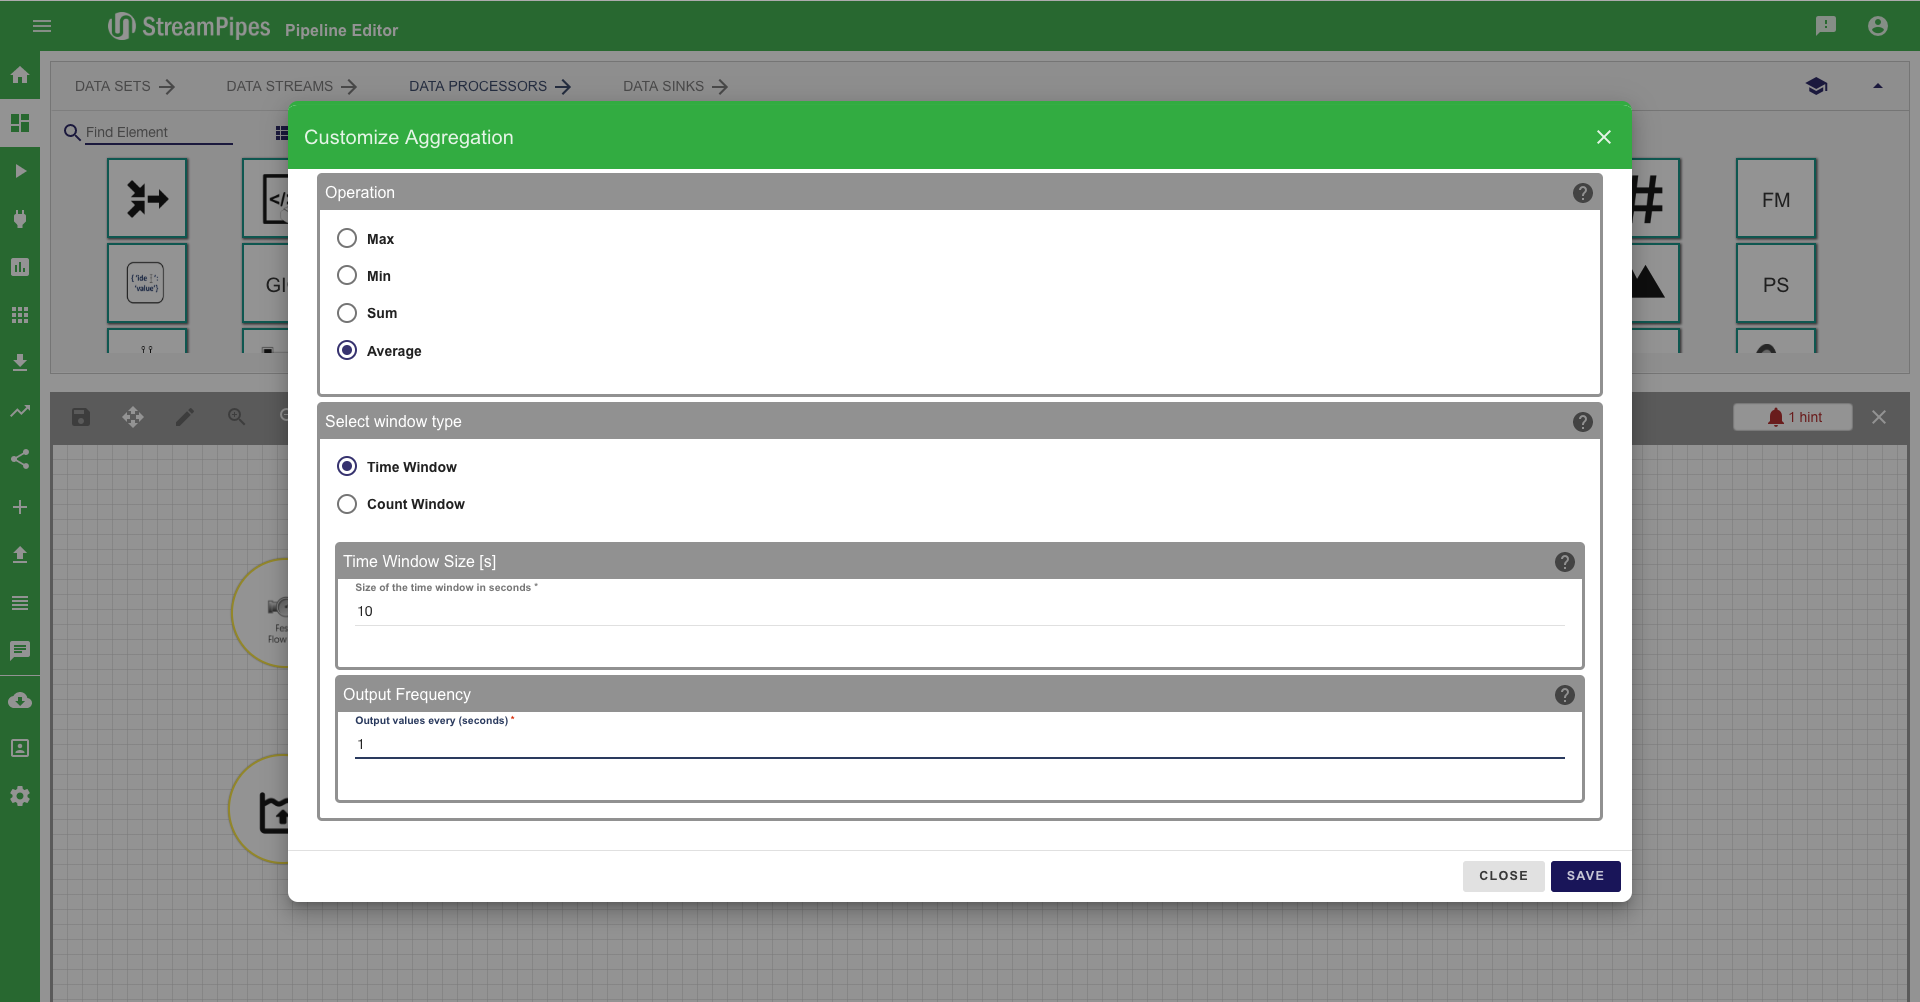
- Configure Aggregation:
- Property Selection: level
- Operation: Average
- Time Window Size: 10
- Output Frequency: 1
- Groupe By: None
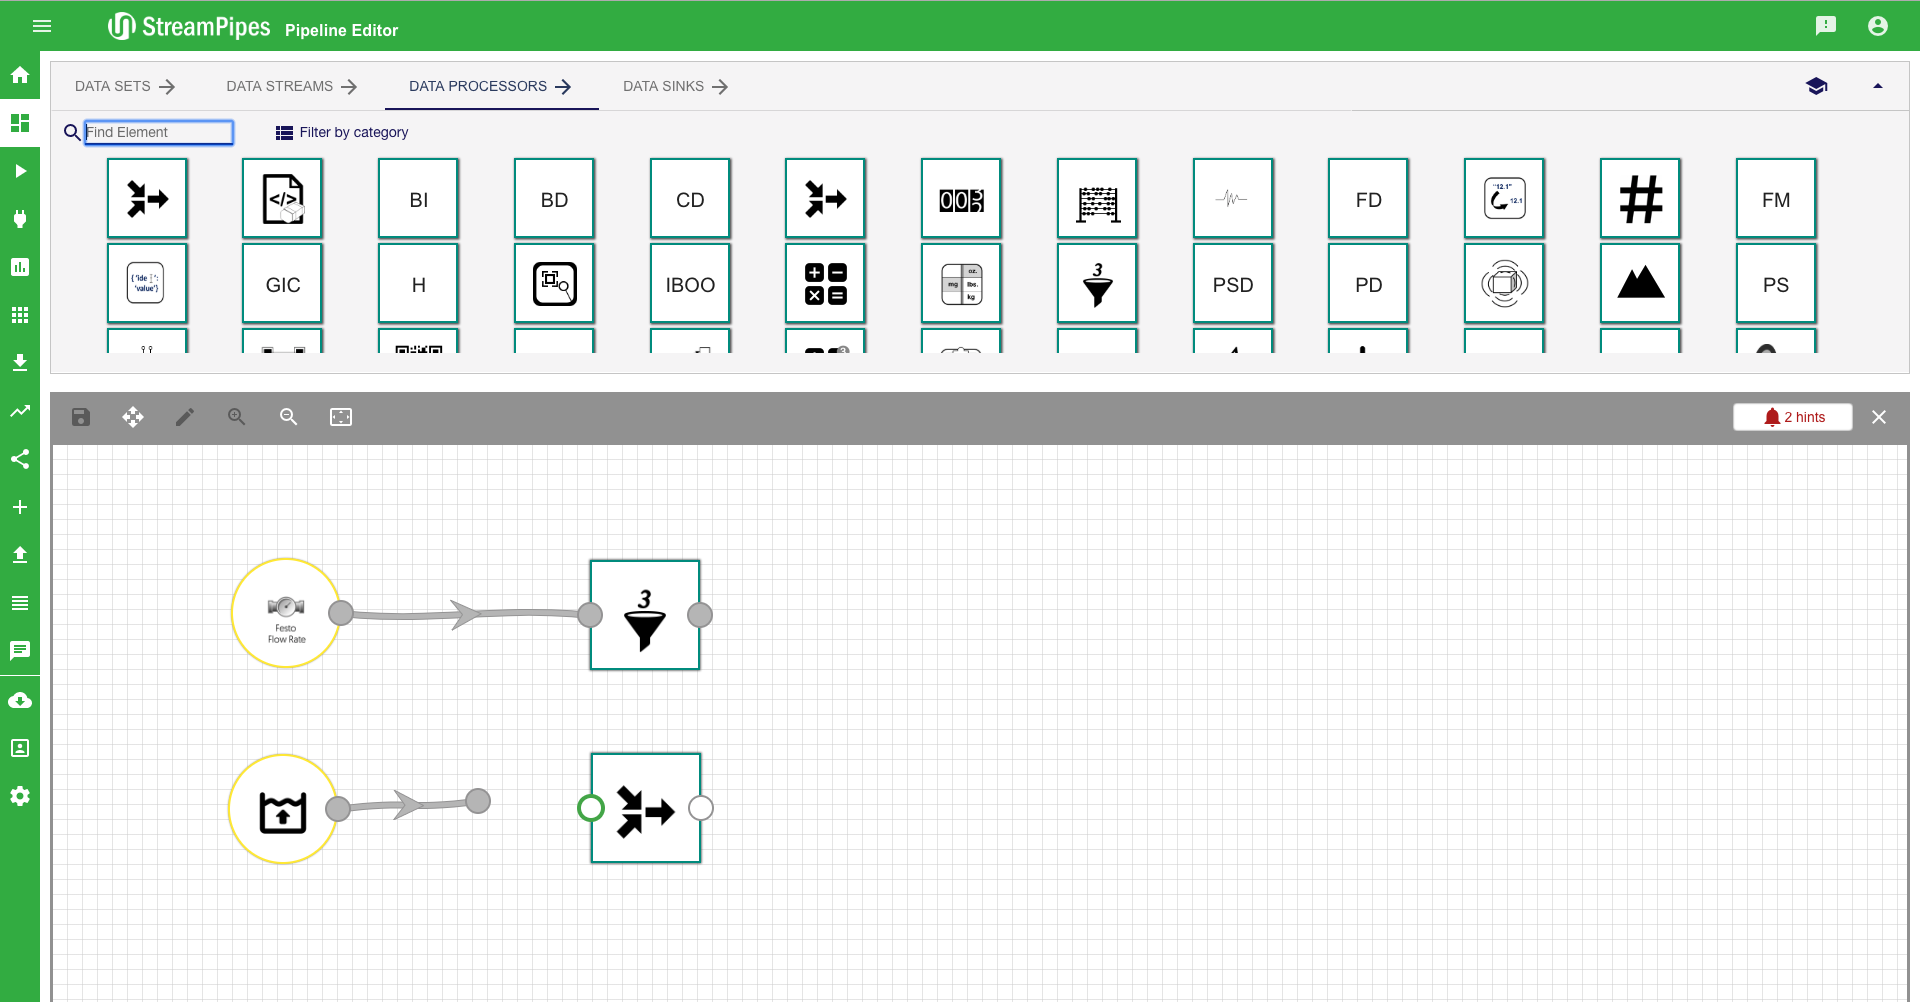
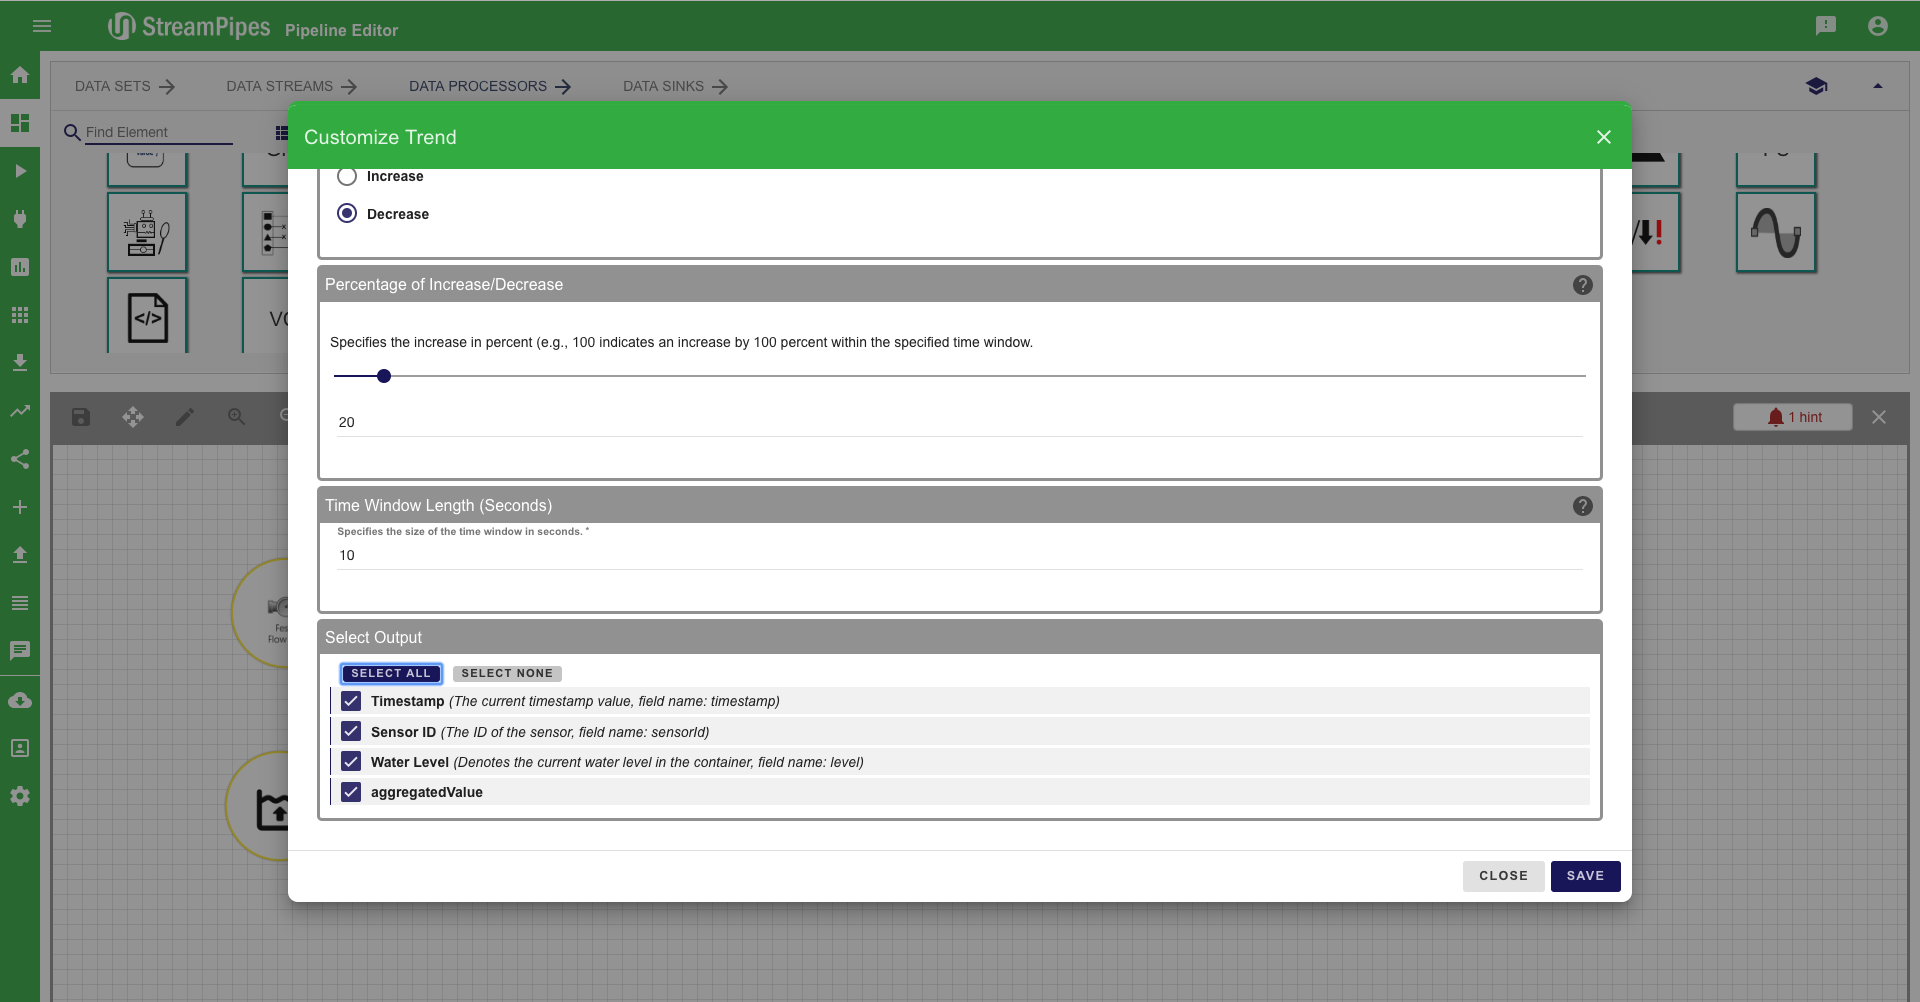
- With the next processing element we check if the water level decreases too fast
- Select I (Trend) and connect it to A
- Configure Trend:
- Timestamp field: timestamp
- Value to observe: aggregatedValue (This value is created by previous element)
- Group by: sensorId
- Increase / Decrease: Decrease
- Percentage of Increase / Decrease: 20
- Time Window Length: 10
- Select Output: All
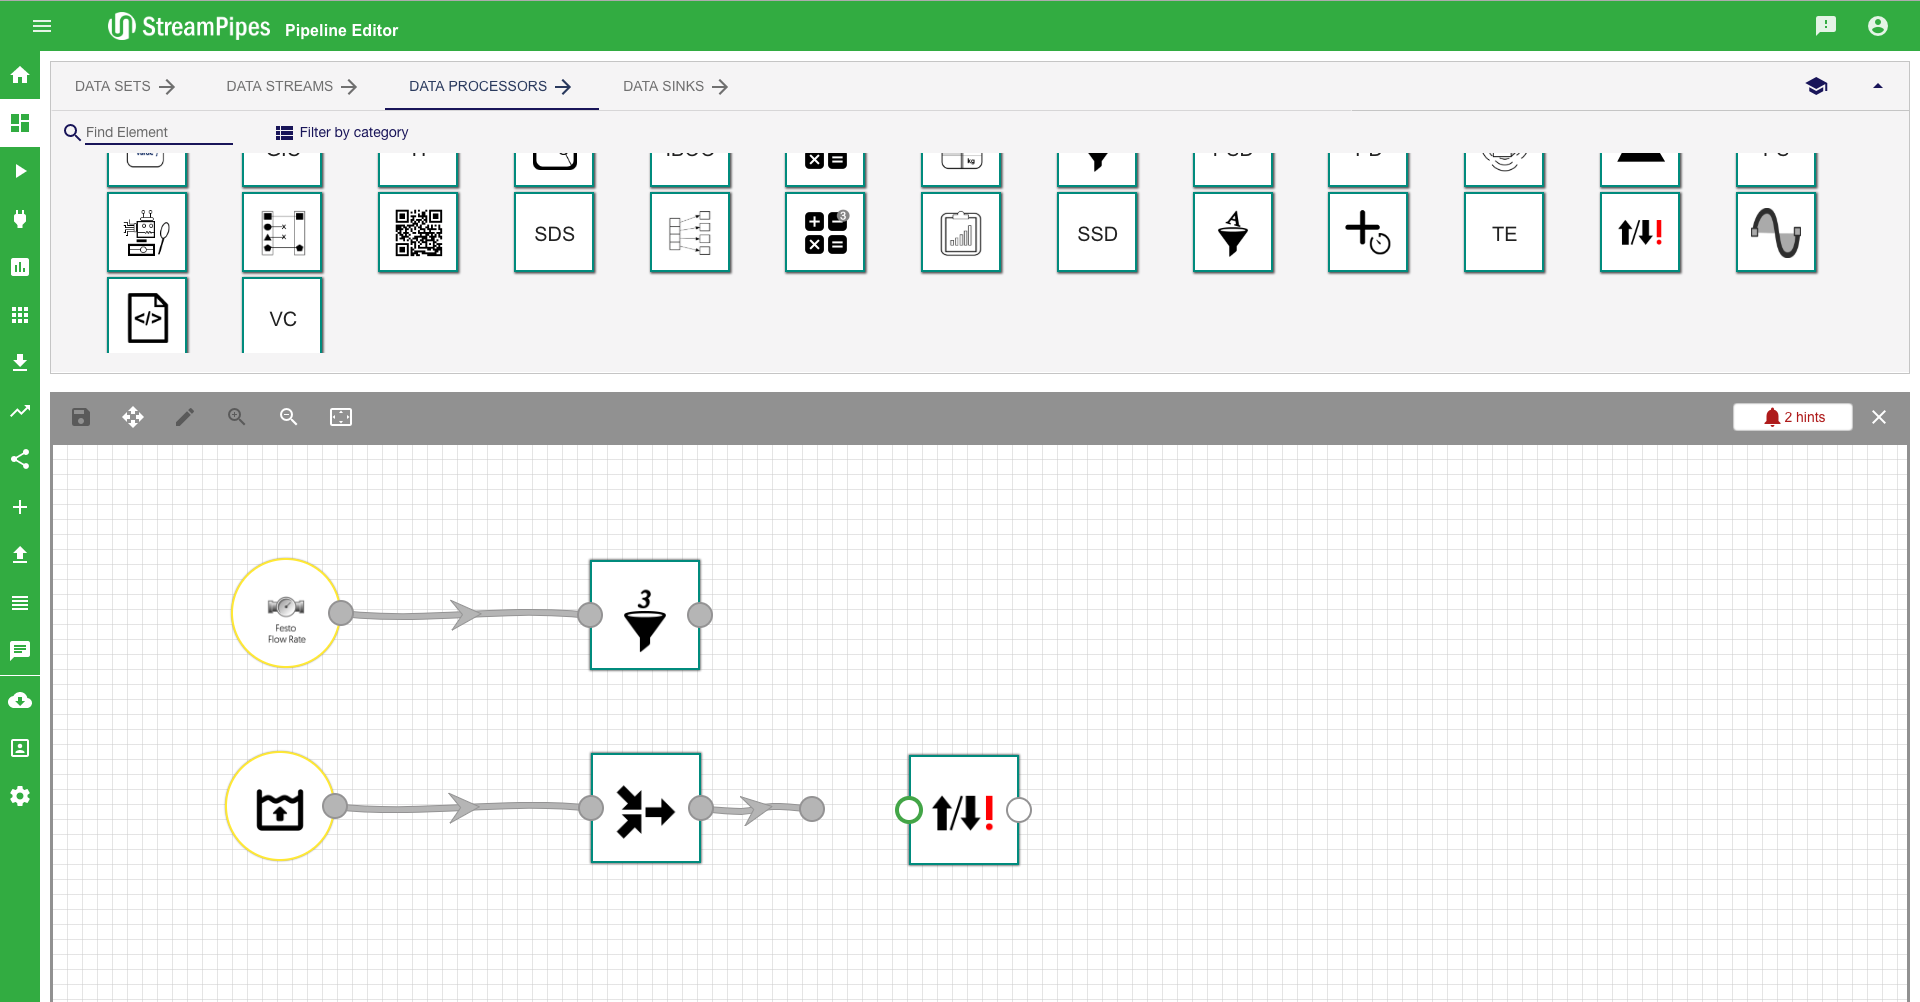
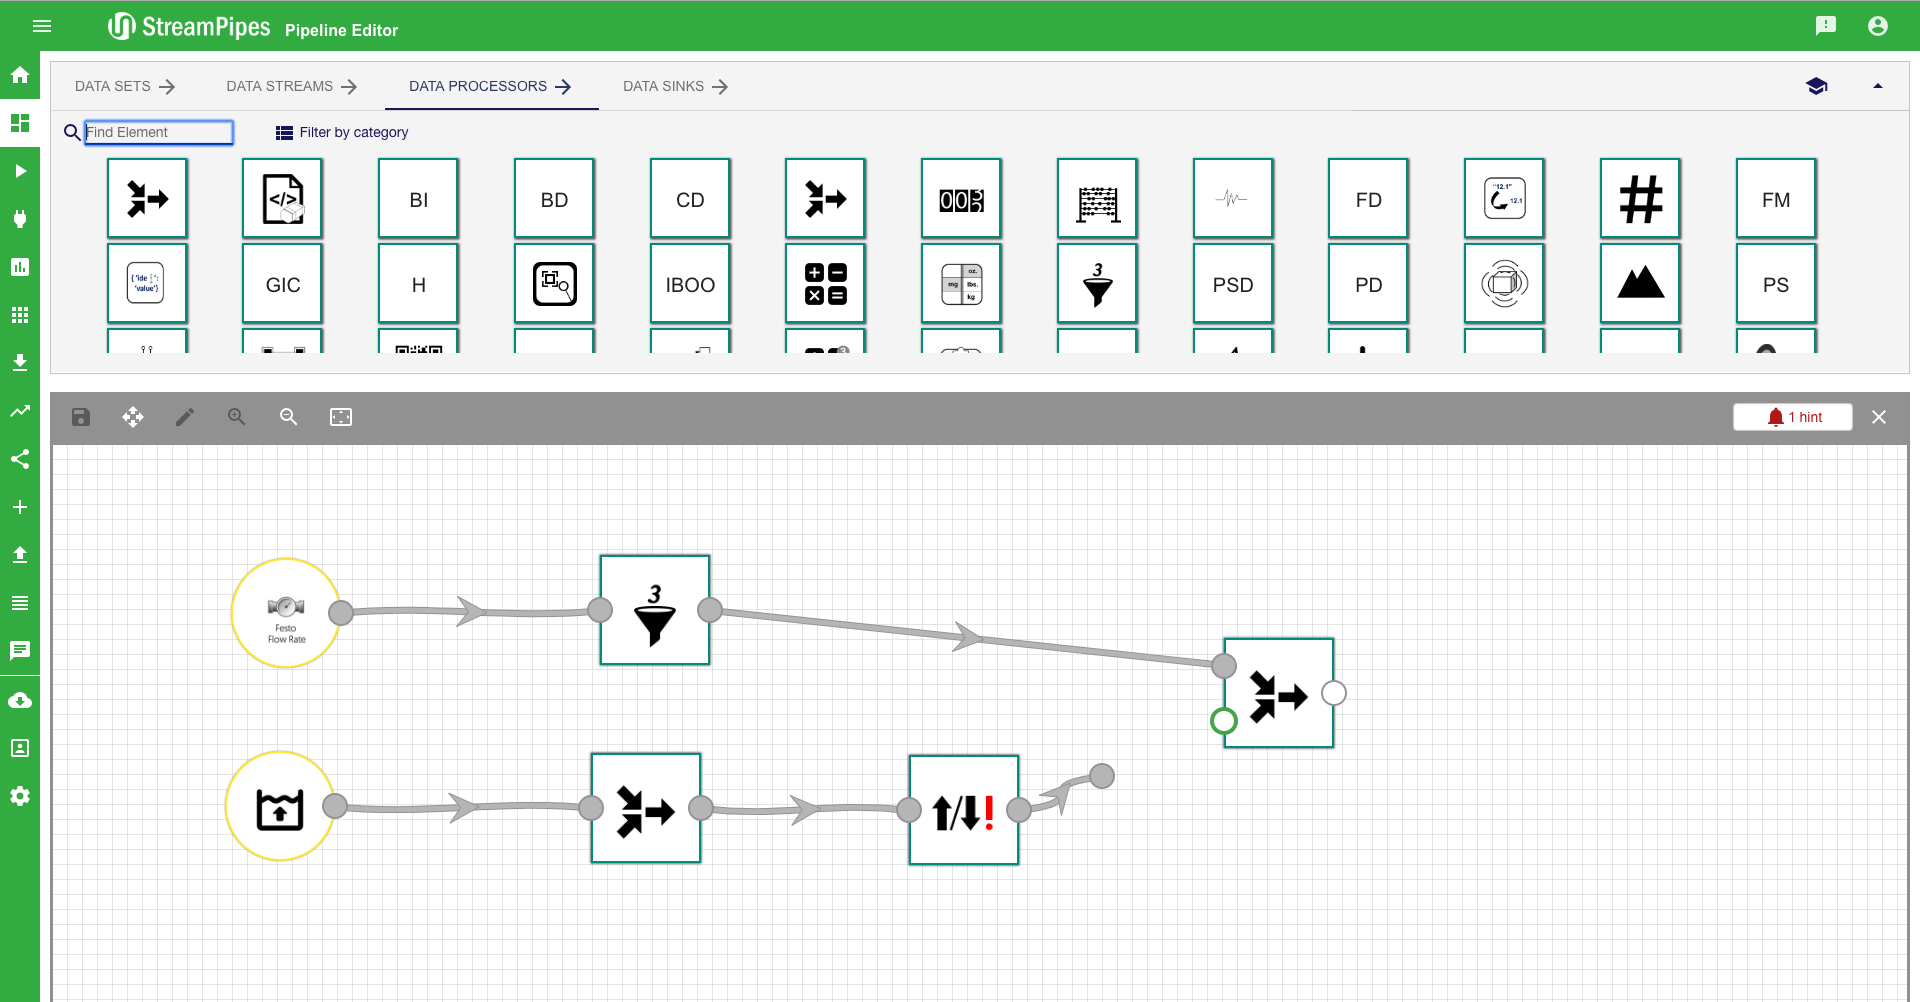
- Now we connect the two stream with the sequence element, which checks if both events occur in a certain time
- Select S (Sequence) and connect both data streams to it
- Configure Sequence:
- Time Window Size: 1
- Time Unit: sec
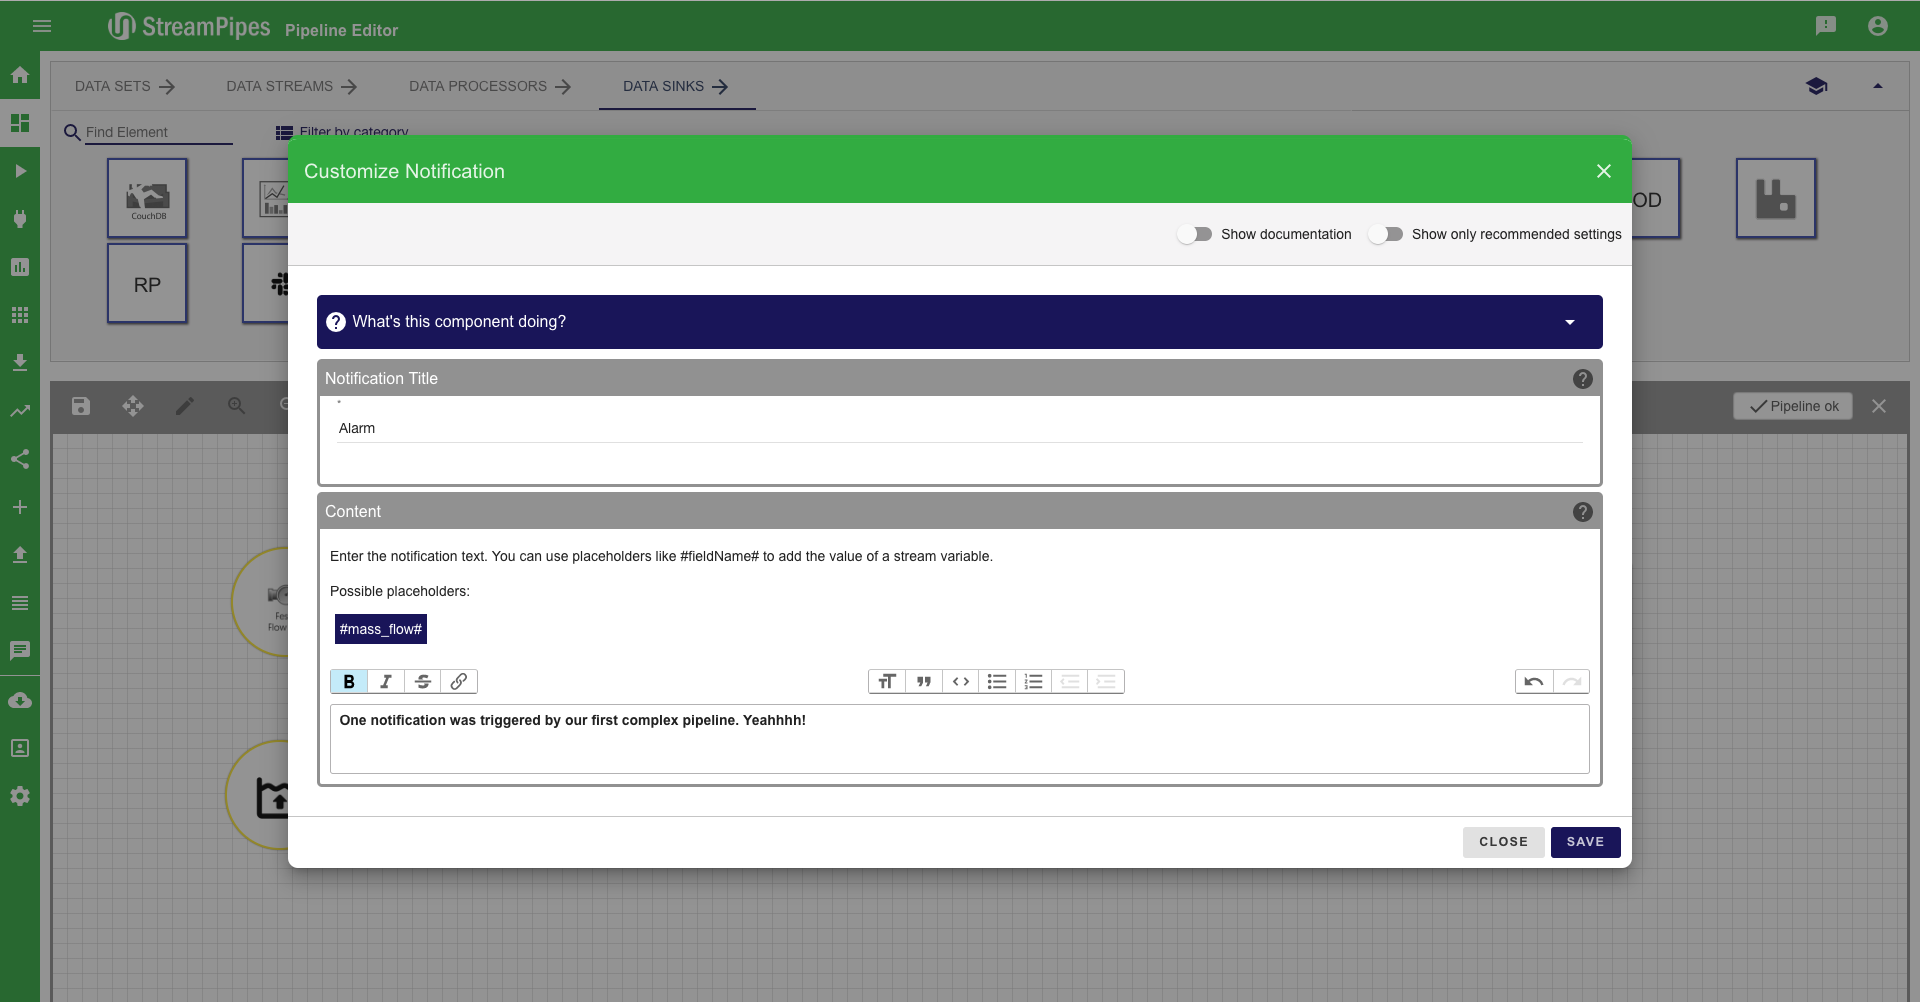
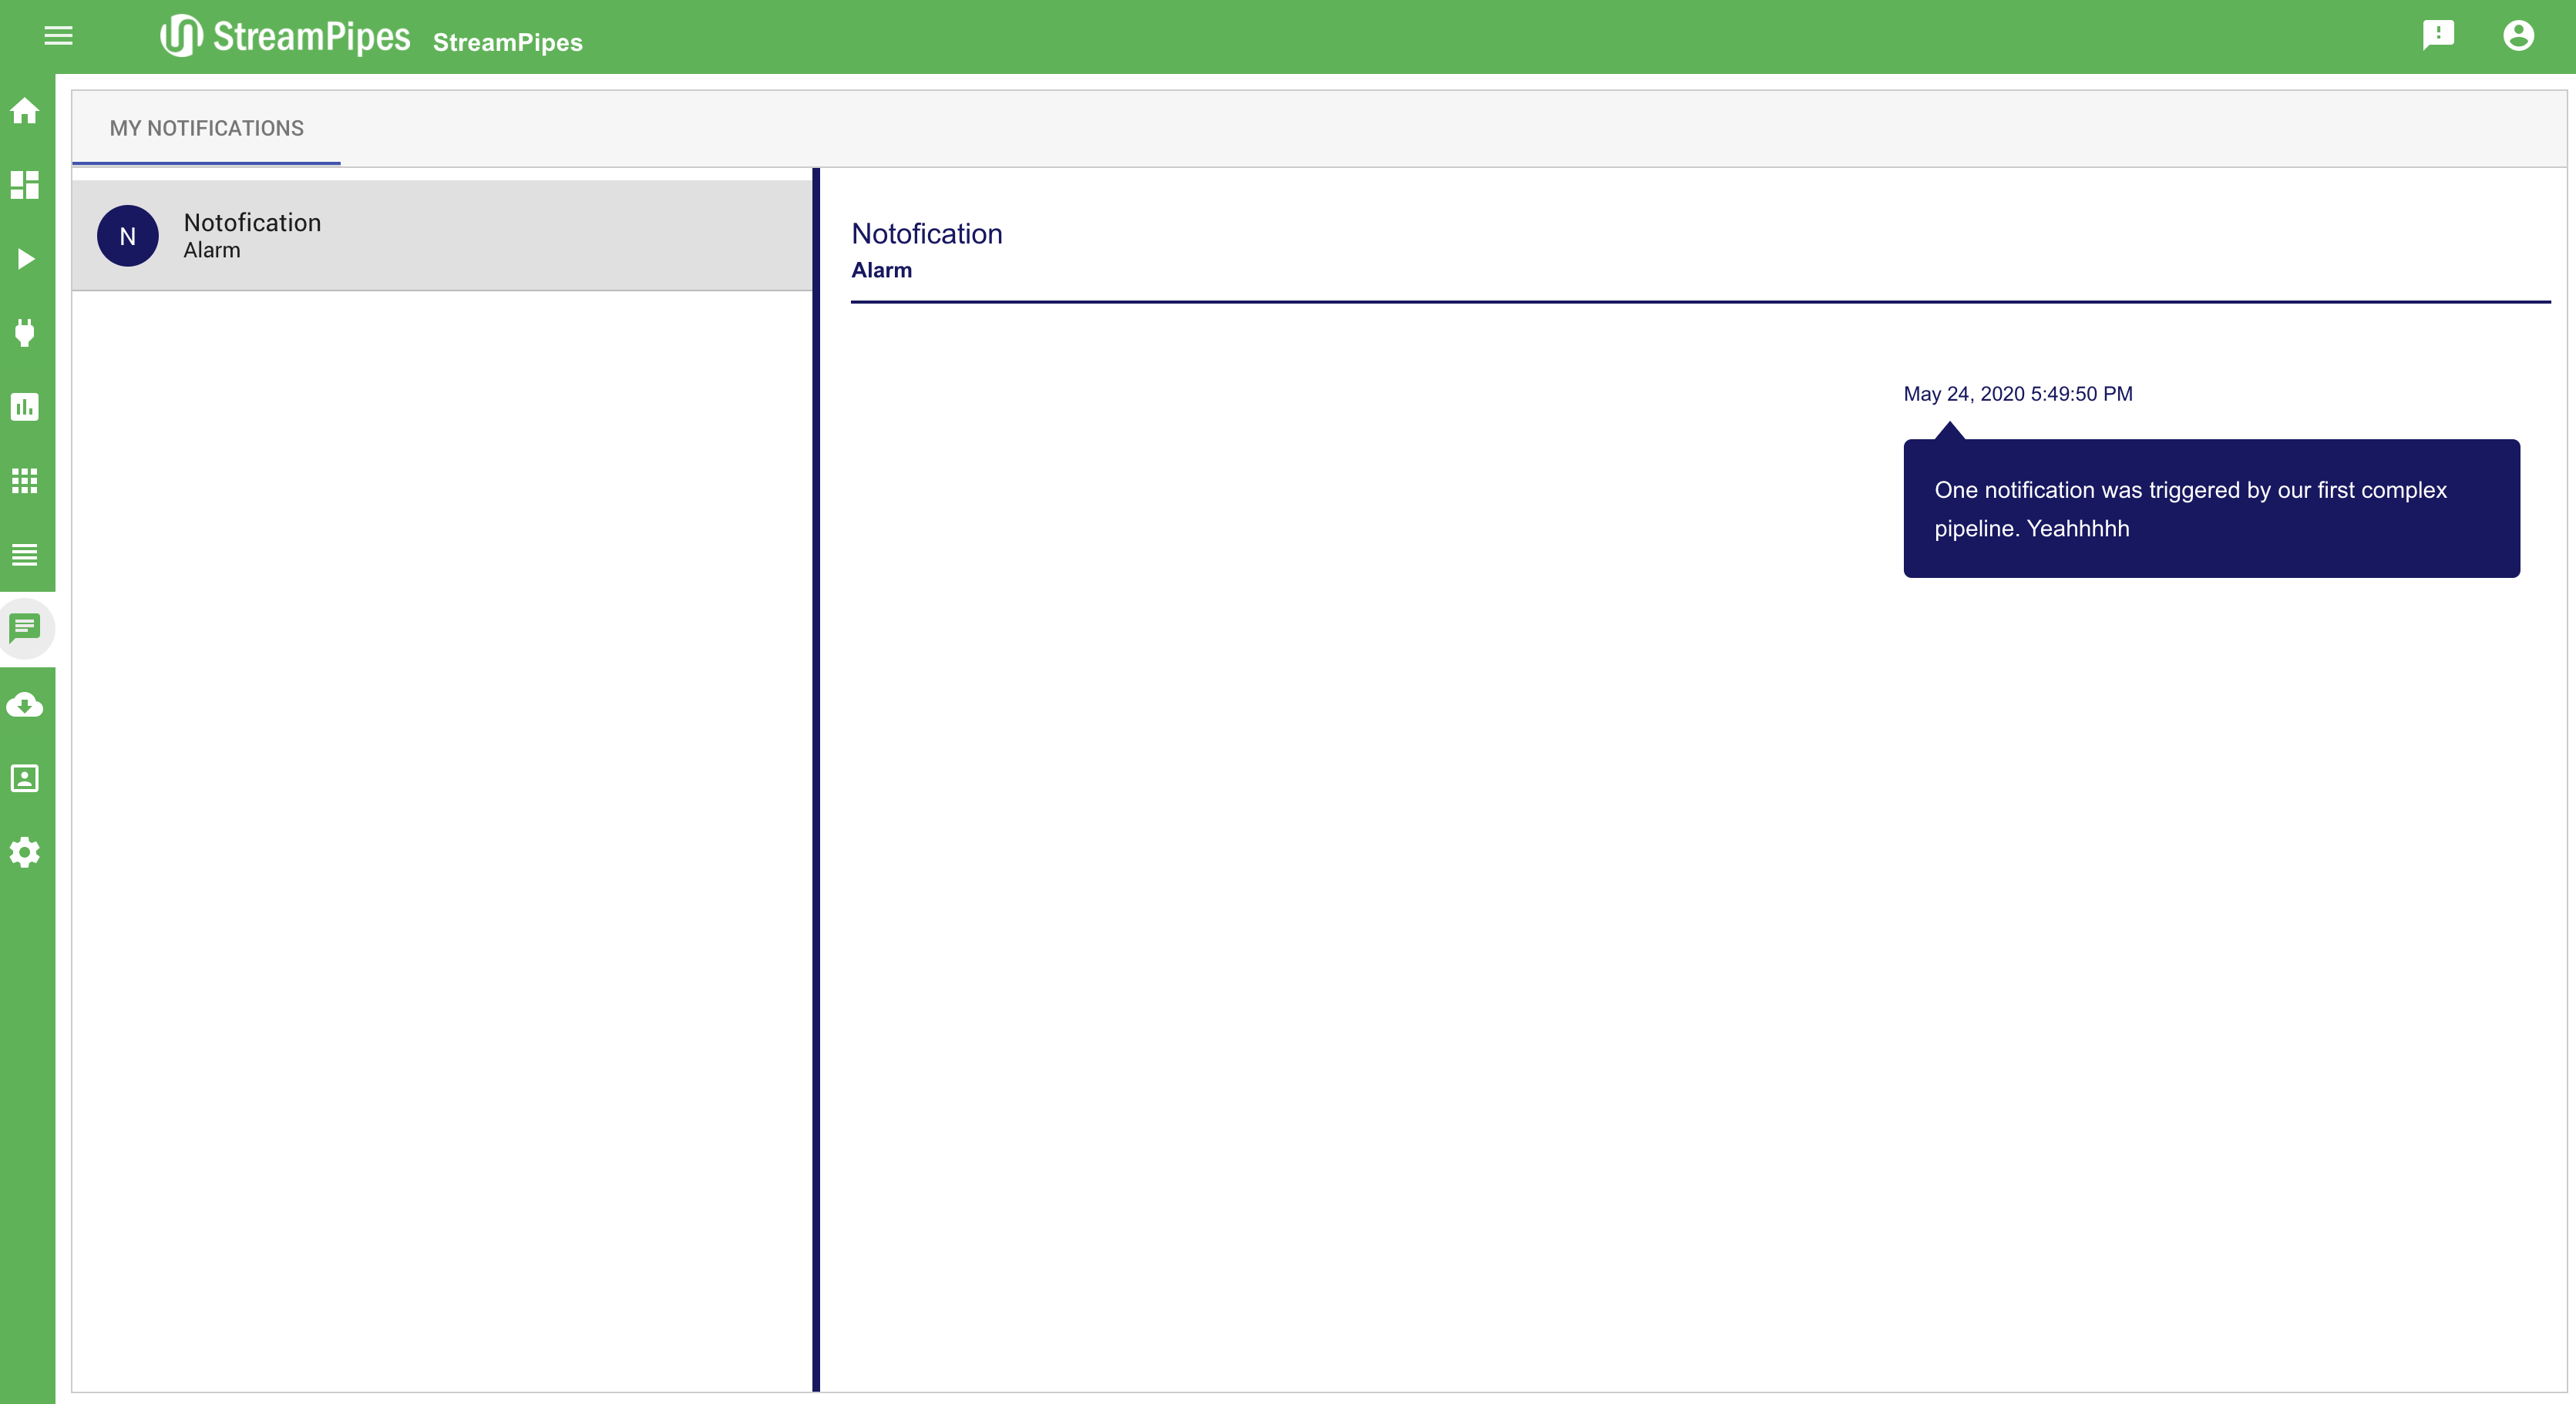
- Now we create a notification for the service technician that something is wrong with the system
- Select N (Notification) from the data sink tab
- Connect S with N
- Configure Notification:
- Notification title: Alarm
- Content: One notification was triggered by our first complex pipeline. Yeahhhh!
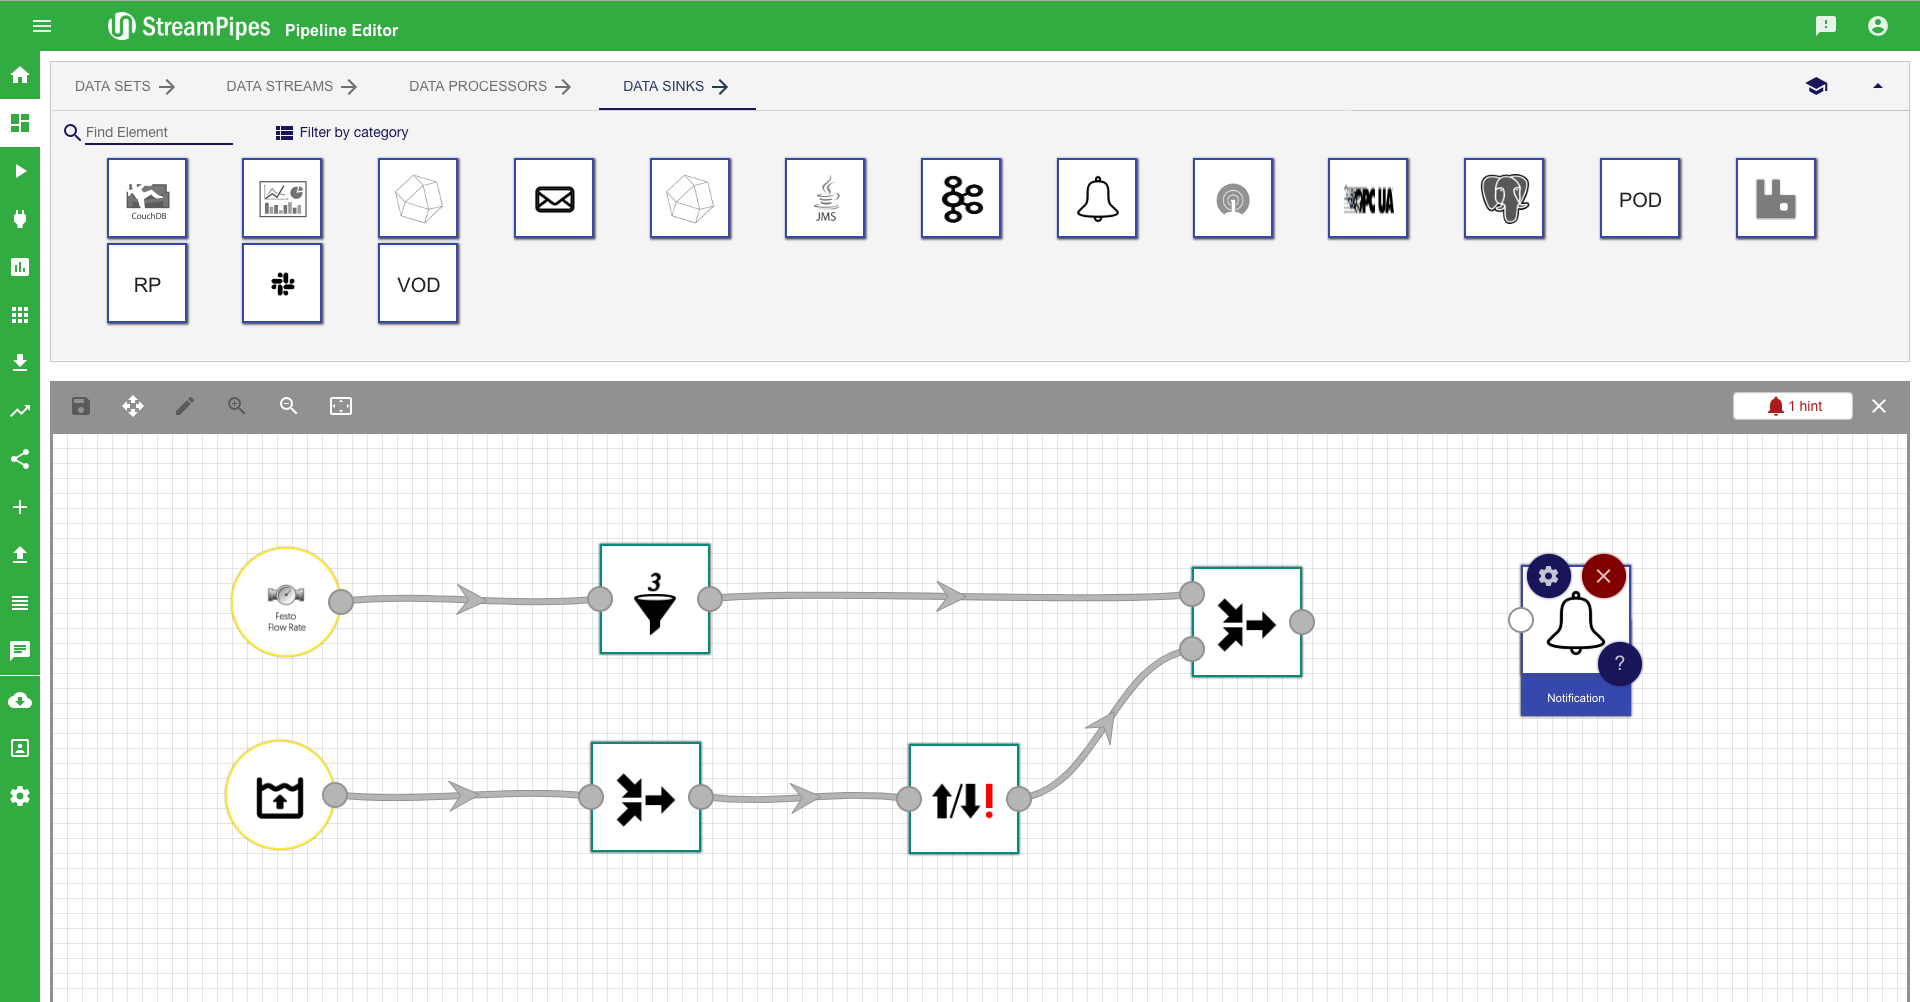
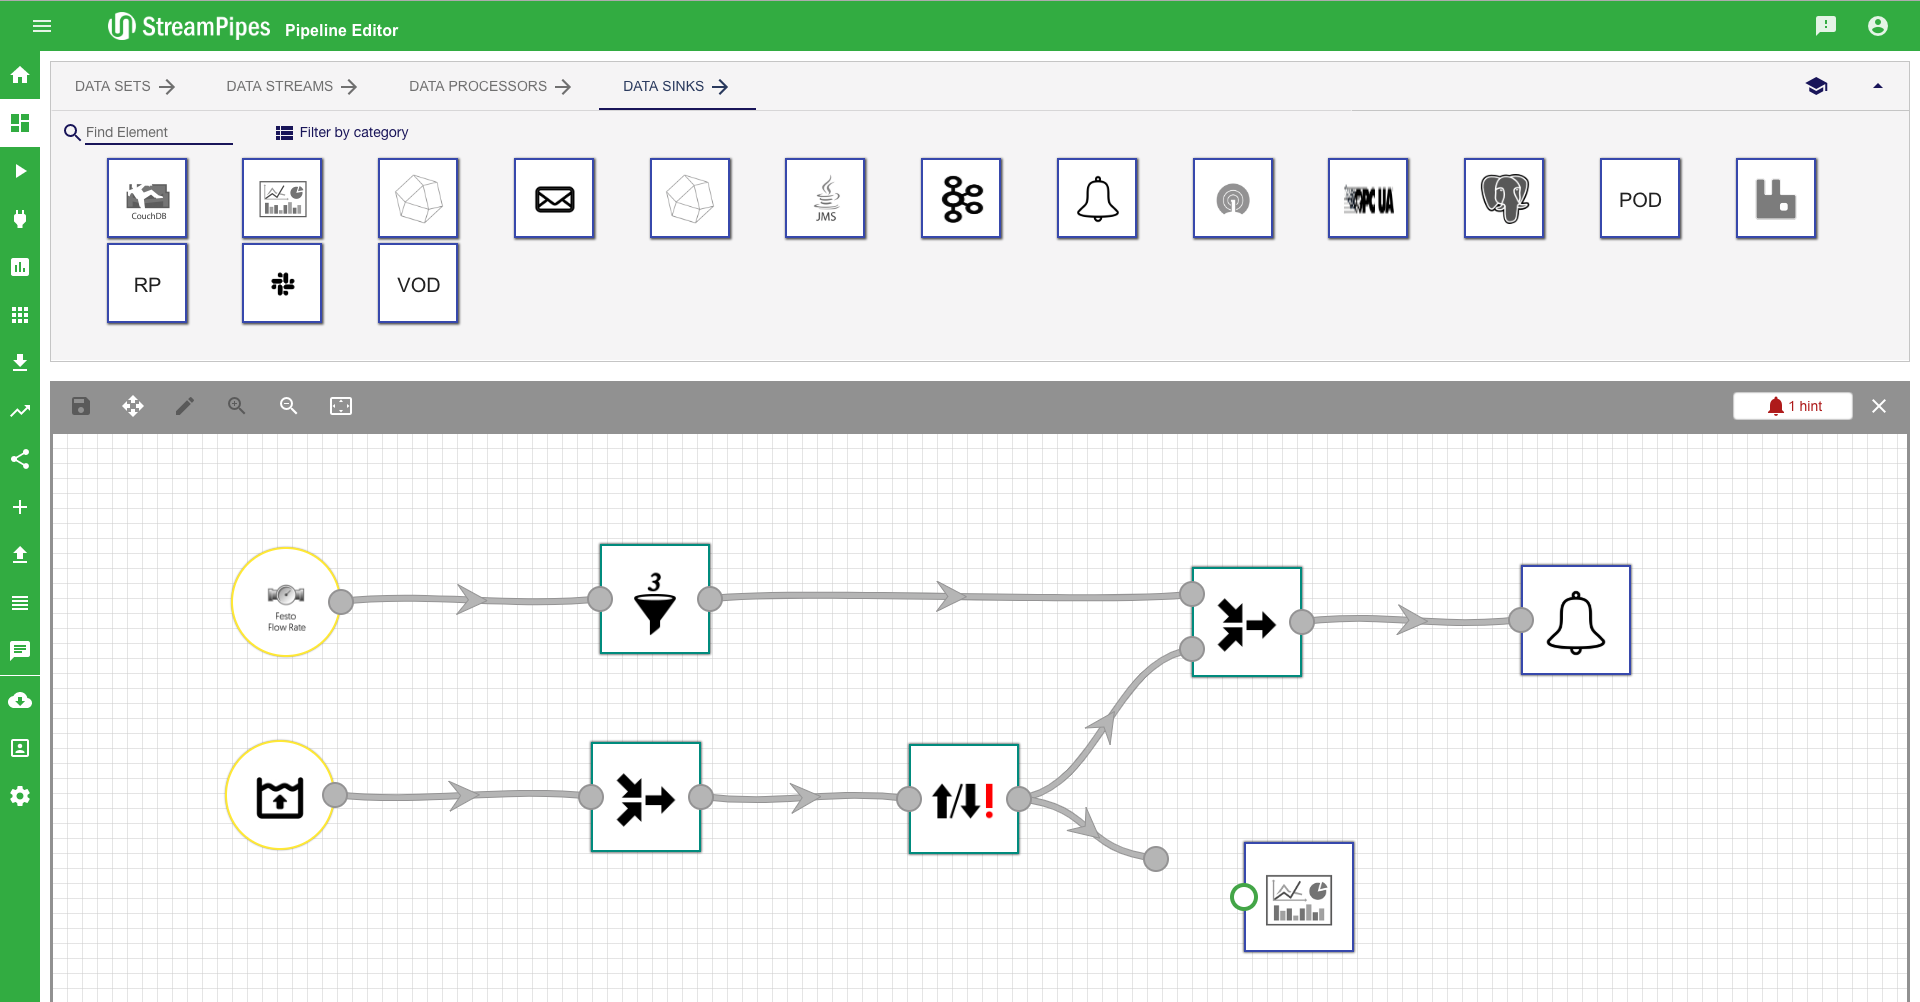
- Add the dashboard sink to the increase element to monitor the preliminary results
- Select DS and connect to I
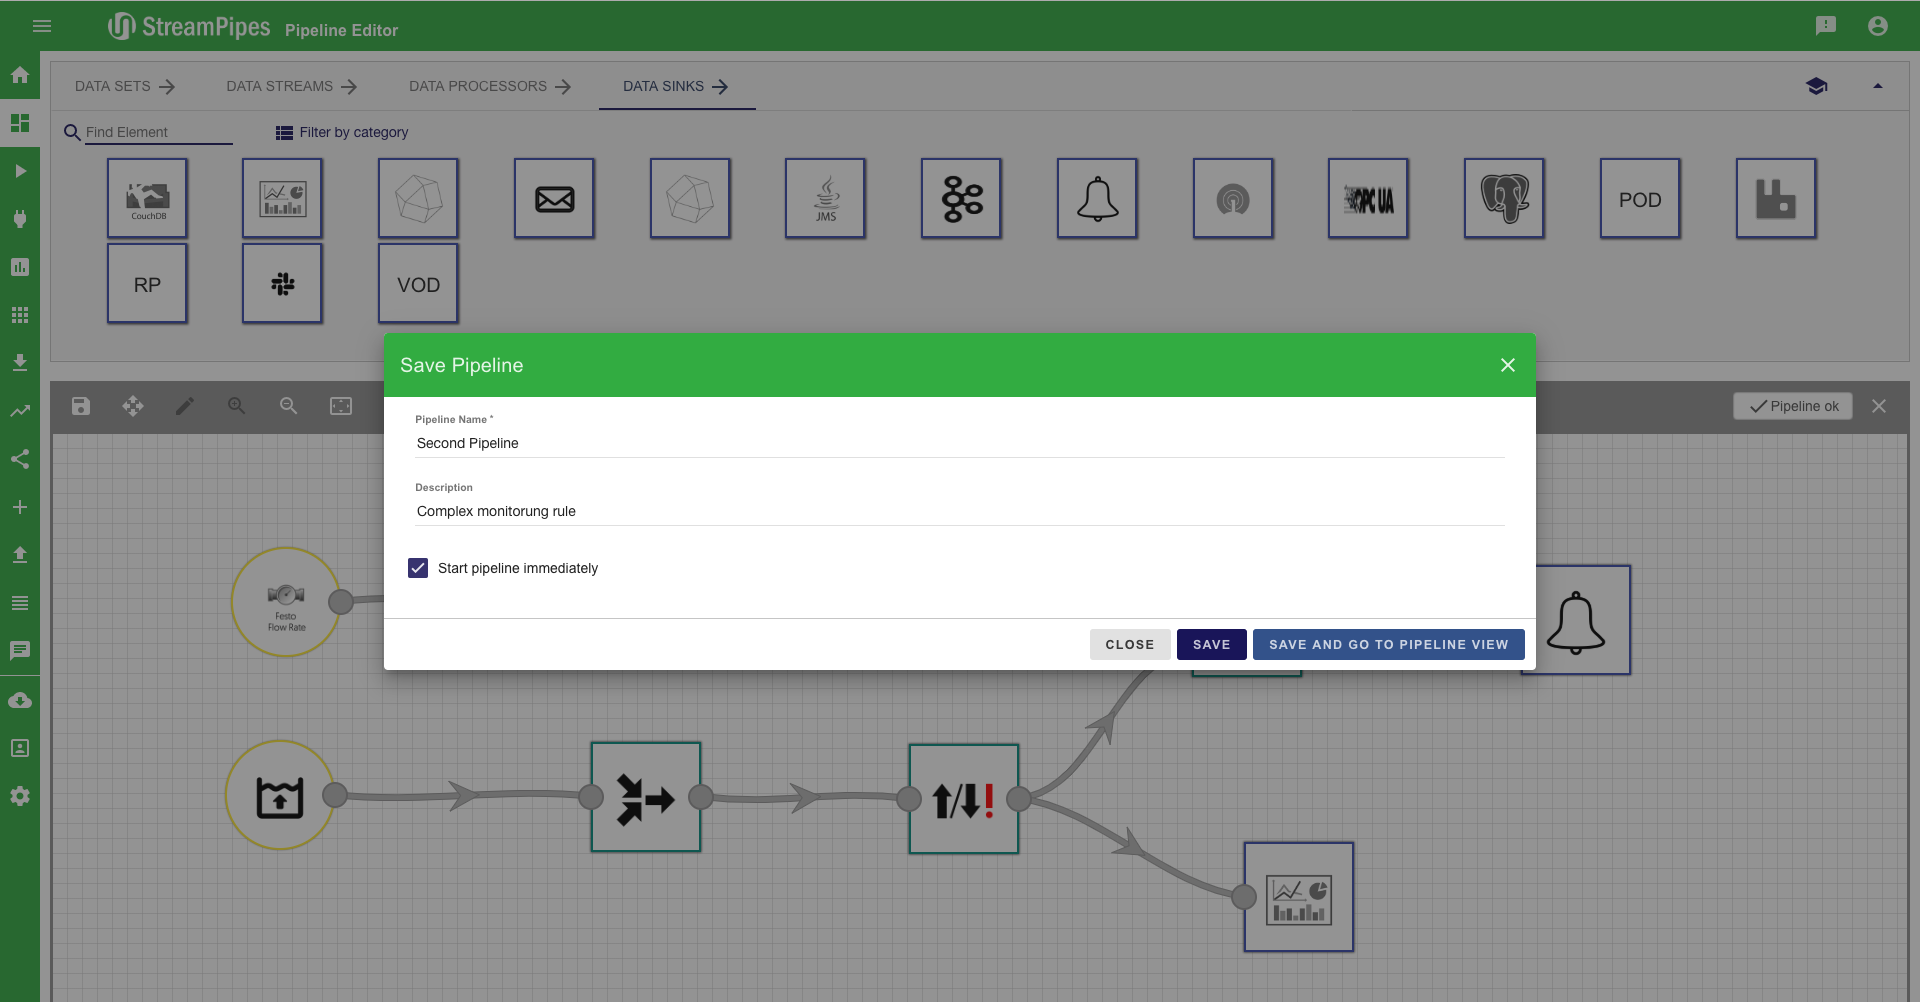
- Save the pipeline
- Save configuration:
- Pipeline Name: Second Pipeline
- Description: Complex monitorung rule
- Start pipeline immediately: CHECK
- Click Save and go to pipeline view
- All pipeline elements should be started successfully
- It can be seen that the elements run on different technologies, in flink and a java container
- http://pe-flink-examples:8090
- http://pe-jvm-examples:8090
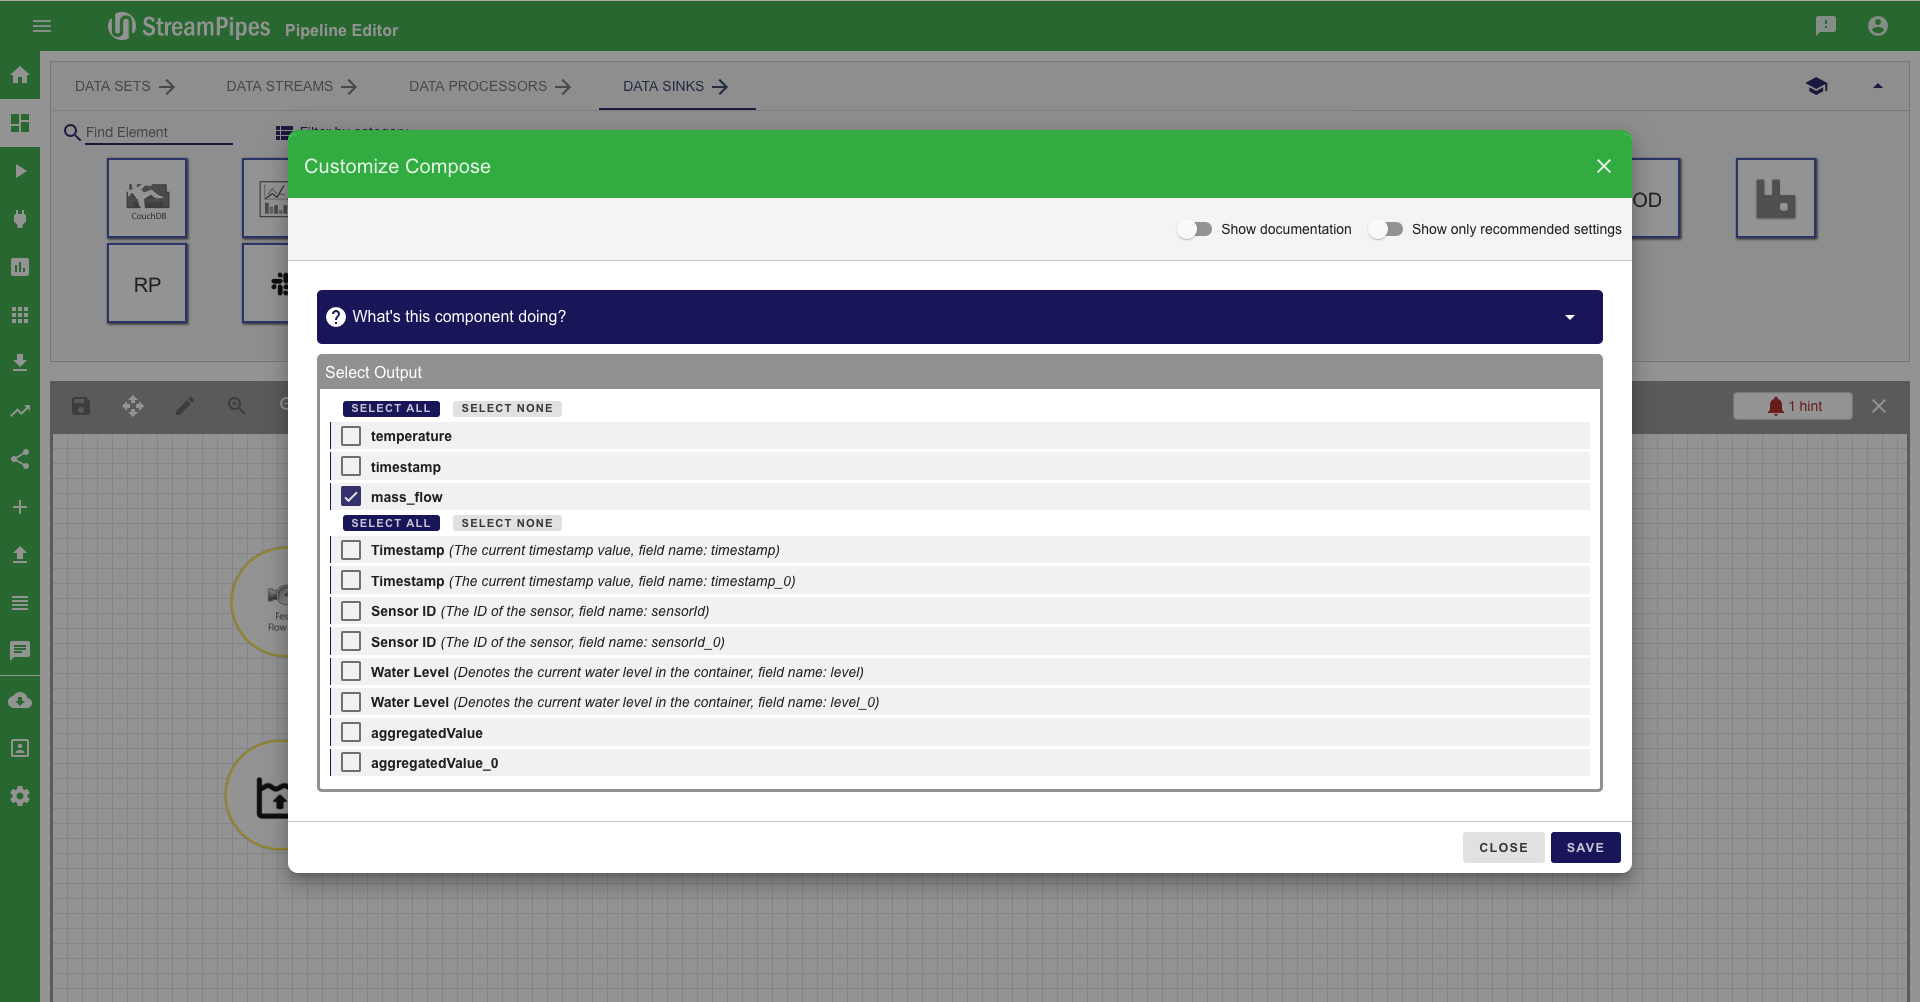
- Go to visualization and create Raw Data visualization for the new pipeline
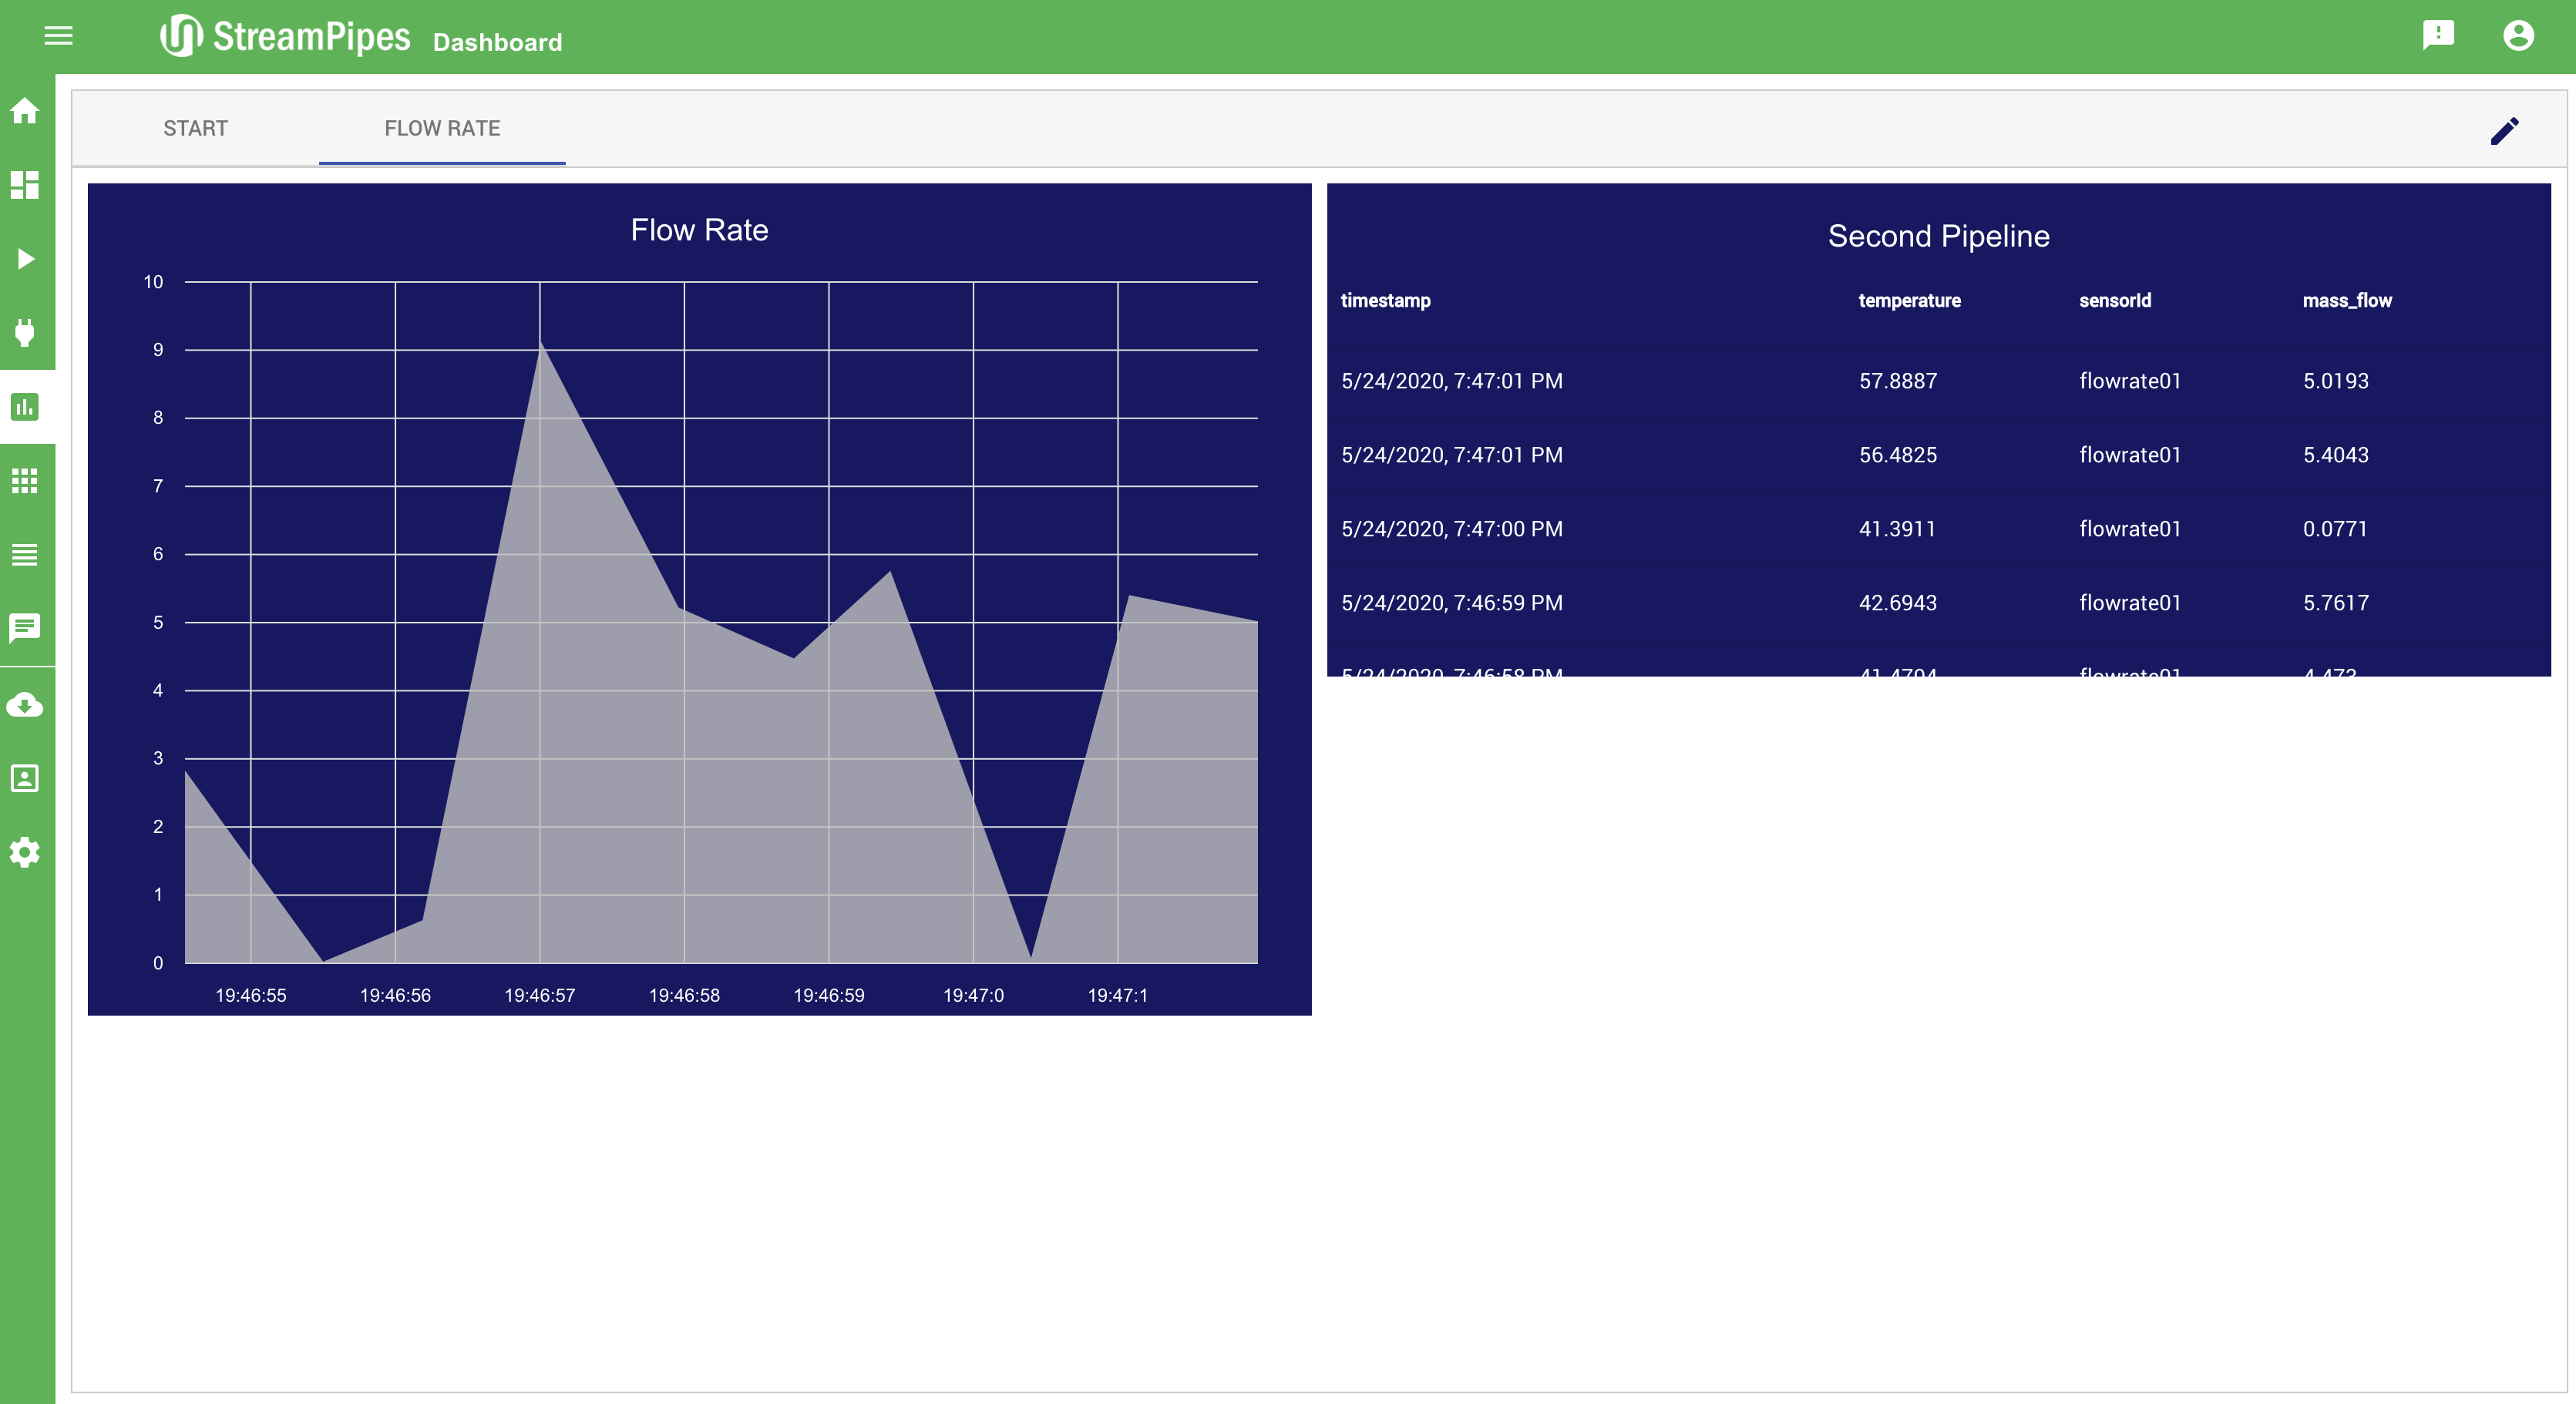
- Every time you can see output in the Raw Data visualization of the new pipeline and the Line Chart from the first example are zero, a Notification is triggered by the pipeline.
- Go to the Notifications view and have a look at the notification
Congratulation you finished the quick start! It is recommended to stop the last pipeline, because it will keep creating notifications ;)
We hope we gave you an easy quick start into StreamPipes. If you have any questions or suggestions, just send us an email. From here on you can explore all features in the User Guide or go to the Developer Guide to learn how to write your own StreamPipes processing elements.