
In many manufacturing settings, maintenance is still scheduled at fixed time intervals — often based on past experience rather than actual machine usage. This approach can lead to unnecessary servicing or, worse, unexpected breakdowns. A common limitation is that many machines, especially older ones, offer only minimal sensor data, making advanced maintenance strategies seem out of reach.
However, with Apache StreamPipes, even limited data — such as a simple boolean signal indicating activity — can be leveraged to implement usage-based maintenance. In this blog post, we demonstrate how this is achieved using a real-world example: a packaging machine that processes goods at high throughput. You'll learn how to count machine operations, store event data, visualize usage over time, and trigger notifications when maintenance is due — all with just a few clicks in StreamPipes.
The Scenario: Packaging Machine Monitoring
Let’s consider a packaging machine that wraps goods into individual packages. The wear and tear on this machine is directly related to the number of items processed. However, due to the machine’s age, only minimal data is available.
Currently:
- Maintenance occurs at fixed intervals.
- These intervals were determined on the basis of the technicians' experience.
- There is suspicion that maintenance is done too frequently, leading to unnecessary costs.
With Apache StreamPipes, we’ll build a pipeline that:
- Counts packaging operations in real time.
- Stores data for analysis and visualization.
- Sends notifications once a maintenance threshold is reached.
The Data: A Simple Boolean Signal
The machine provides a boolean flag — active — which is true when a packaging operation occurs.
This flag is streamed using an Apache StreamPipes S7 adapter. The stream also includes a few additional process parameters:
| Timestamp | active | ... |
|---|---|---|
| 1719897720887 | false | ... |
| 1719897721952 | true | ... |
| 1719897722952 | true | ... |
| ... | ... | ... |
Part 1: Absolute Counter with Notification
We’ll begin by building a pipeline that counts how often the machine packages a product and sends an email alert when a predefined threshold is reached.
Pipeline Overview
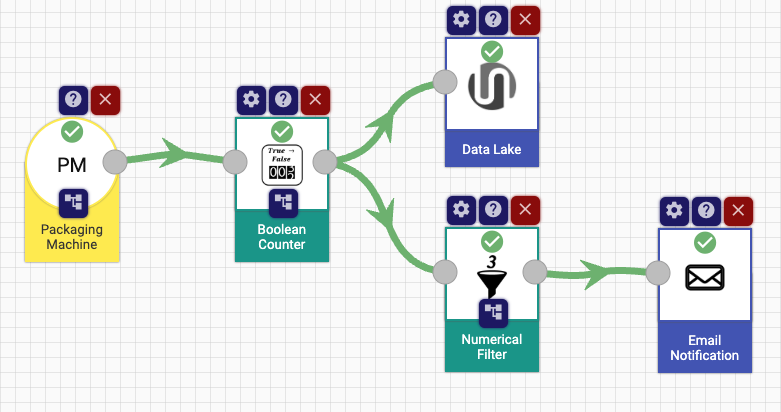
A simple StreamPipes pipeline for monitoring the parts produced at the machine
Step-by-Step Guide
Add the Data Source
- Drag the data stream of the packaging machine into the pipeline editor.
Insert the
Boolean CounterProcessor- Monitors a boolean field and counts transitions (e.g.,
false → true). - Configuration:
- Boolean Field:
active - Flank Parameter:
FALSE → TRUE
- Boolean Field:
The processor emits a new event each time the machine packages an item, incrementing a
countervalue.- Monitors a boolean field and counts transitions (e.g.,
Persist the Count
- Add the Data Lake sink to store these events for visualization.
Add a Threshold Alert
- Insert the
Numerical Filterprocessor.- Field:
counter - Filter Operation:
> - Threshold:
100000
- Field:
- Connect this to the Email Notification sink.
- Configure recipient, subject, and set the Silent Period to avoid spamming the team.
- Insert the
Visualize in Dashboard
- Start the pipeline.
- In the dashboard, add an Indicator Widget displaying the
countervalue.
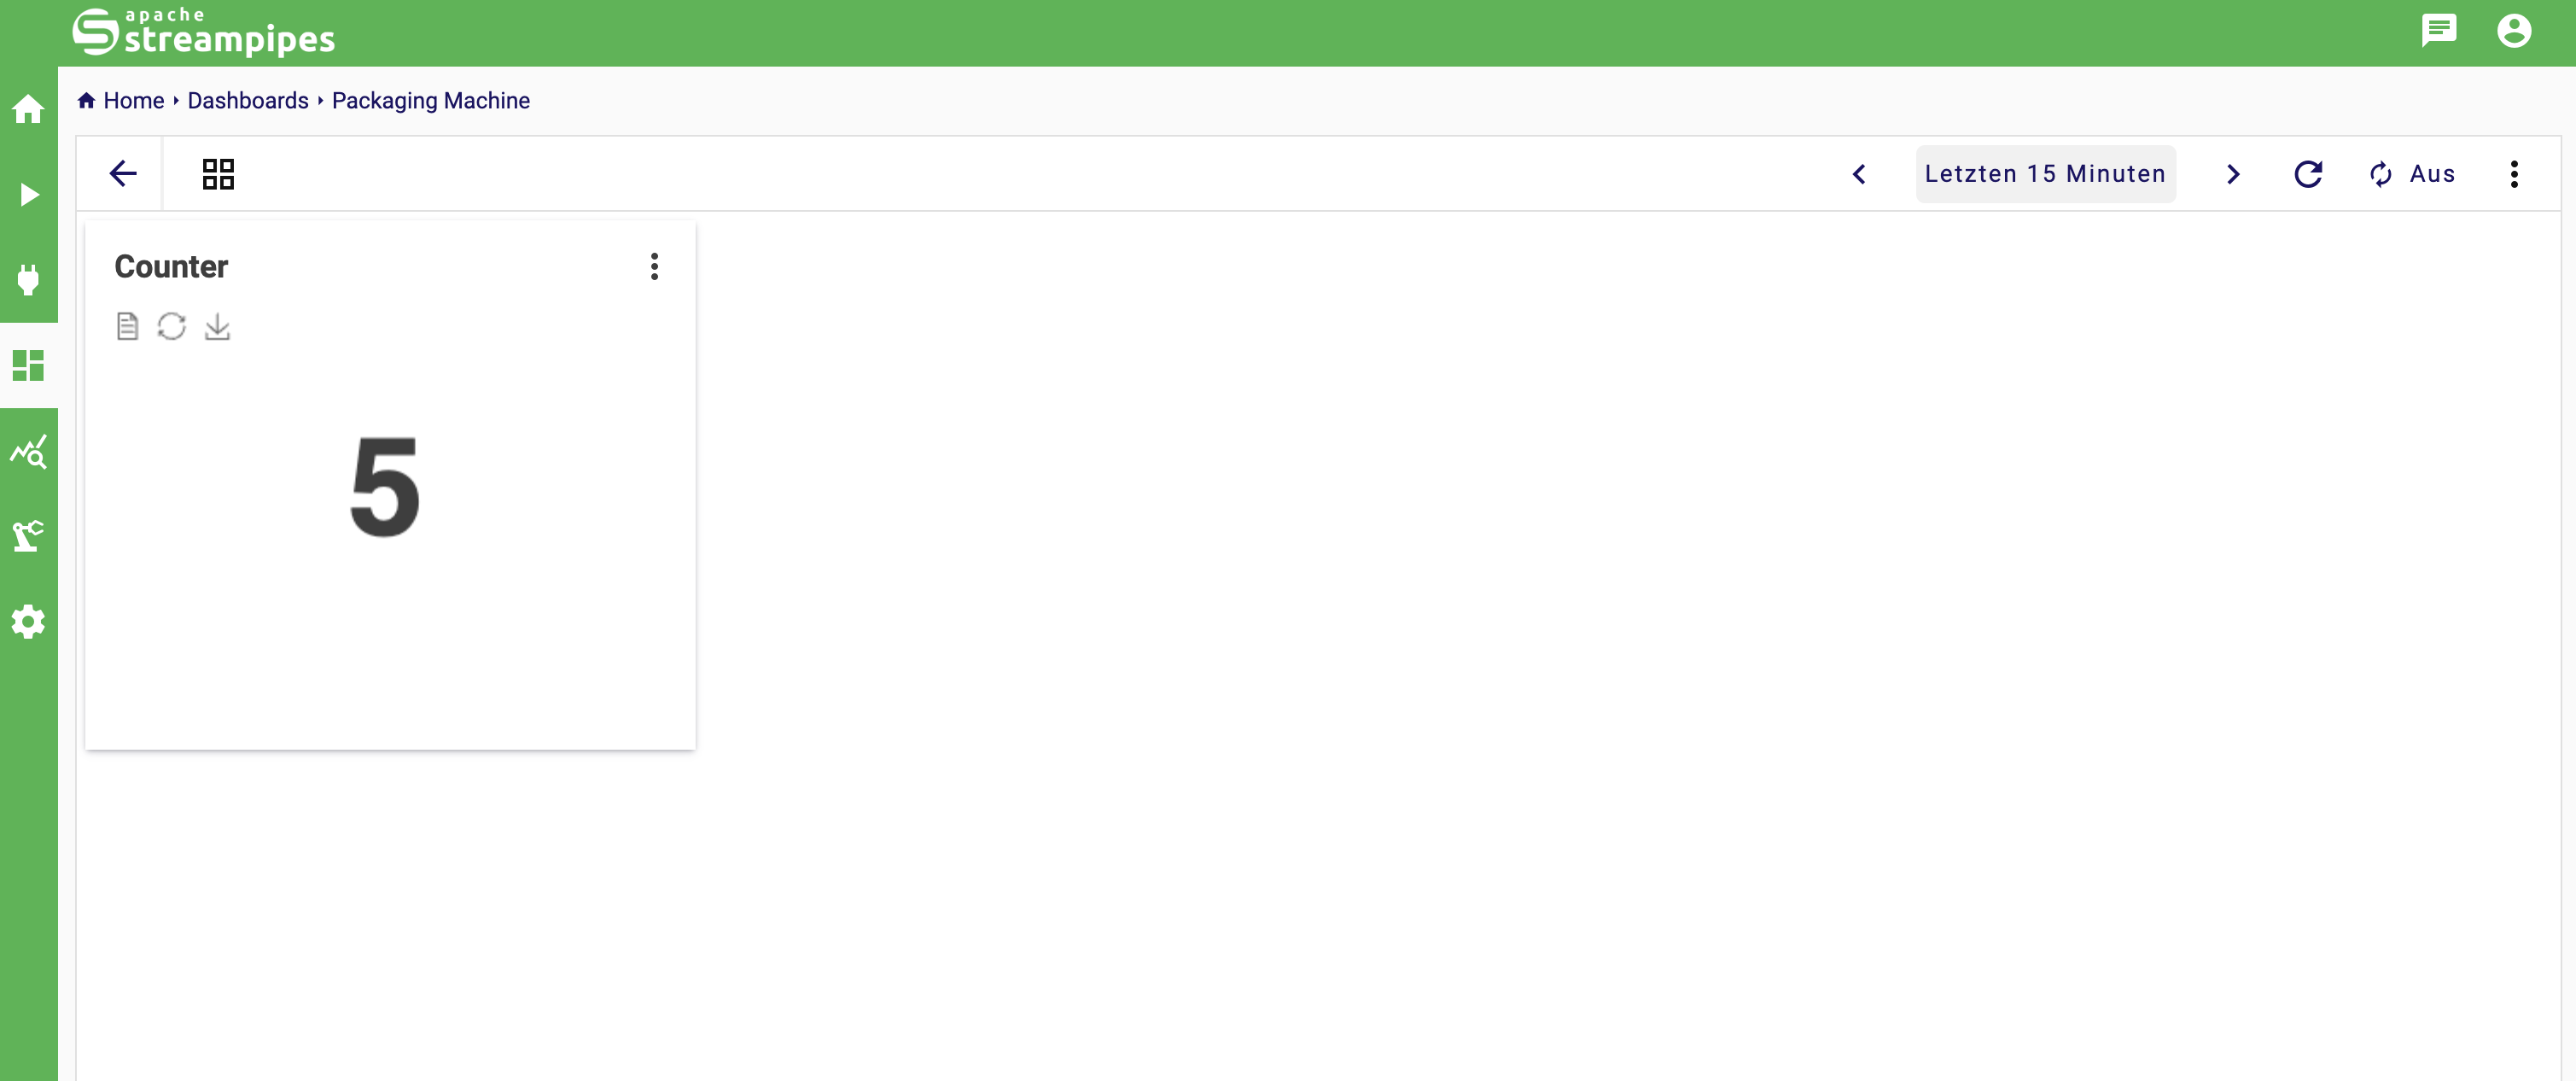
The live dashboard with an indicator chart showing the current number of goods produced
This setup gives you a live counter of how many products were packaged and notifies the maintenance team when attention is needed.
Part 2: Aggregated Counting Over Time
While a cumulative counter is useful, often it's more insightful to understand how usage varies over time — for example, how many items are processed each day.
A Time-Aggregated Approach
Instead of a total counter, we’ll now generate a single event for each packaging operation and then use the Data Explorer to visualize activity per hour or per day.
Alternative Pipeline Using Signal Edge Filter
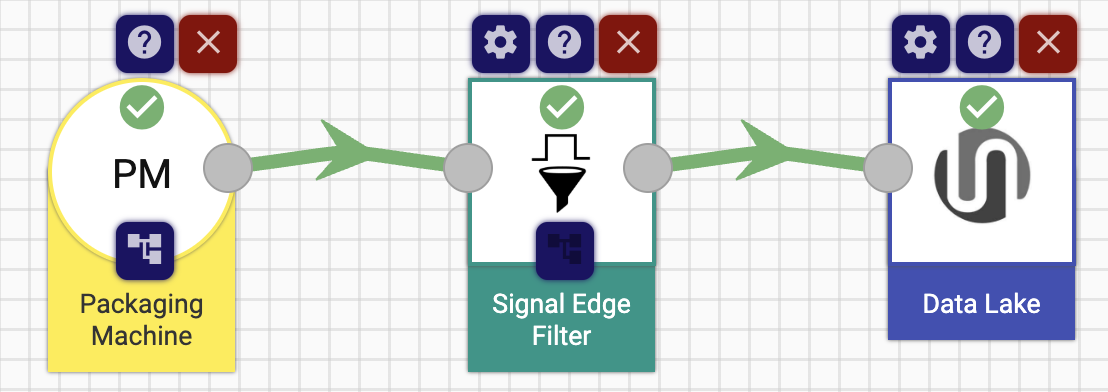
Pipeline to recognize when a part is being processed
Step-by-Step:
Replace the
Boolean Counterwith a Signal Edge Filter processor.- Filters events based on signal transitions.
- Configuration:
- Boolean Field:
active - Signal Edge:
FALSE → TRUE - Delay:
0 - Output Event Selection:
First
- Boolean Field:
Store the filtered stream in the Data Lake sink.
This gives one clean event per packaging operation — ideal for aggregation.
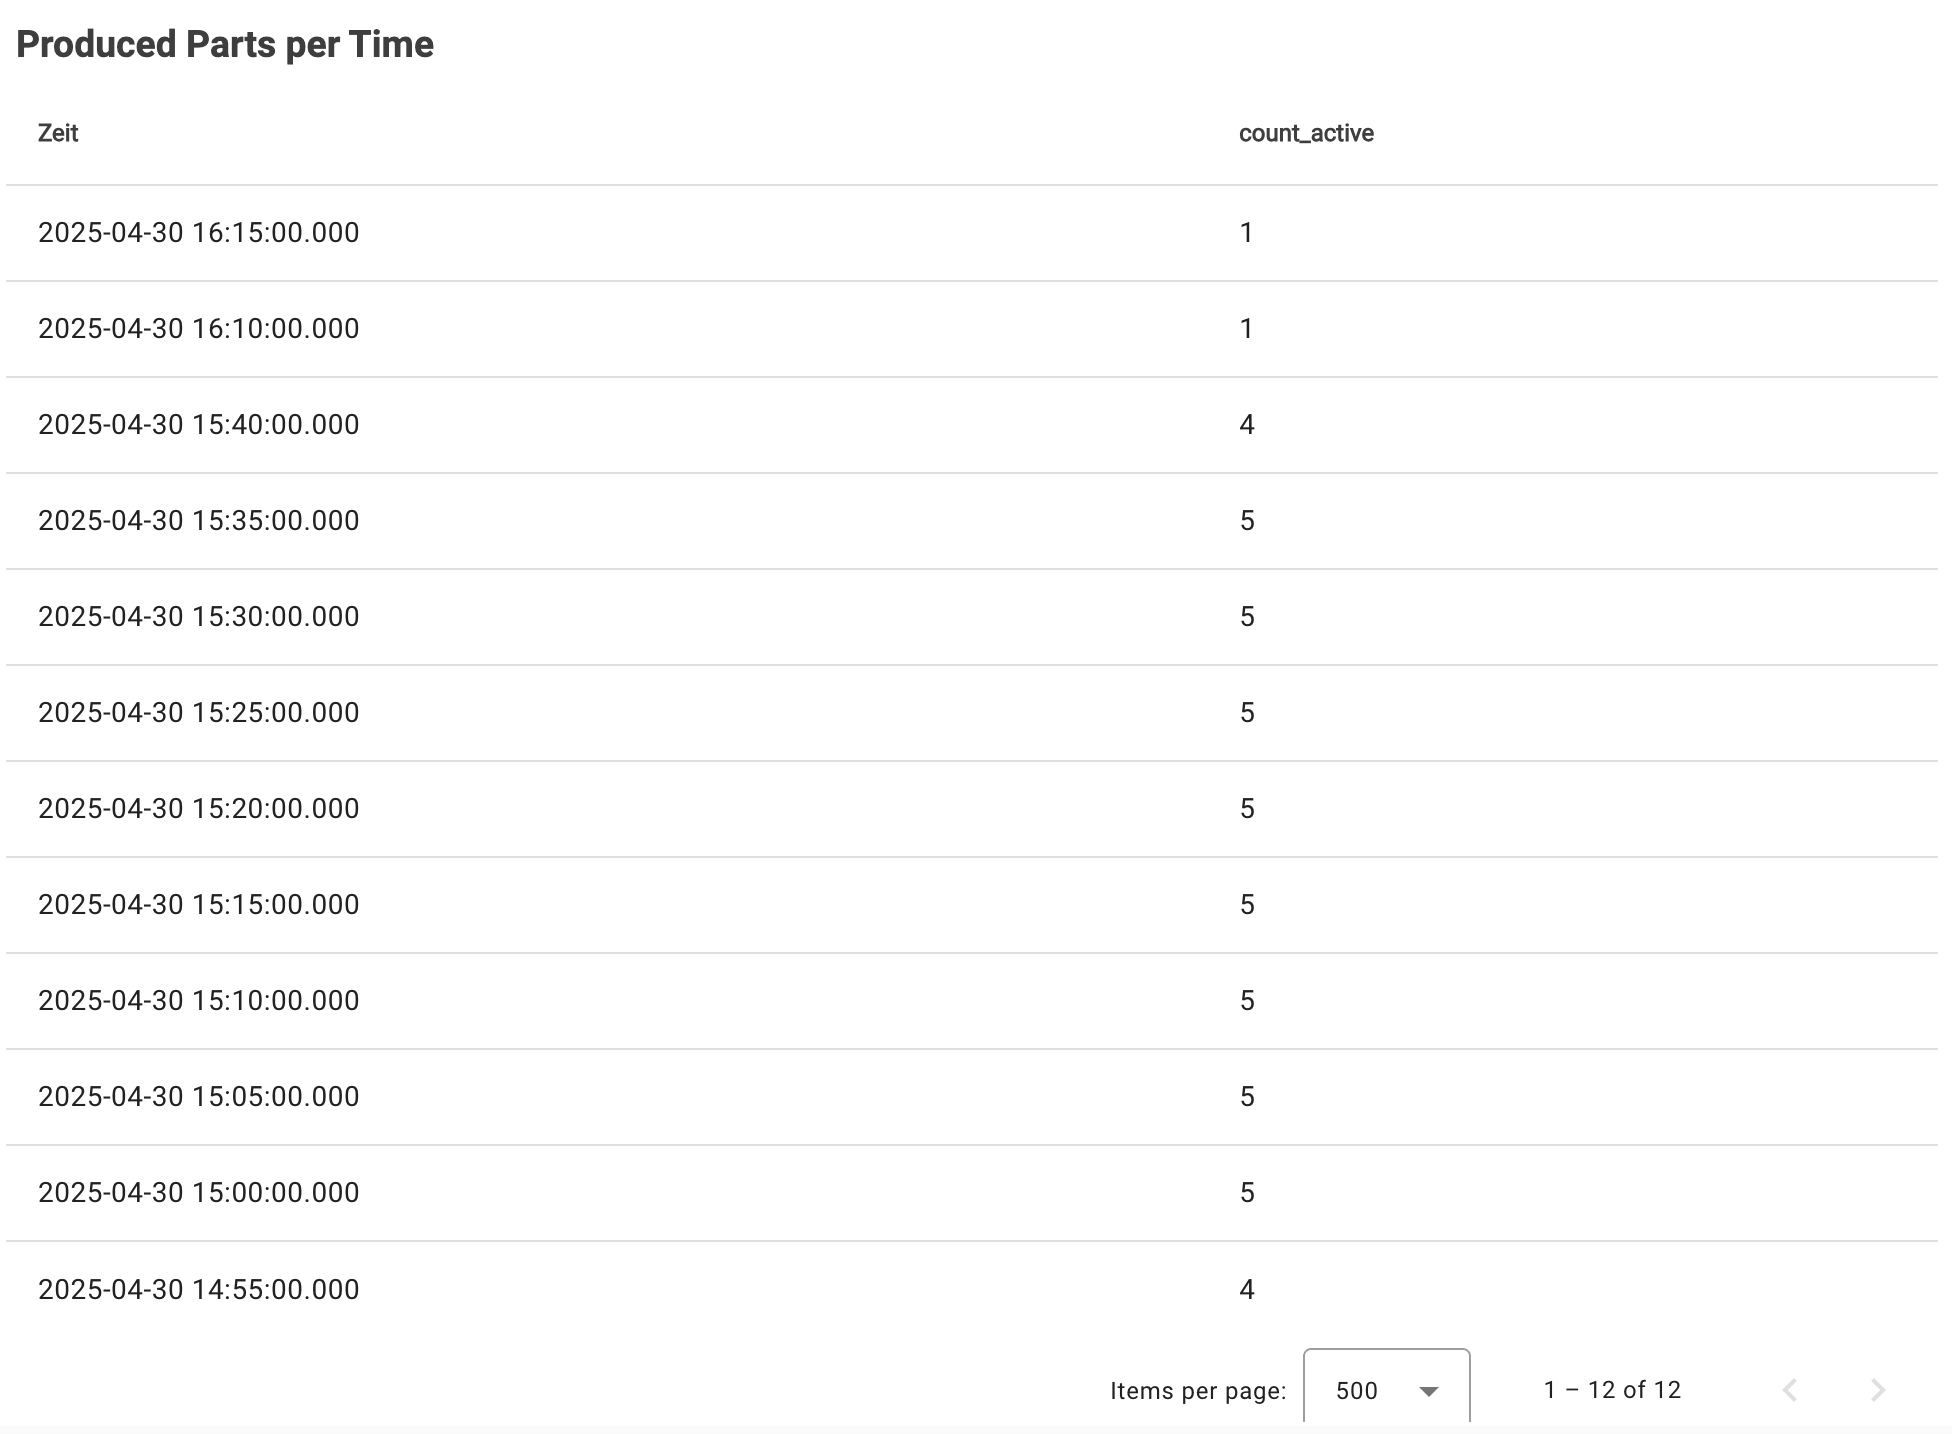
Visualization in the Data Explorer
Now that we have one event per packaging action, we can analyze the data over time in the Data Explorer.
- Open the Data Explorer
- Table View Configuration:
- Data Source: Select the stream used in the pipeline.
- Aggregation: Group by
HourorDay. - Field Aggregation: Use
counton any field to count the number of events.
- Bar Chart Visualization:
- Switch to a Time-Series Chart.
- Select the counted field.
- Choose
barfrom the chart type dropdown.
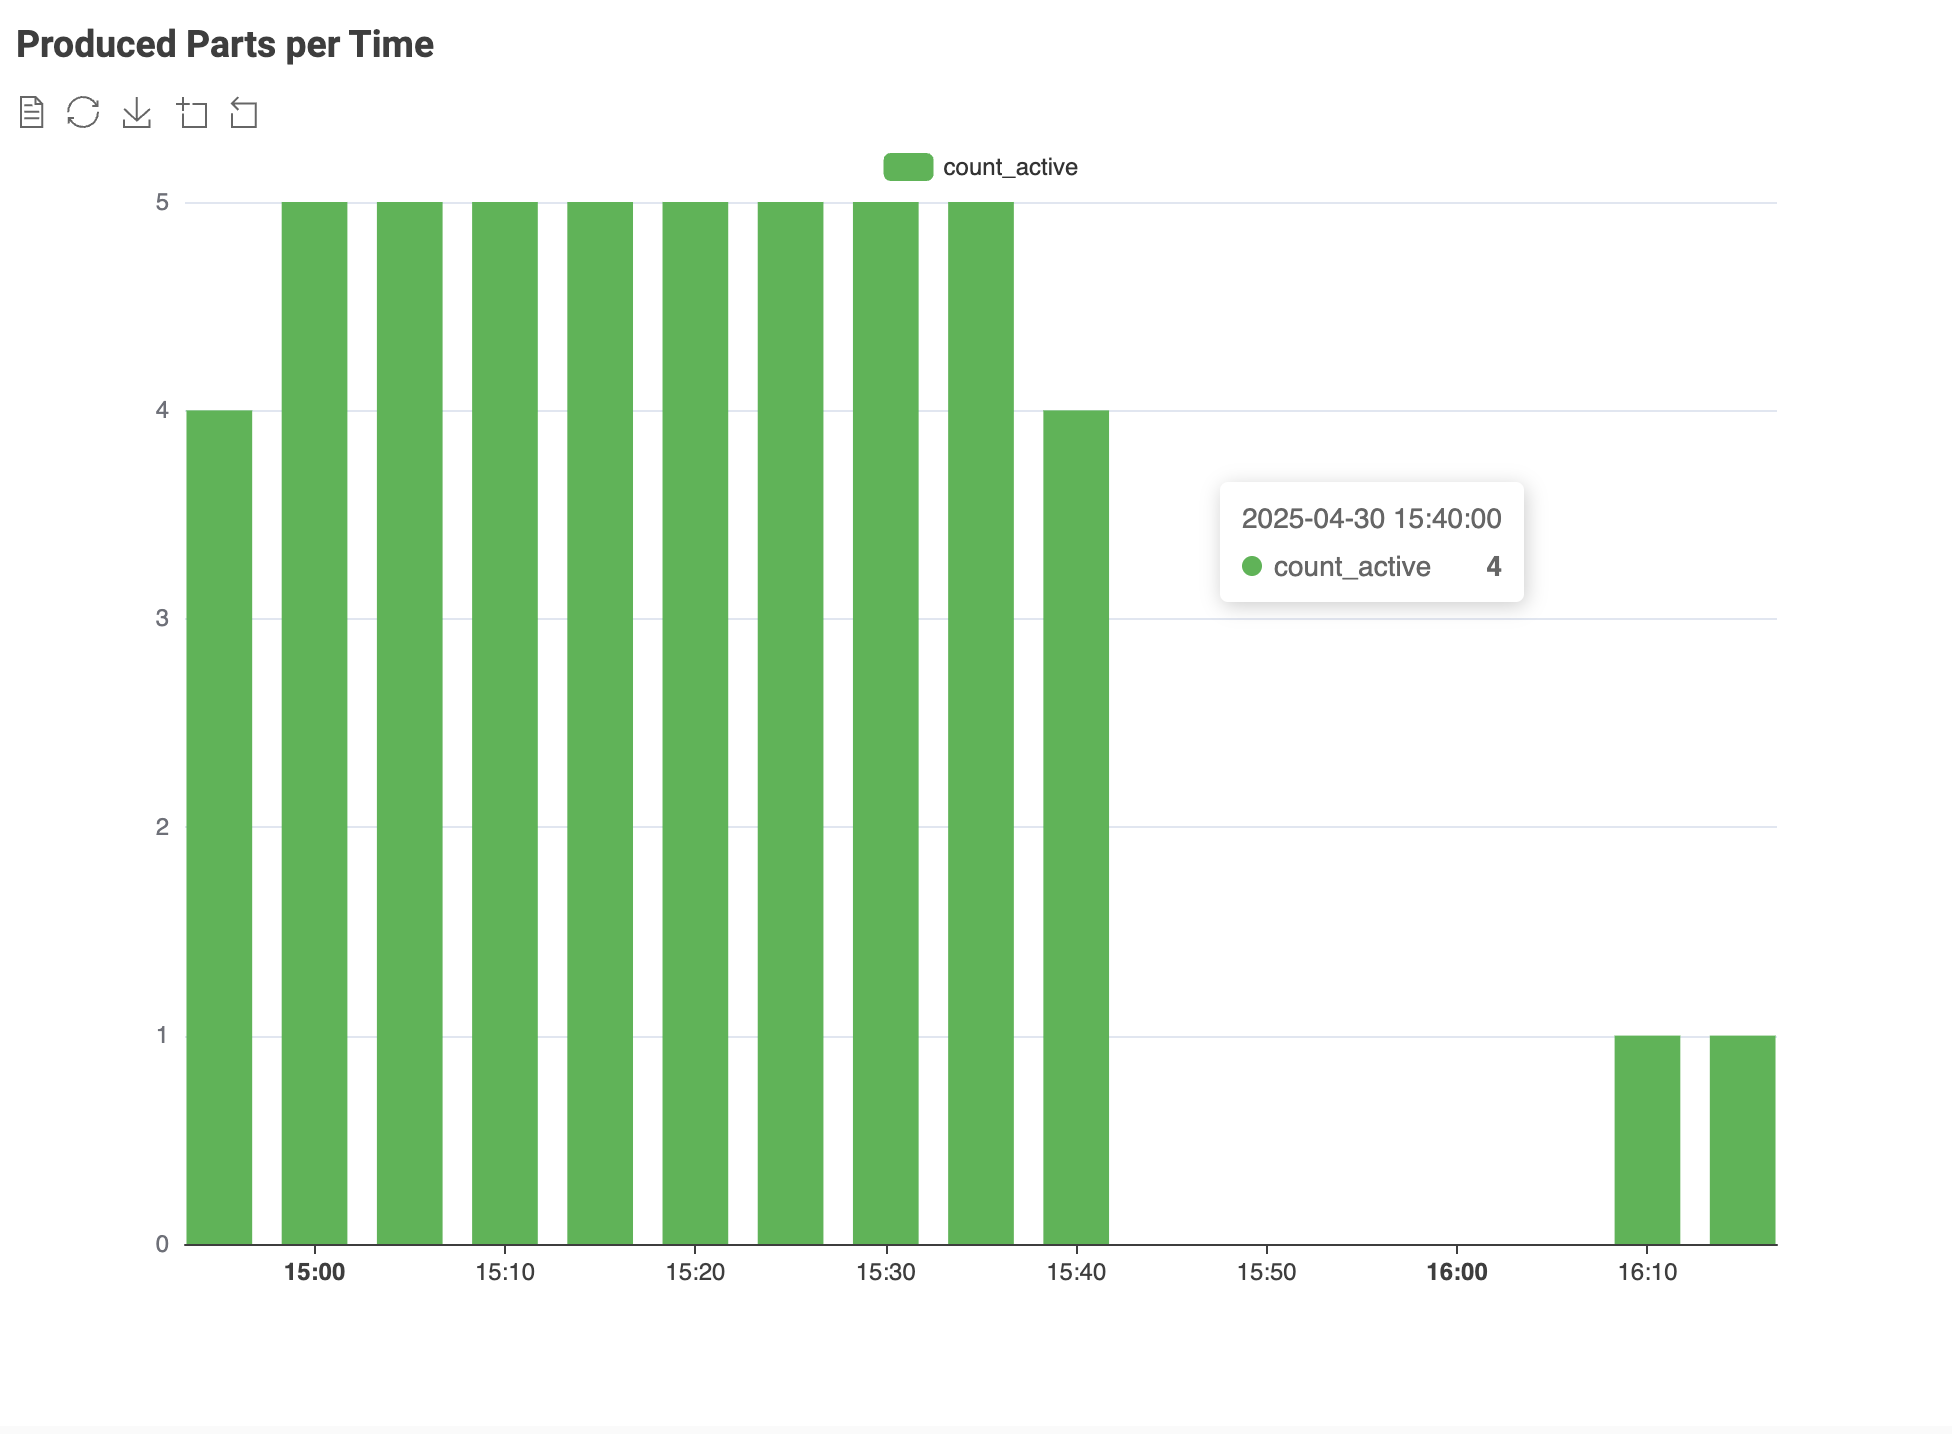
You now have a clear, time-based view of machine usage. This helps spot trends, detect unusual downtimes, and better plan maintenance.
Conclusion
In this post, we’ve shown how even limited sensor data — like a simple boolean signal — can be used to build powerful maintenance logic using Apache StreamPipes. With just a few clicks, you can:
- Count operations and trigger maintenance alerts
- Store and visualize historical data
- Understand machine usage over time with time-based aggregations
By replacing static maintenance intervals with actual usage insights, you can reduce unnecessary work and improve efficiency — all without needing to retrofit expensive new sensors.