
Data is the new oil. Probably everybody of you has heard or read this sentence before. It is often stated how important data and data understanding is for companies today. But what does this actually mean? How does the data look like that is produced by your machines and systems? And how can we solve the big challenge to turn this raw data into insights that can be understood by humans?
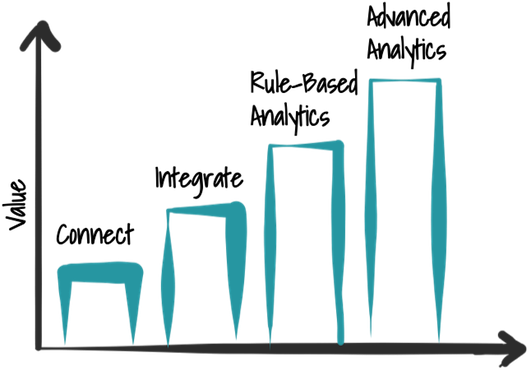
When it comes to data analytics people often talk about the big players like Google, Facebook, or Netflix which collect a lot of data about their users and their usage behavior. The core of their business model is to use data and turn it into profit. Nowadays all companies have the requirement to analyze their data. But since this was not originally part of their business model it is very challenging for them to catch up. To gain insights from data, it is often referred to advanced analytics and machine learning. Before such techniques can be used some work must be done. A first, basic part of that is to understand your data. We do that in four steps, as can be seen in figure below. First data sources must be accessed, then they can be integrated and for example be stored in a data lake. After that, we employ rule-based analytics to find patterns and situations. In the end, machine learning and advanced analytics algorithms can be used to get more out of the data. The idea behind those steps is to generate value as early as possible by collecting the low-hanging fruits first. We develop methodologies and tools for the individual steps to also allow domain experts to perform them to bridge the gap between the big tech companies and more traditional industries.
The questions we try to answer in these blog posts are:
- How does data produced by machines look like?
- How can machines and other data sources be accessed?
- How is it possible to process the continuously produced flow of data?
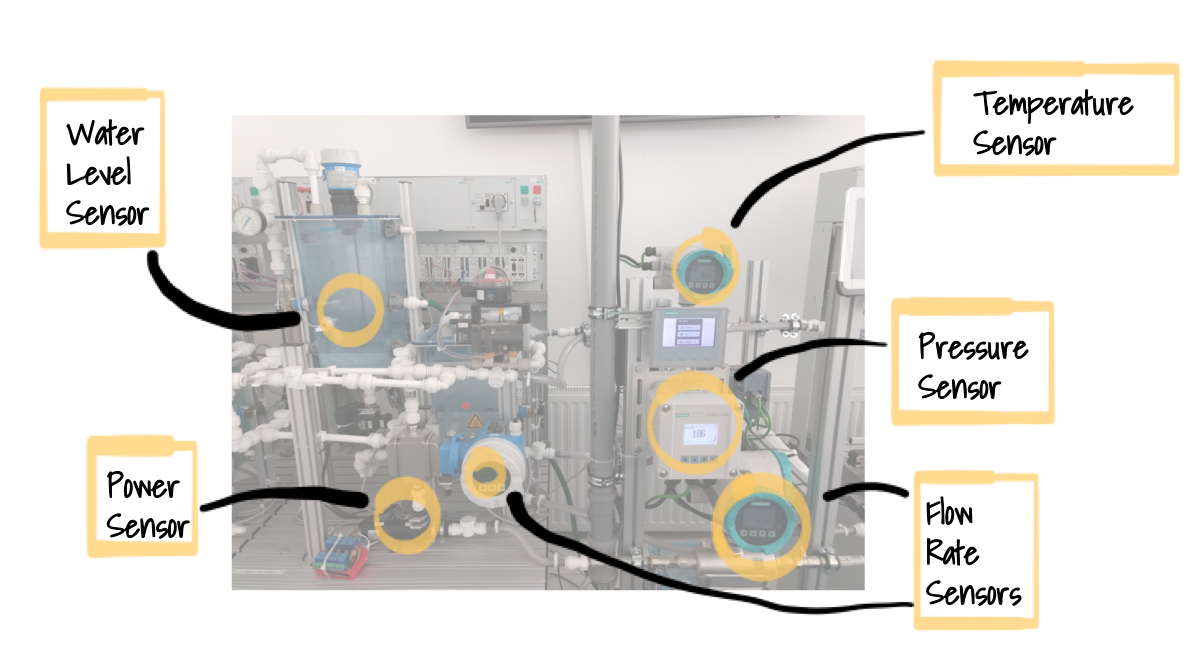
We illustrate our ideas with an example which we also use during the whole blog series. The example is a water circle of a cooling system. You can see such a system in the next image. It contains multiple water tanks and pipes that connect those tanks. Within the tanks and the pipes are multiple sensors, which measure for example the water level in the tank, the flow rate in the water pipe, or the temperature of the water. All those sensors are very simple, they make iterative observations and send the sensed measurements to a computer system.
Before we go into detail, we want to explain the term streaming data, because we focus on machine and sensor data which is continually produced in a streaming fashion. The opposite of streaming data are fixed sized data sets, called batch data. Since always new data is produced by sensors, it is not possible to wait till all data is completely produced and then process it. Different to that is batch data. The advantage of batch data is, when the processing starts no new data is added anymore. Streaming data can also be processed with batch processing systems. Therefore, a data stream must be separated into fixed chunks which are then processed in a batch fashion. This is possible but the more natural fit is to use streaming systems since they were designed to process streaming data.
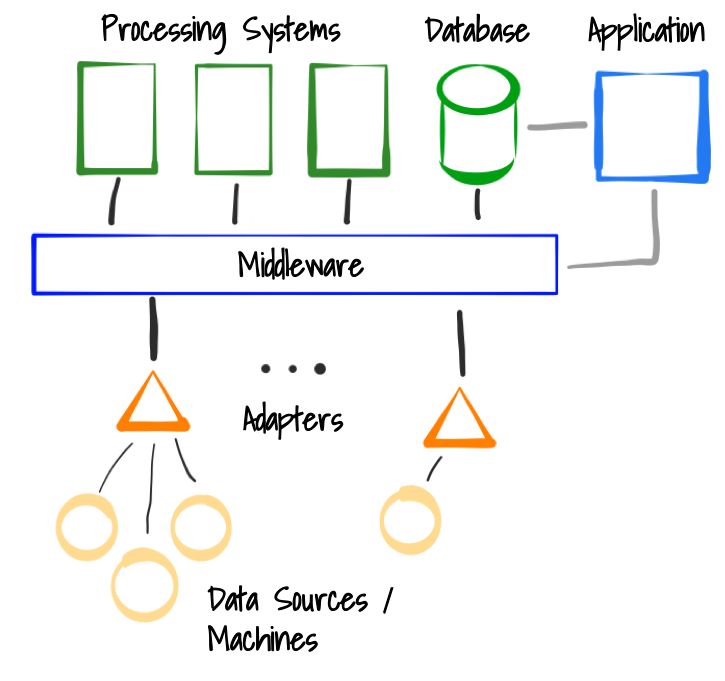
In an environment where we process machine data we have different components. The individual components exchange information in the form of events. All assets continually producing data are called data sources (i.e. a sensor, machine or a software system). To access these data sources, adapters are needed. Adapters are software components (which can run anywhere, for example directly on the machine or separately on a edge device near the machine) that are able to connect to the data source, extract the sensor information and emit events to the middleware. The middleware is a central component which is an intermediate between the individual components. Even if the middleware is a central component, it is not a bottleneck and also not a single point of failure since it is often realized in form of a distributed system. Processing systems can access data from the middleware, transform it and apply algorithms. This is the component where the data is analyzed and higher-level information is generated. In the end, results can be stored in data bases. From there, other applications like for example dashboards can access the calculated results. This is the high-level architecture of processing data streams.
Once the events are integrated into a middleware, it must be processed to detect situations and generate higher-level events. This can be done in an Event Processing Network (EPN). An EPN consists of one or multiple data sources, event processors transforming and detecting patterns in the data and finally data sinks, which can be data bases, alarms or other systems. Below such a pipeline is shown where we have two sensors as data sources: A flow rate sensor measuring the flow rate in a water pipe and a water level sensor in a water tank. It further contains three processing elements, each with a different functionality. The first one detects increases in the water tank, the second one filters out values under a defined threshold. The last of the processing elements detects when both situations occur within a defined time window. In the end, we employ a data sink, which triggers a notification for a service technician once the modeled situation occurs. We call such instances of EPNs processing pipelines.
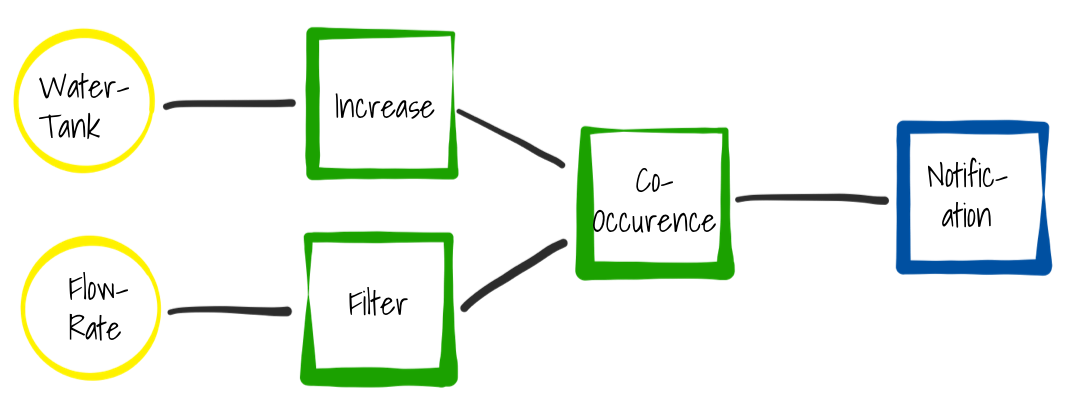
The pipeline in the image before contains three different processing elements. Those elements contain the actual algorithms. Such algorithms can be as easy as simple filters on a sensor value or can also be more complex, such as patterns that occur over a period of time. But they can also contain machine learning and advanced analytics algorithms (e.g. neural networks) that perform predictions on data streams. Event processors are just an abstraction that take a data stream as an input and expose a “new” data stream. Furthermore, they contain configuration parameters which can be defined by a user. With this concept, we can create reusable components that can be used in many different pipelines.
The goal of StreamPipes is to enable domain experts to do their data analysis themselves by providing tooling, where such processing pipelines can be modeled in a graphical user interface and then executed automatically without the need of an IT expert. Processing engines which are used as the basis of the processing elements in our solution often require a higher technological understanding. If this understanding is available, they can also be used on their own. We use such systems, like Apache Flink, Apache Spark or the brand-new KSQL by Confluent, for the processing but provide an abstraction over them to enable domain experts to model pipelines themselves. This has also the advantages that individual runtime solutions can be exchanged over time. Furthermore, we provide a semantic layer for all elements, including data sources, processing elements, and data sinks. With that layer, our system is capable of understanding the meaning and further support the user to ensure that just semantically correct pipelines are created.
In this first blog post of our series, we gave a first introduction how data produced by machines and systems can be analyzed and value can be generated out of it. In the following blog posts we explain the individual parts in more detail to provide you with enough knowledge to start analyzing your own data.
- Part 1: Overview
- Part 2: Data Sources
- Part 3: Data Processing Elements
- Part 4: Data Sinks
- Part 5: Putting it all together (Example Pipeline)
- Part 6: Practical Tips